StudentShare
Contact Us
Sign In / Sign Up for FREE
Search
Go to advanced search...
Free

Measuring the Electrical Resistivity of a Wire - Lab Report Example

Cite this document
Summary
The report "Measuring the Electrical Resistivity of a Wire" focuses on the critical analysis of the major peculiarities of measuring the electrical resistivity of a wire. The primary objective of performing this experiment was to examine the resistivity of a wire…
Download full paper File format: .doc, available for editing
GRAB THE BEST PAPER97.8% of users find it useful
Measuring the Electrical Resistivity of a Wire
Read Text Preview

Extract of sample "Measuring the Electrical Resistivity of a Wire"

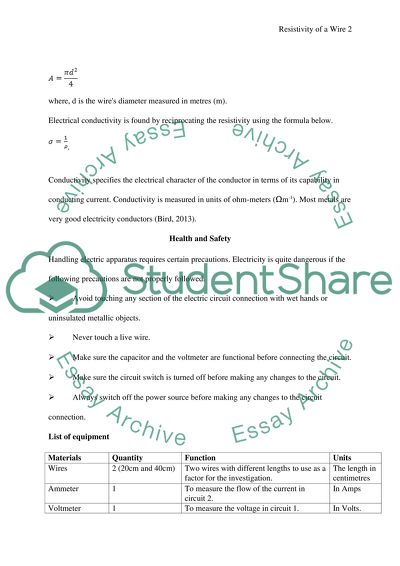
Measuring the Electrical Resistivity of a Wire Resistivity of a wire Introduction The primary objective of performing this experiment was to examine the resistivity of a wire. First, we hand to find the electrical resistance of the wire. Electrical resistance is what hinders the electric current to flow. The following factors affect the resistance of a wire; diameter, material, length of the wire, and temperature (Meaden, 2013). We used the diameter (thickness) of a wire as our primary factor in our experiment. Theory Ohms law of resistance relates the Voltage (V), Current (I), and resistance R of the conductor through which the current flows (Weber, 2013). For a piece of the conductor, its resistance is determined using the following relationship; , where I is the unit through which current is measured, V is the unit of measure of voltage and R is the unit of measure of the Resistance of the conductor. The resistivity ρ of a wire is not dependent on the wire characteristics but relates to its resistance R through the following formulas (Borup, 2012). , Where, L is the length of the wire where the voltage is measured, and A is the area of the cross-section of the wire. Resistivity is measured in ohm-meters (Ωm). The cross sectional area can be determined using the following formula. where, d is the wires diameter measured in metres (m). Electrical conductivity is found by reciprocating the resistivity using the formula below. . Conductivity specifies the electrical character of the conductor in terms of its capability in conducting current. Conductivity is measured in units of ohm-meters (Ωm-1). Most metals are very good electricity conductors (Bird, 2013). Health and Safety Handling electric apparatus requires certain precautions. Electricity is quite dangerous if the following precautions are not properly followed. Avoid touching any section of the electric circuit connection with wet hands or uninsulated metallic objects. Never touch a live wire. Make sure the capacitor and the voltmeter are functional before connecting the circuit. Make sure the circuit switch is turned off before making any changes to the circuit. Always switch off the power source before making any changes to the circuit connection. List of equipment Materials Quantity Function Units Wires 2 (20cm and 40cm) Two wires with different lengths to use as a factor for the investigation. The length in centimetres Ammeter 1 To measure the flow of the current in circuit 2. In Amps Voltmeter 1 To measure the voltage in circuit 1. In Volts. Battery Eliminator 1 To replace batteries in all the circuits and provide power. And to convert the voltage to a usable form. - Ohmmeter ( rheostat) 1 To record and adjust the current or the varying of the resistance. - Vernier calliper 1 To measure the diameter of the wires. Millimetre2 Scissors 1 To cut the casing of the wire for making the circuits. - Stationary Pencil: 1 Paper: 1 Calculator: 1 To record the readings for an accurate data collection and form calculations needed for data processing. - Diagram Figure 1: Figure 2: Figure 3: Figure 1: Consist of a battery power source and a voltmeter. Figure 2: Consist of a battery power source, an ammeter and rheostat. Figure 3: Consists of a battery power source, an ammeter, a rheostat and a space for placing wires of different thickness. Procedure All the required apparatus were set as shown in the diagram above. Step one: two wires of the same length and different thickness were cut. Their measurements were recorded. Step two: A circuit was created having the following, a voltmeter, an ammeter, a rheostat and a battery power source and the factor (wire of greater thickness). Step three: Measurements of the voltage were made on different points of the wire using the voltmeter. The measurements were recorded two times to obtain accuracy. Step four: With the help of an ammeter, the current was measured and recorded two times. Step four: Resistance was calculated after the average voltage and current were obtained. Step five: Resistivity was calculated and recorded. Step six: the above steps were repeated using the thinner wire. Result: Data collection, processing, presentation and analysis Specification Wire A Area 2.411 x 10⁻⁷m2 Diameter of the wire 5.54 x 10⁻⁴m Material Iron Table 1: Recordings of the thick wire Length (m) First Second Average Resistance® () Voltage (V) Current (A) Current (A) Voltage (V) Current (A) Voltage (V) 0.2 1.18 3.08 3.14 1.19 3.11 1.19 0.38 0.3 1.33 2.33 2.34 1.34 2.335 1.34 0.57 0.4 1.42 1.86 1.87 1.43 1.865 1.43 0.76 0.5 1.48 1.5 1.58 1.5 1.54 1.49 0.97 0.6 1.53 1.32 1.34 1.55 1.33 1.54 1.16 0.7 1.57 1.16 1.17 1.58 1.165 1.58 1.35 0.8 1.59 1.03 1.05 1.61 1.04 1.60 1.54 0.9 1.61 0.94 0.99 1.63 0.965 1.62 1.68 1.0 1.64 0.85 0.86 1.69 0.855 1.67 1.95 Diagram one: Resistance R against Length L of the wire. Resistivity ρ = gradient () x cross section area (A) = 1.9386 x 2.4111 x 10-7 = 4.679 x 10⁻⁷ Ωm Measuring resistivity in the thinner wire Specification Wire A Area 5.60 x 10⁻⁷m2 Diameter of the wire 2.67 x 10⁻⁴m Material Iron Length (m) First Second Average Resistance() Current (A) Voltage (V) Current (A) Voltage (V) Current (A) Voltage (V) 0.2 1.05 1.6 1.08 1.6 1.07 1.60 1.50 0.3 0.73 1.68 0.75 1.67 0.74 1.68 2.26 0.4 0.56 1.72 0.57 1.72 0.57 1.72 3.04 0.5 0.47 1.75 0.47 1.75 0.47 1.75 3.72 0.6 0.39 1.77 0.39 1.77 0.39 1.77 4.54 0.7 0.34 1.79 0.34 1.78 0.34 1.79 5.25 0.8 0.30 1.8 0.3 1.8 0.30 1.80 6.00 0.9 0.27 1.82 0.27 1.81 0.27 1.82 6.72 1.0 0.25 1.85 0.24 1.83 0.25 1.84 7.51 Table 2: Recordings of the thinner wire Diagram two: Resistance R against Length L of the thin wire. Resistivity ρ = gradient () x cross section area (A), = 7.4879 x 2.4111 x 10-7 = 4.1925 x 10⁻⁷ Ωm Measure of Validity Validity is the process of determining whether or not the obtained data is correct and the degree of its validity (Holm, 2013). The process is done by obtaining the percentage errors in the readings reflecting the data accuracy. Percentage error: In every experiment, error are meant to occur due to measurement accuracies (Mathsisfun.com, 2012). In our experiment, we used the meter ruler where reading were made by eye observation. Direct observation can give different records due to different angles of view. The voltmeter and the ammeter also give wrong readings if they are not correctly calibrated. The following were the known uncertainties of the apparatus used: Meter rule 0.0005m Ammeter 0.01A Voltmeter 0.01V Percentage of uncertainty Voltmeter Thick wire Thin wire Voltage (V) Percentage of uncertainty %() Voltage (V) Percentage of uncertainty%(() 1.19 0.843 1.60 0.625 1.34 0.749 1.68 0.597 1.43 0.701 1.72 0.581 1.49 0.671 1.75 0.571 1.54 0.649 1.77 0.564 1.58 0.634 1.79 0.560 1.60 0.625 1.80 0.555 1.62 0.61 1.82 0.55 1.67 0.60 1.84 0.543 Table 3: Voltmeter Percentage errors Meter Ruler Length (m) % Uncertainty () 0.50 0.2 1.00 0.1 Table 4: Meter rulers uncertainty Thick wire Thin wire Current (A) Percentage of uncertainty %() Current (A) Percentage of uncertainty%(() 3.11 0.321 1.07 0.93896 2.335 0.4282 0.74 1.3513 1.865 0.536 0.57 1.7699 1.54 0.6493 0.47 2.1276 1.33 0.7518 0.39 2.564 1.165 0.8583 0.34 2.9411 1.04 0.9615 0.30 3.333 0.965 1.058 0.27 3.703 0.855 1.1695 0.25 04.081 Table 4: Uncertainty of Ammeter recordings Uncertainty of Resistance Percentage of uncertainty %() for thick wire Percentage of uncertainty %() for Thin wire 1.563967136 1.165425265 1.948366277 1.177329195 2.351306853 1.237947415 2.699088146 1.320491589 3.129074316 1.401230349 3.50140056 1.493289734 3.888888889 1.586538462 4.254667891 1.675485009 4.625110914 1.770191244 Table 5: Uncertainty of Resistance for both wires. Uncertainty of Resistivity Percentage of uncertainty %() of Thick wire Percentage of uncertainty %() of Thin wire 1.265425265 1.763967136 1.277329195 2.148366277 1.337947415 2.551306853 1.420491589 2.899088146 1.501230349 3.329074316 1.593289734 3.70140056 1.686538462 4.088888889 1.775485009 4.454667891 1.870191244 4.825110914 Table 6: Uncertainty of resistivity for both wires Improvements The next time we perform an experiment on the resistance of the conductor, we would first conduct research on the various factors affecting the resistance of the conductor in use and choose the most effective one. Consider using quality DC batteries that dont heat during the experiment lowering the current. Make more readings to confirm the accuracy of the data collected. Use of wires of equal Iron purity. Discussion The experiment was performed by regulating the voltage on the circuit. Due to this regulations, the current flowing through the Iron conductor also changed. The reading of the different voltages were recorded and the corresponding current. Resistance was determined from the obtained recordings of the voltages and current. In the graphs obtained by plotting resistance against the length, it can be seen clearly how the length is proportionally related to the resistance. As the length increases so do the resistance. It clearly shows that our graph obeys Ohms law since the line passes through the origin (Physicsclassroom.com, 2012). The rest of the experiment’s results are the tables and graphs to find the resistance and resistivity of the two wires. The resistance graphs consist of plottings of Voltage against Current. We were able to obtain each resistance by calculating the gradient of the respective graph. From the graphs, its visible how the Voltage is directly proportional to the resistance. After obtaining the resistance, we were able to calculate the resistivity of each wire. The resistivity was obtained using the formulas stated in the sections above. During the experiment, we considered the potential errors to calculate the final results. Such errors included the uncertainty of each apparatus, the different pureness of the Iron wires and the room temperatures. The errors were eliminated by either adding or removing them in the data readings before recording. Due to the resistance of iron to current flow, it became hot raising the resistivity of the iron conductor. Conclusion Measuring the resistance in a thick and thin wire gave us precise data to work on in obtaining their resistivity. However, if we could have taken wires of same Iron purity, our data would have been more accurate and reliable. However, we believe the experiment went on well as planned. We managed to use effectively the assigned time to gather as much information as we required to complete the experiment. References Meaden, G. (2013). Electrical resistance of metals. New York: Plenum Press. Bird, J. (2014). Electrical circuit theory and technology. Routledge. 18-35 Borup, K. A., Toberer, et al. (2012). Measurement of the electrical resistivity and Hall coefficient at high temperatures. Review of Scientific Instruments, 83(12), 123902. Holm, R. (2013). Electric contacts: theory and application. Springer Science & Business Media. 58-61. Mathsisfun.com, (2012). Percentage Error. [online] Available at: https://www.mathsisfun.com/numbers/percentage-error.html [Accessed 14 Jun. 2015]. Physicsclassroom.com, (2012). Resistance. [online] Available at: http://www.physicsclassroom.com/class/circuits/Lesson-3/Resistance [Accessed 14 Jun. 2015]. Weber, Bent, et al. (2013)"Ohm’s law survives to the atomic scale." Science 335.6064 (2012): 64-67. Read More
Cite this document
  • APA
  • MLA
  • CHICAGO
(“Measuring the electrical resistivity of a wire Lab Report”, n.d.)
Retrieved from https://studentshare.org/physics/1698244-measuring-the-electrical-resistivity-of-a-wire
(Measuring the Electrical Resistivity of a Wire Lab Report)
https://studentshare.org/physics/1698244-measuring-the-electrical-resistivity-of-a-wire.
“Measuring the Electrical Resistivity of a Wire Lab Report”, n.d. https://studentshare.org/physics/1698244-measuring-the-electrical-resistivity-of-a-wire.
  • Cited: 0 times

CHECK THESE SAMPLES OF Measuring the Electrical Resistivity of a Wire

Electric Motors and Accuracy of Instrumentation System

All the electrical motors work on a common principle i.... The armature is mounted on bearing and there is winding of conduction wire on it.... Q1.... (a) Electric motor is a device which converts electric energy into mechanical energy.... .... a torque is produced on a current carrying loop; when it is placed in a magnetic field and this torque produces rotation in the loop as schematically shown in Fig....
4 Pages (1000 words) Essay

Thermocouple and thermistor

Thermoelectric and resistive devices are based on the transmission of a fraction of the quantity thermal energy of the object to a contact sensor that has the ability to convert the heat energy into an electric signal that can be used for measuring the temperature of the object.... These are exposed or bare-wire junction, grounded junction, ungrounded or isolated junction, and reduced diameter junction.... In the exposed or bare-wire junction the sheath and insulating material are removed causing exposure of the thermocouple wires and are joined to create a measuring junction....
10 Pages (2500 words) Essay

Forensic Archaeology

Various types of resistivity of electrode array are; Wenner array and pole-pole array.... ome factors which cause potential for avoiding the resistivity of the ground includes buried body interruptions which take place while burying the body.... Practical case this method conducted by passing electricity between two electrodes and calculate the electrical potential (V) in this area.... Based on the feature of the place of occurrence of crime, forensic archeologists adopt various geographical Ground Penetrating Radar GRP) and resistivity Mapping are the two popular techniques in this field....
12 Pages (3000 words) Essay

Stress strain experiment

The electrical resistance R of a wire of length L with cross-sectional area A can be illustrated by the formulae; Where is the strain.... The principle of operation is based on electrical resistivity of the wire.... raph of stress against strain when a wire of area 122.... For mild steel; =1250For aluminium; E=2346Graph of stress against strain when a wire of area 19.... rom the above equation we can draw an inference that the electrical resistance of the wire changes with strain:i....
2 Pages (500 words) Lab Report

Resistor Manufacture and Optimization

The operating principle behind a resistor is that the component is comprised of a conducting material that has a specific value of resistivity.... he resistors provide resistivity ranging from 0.... Since the heat generated in resistivity is distributed throughout the resistor, the heat dissipated by the resistor is thus evenly distributed in the component, unlike other types of capacitors....
5 Pages (1250 words) Book Report/Review

Lightning Protection of Electrical Substations

The writer of the paper “Lightning Protection of electrical Substations” states that the lightning protection measures prescribed in the BS EN/IEC 62305 will help reduce the negative impact of a lightning strike by minimizing the risk of damage and allowing the service to be restored expeditiously.... Substation electrical and electronic equipment suffer damage both due to the high energy released from a direct strike as well as from the surge energy carried through the transmission lines....
37 Pages (9250 words) Thesis

Strain Gauge Calibration

hellip; As the object is being deformed, the foil is also experiencing deformation, causing a change in its electrical resistance.... A strain gauge utilizes the advantage of its physical property (electrical conductance) and the fact that it depends on the conductors.... When an electrical conductor is stretched to the limits of its elasticity ensuring that it does not break or deform on a permanent basis, it becomes longer and narrower, changes that increase its electrical resistance end-to-end....
5 Pages (1250 words) Lab Report

EAT118 Electrical Laboratory Exercises

The results obtained after carrying this procedure were used in determining the resistivity of the pencil lead.... he copper wire was wound around the iron nail to make a coil with 60 turns.... The length of the conductor was then varied by compressing or stretching the wire coil to investigate the effect on inductance.... This work called "EAT118 electrical Laboratory Exercises" describes the three basic devices used in electronic circuits....
7 Pages (1750 words) Lab Report
sponsored ads
We use cookies to create the best experience for you. Keep on browsing if you are OK with that, or find out how to manage cookies.
Contact Us