- Home
- Free Samples
- Premium Essays
- Editing Services
- Extra Tools
- Essay Writing Help
- About Us
- Studentshare
- Subjects
- Miscellaneous
- INTRODUCTORY FINANCIAL ACCOUNTING (MM1F2
INTRODUCTORY FINANCIAL ACCOUNTING (MM1F2 - Essay Example
Case facts…

- Subject: Miscellaneous
- Type: Essay
- Level: Undergraduate
- Pages: 4 (1000 words)
- Downloads: 0
- Author: schmelereliane
Extract of sample "INTRODUCTORY FINANCIAL ACCOUNTING (MM1F2"
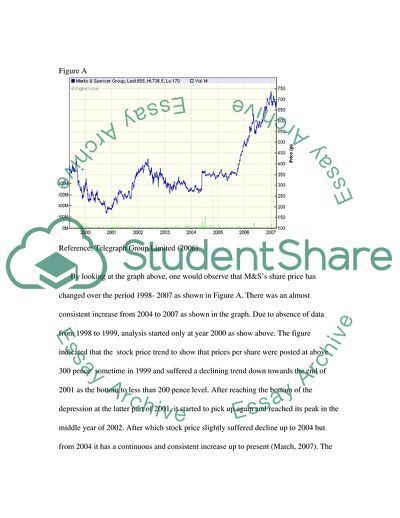
Following this, Stuart Rose was appointed Chief Executive. By April 2006 shares in M&S were trading at nearly 590p.” The case facts would appear to show there is something significant with the increase in prices of stocks of the company for the past three years. (i) A description of how M&S’s share price has change over the period 1998 – 2007, highlighting any key changes. This description should be supported by a graph of M&S share price over this same period. By looking at the graph above, one would observe that M&S’s share price has changed over the period 1998- 2007 as shown in Figure A.
There was an almost consistent increase from 2004 to 2007 as shown in the graph. Due to absence of data from 1998 to 1999, analysis started only at year 2000 as show above. The figure indicated that the stock price trend to show that prices per share were posted at above 300 pence sometime in 1999 and suffered a declining trend down towards the end of 2001 as the bottom to less than 200 pence level. After reaching the bottom of the depression at the latter part of 2001, it started to pick up again and reached its peak in the middle year of 2002.
After which stock price slightly suffered decline up to 2004 but from 2004 it has a continuous and consistent increase up to present (March, 2007). The most significant therefore to find was: What happened from 2004 to 2007? This, we will attempt to answer to the next section. (ii) A description of how various financial ratios have changed over the period 1999-2006 and an explanation of how these changes might link with the changing share price identified in (i) above. This description and explanation should be supported by a table of relevant ratios for the period.
By observing Table A above, one would notice that revenues for years 2003 through 2006 indicated declining trend at £8.0, £83, £7.5, and £7.8 billions for the years 2003 , 2004, 2005 and
...Download file to see next pages Read MoreCHECK THESE SAMPLES OF INTRODUCTORY FINANCIAL ACCOUNTING (MM1F2
Innovation Energy: Futuristic Perspectives on CO2-EOR Technologies
Financial Accounting
Financial accounting
Financial Accounting
Financial Accounting Standards
Financial and Management Accounting
Introductory financial accounting
Software Tools in the Computerized Accounting Information System

- TERMS & CONDITIONS
- PRIVACY POLICY
- COOKIES POLICY