StudentShare
Contact Us
Sign In / Sign Up for FREE
Search
Go to advanced search...
Free

Forecasting the Stock - Assignment Example

Cite this document
Summary
This paper tells that the forecast of a stock and the return is important since it would enable the investors to predict the range of their prices and performance of the companies. To forecast or model such data like the stock and their return, several aspects of the time series must be put into consideration…
Download full paper File format: .doc, available for editing
GRAB THE BEST PAPER94.1% of users find it useful
Forecasting the Stock
Read Text Preview

Extract of sample "Forecasting the Stock"

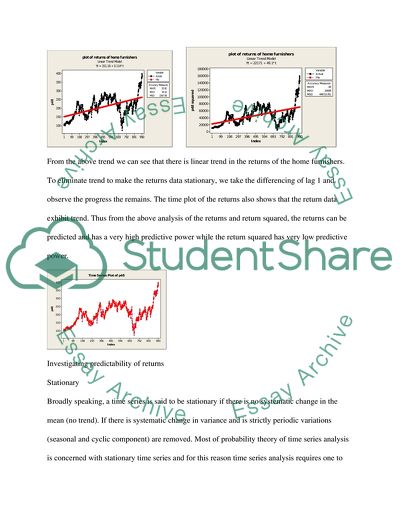
Forecasting the stock of series one and stock of series two The forecast of stock and the return is important since it would enable the investors to predict the range of their prices and performance of the companies. To forecast or model such data like the stock and their return, several aspects of the time series must be put into consideration. Such aspects include; the trend, seasonal component, cyclic component, and the random error component. A log return of stock one and the return data exhibit trend component and this component can be eliminated by many methods of time series. Such methods may include differencing the revenue series with a difference of four, taking a moving average and many others. Predictability of the returns and return squared Since in this data we are focused on 2002 to 2006 we see that the seasonal and the cyclic component are present. We take a time plot of the returns data of home furnishers to investigate if the data exhibit trend in this case. From the above trend we can see that there is linear trend in the returns of the home furnishers. To eliminate trend to make the returns data stationary, we take the differencing of lag 1 and observe the progress the remains. The time plot of the returns also shows that the return data exhibit trend. Thus from the above analysis of the returns and return squared, the returns can be predicted and has a very high predictive power while the return squared has very low predictive power. Investigating predictability of returns Stationary Broadly speaking, a time series is said to be stationary if there is no systematic change in the mean (no trend). If there is systematic change in variance and is strictly periodic variations (seasonal and cyclic component) are removed. Most of probability theory of time series analysis is concerned with stationary time series and for this reason time series analysis requires one to change a non-stationary time series to a stationary time series analysis so as to use it. In this study we plot the variables and test their stationary using a particular variation of unit root test- the Augmented Dickey-Fuller test. We then difference the time series of return to make the series stationary. Analysis of the residuals (errors) After differencing the return data we can observe that the data is stationary. This can be clearly seen in the time series plot of the differenced data at lag. The plot of differenced data of returns below shows that the data is stationary after differencing it once. From the above plot of the differenced data it is clear that the time series of return cuts off at lag 1. Thus the best auto regressive (AR) to model the residuals is the AR(1). The pair trading is a common thing in the trading market. Literature on pair trading, market efficiency and return volatility behavior is plenty for a developed stock market. The study involves pair trading using the following three models; correlation matrix and co-integration model or CAPM. In this study we will investigate which of these models is efficient in investigating the pair trading of the stock. The study will investigate the stock of USA companies using there models; correlation matrix, co-integration model and CAPM model. Theoretical frame work Efficient markets are necessary prerequisite if it is desired that funds should be allocated to the highest valued projects. A stock market is termed as efficient if the price fully reflects all information in the markets. Market efficiency and the risk return behavior in a number of emerging stock market economies have been examined by Bekaert and Harvey 91997). Volatility is the tendency of assets prices fluctuating either up or down. Increased volatility is perceived as indicating a rise in the financial risk which can adversely affect investor’s assets and wealth. According to Glosten et. al (1993), negative and often significant relationship between the volatility and return. Stock volatility has been received a great attention from practitioners because it can be used as a measure of risk in financial markets. The Chinese stock market forecast of volatility using the CAPM model was done by Hongyu and Zhichao (2006). Descriptive statistics summarize consump pc92 Variable | Obs Mean Std. Dev. Min Max -------------+-------------------------------------------------------- consump | 211 1618.767 1665.885 134.9 5843 S$P | 207 2565.943 1232.209 912.1 5179.3 From the descriptive statistics, it can be observed that the mean of the y stock is 1618.767, and the standard deviation of 1665.885, the mean of the S and P stock is 2562.943, the standard deviation of 1232.209. The percentile and the of the two stock is provided below. Y stock, S and P stock series. ------------------------------------------------------------- Percentiles Smallest 1% 148.9 134.9 5% 177.4 140.1 10% 207.9 148.9 Obs 211 25% 310.4 153.2 Sum of Wgt. 211 50% 759.9 Mean 1618.767 Largest Std. Dev. 1665.885 75% 2742.3 5593.2 90% 4428.1 5676.5 Variance 2775171 95% 5108.2 5773.7 Skewness 1.044059 99% 5676.5 5843 Kurtosis 2.754459 personal consumption, 92 $, UAB NIPA ------------------------------------------------------------- Percentiles Smallest 1% 931.9 912.1 5% 973.3 928.5 10% 1072.2 931.9 Obs 207 25% 1409.5 932.1 Sum of Wgt. 207 50% 2486.1 Mean 2565.943 Largest Std. Dev. 1232.209 75% 3612.1 4981 90% 4366.6 5055.1 Variance 1518339 95% 4692.1 5130.2 Skewness .3720295 99% 5055.1 5179.3 Kurtosis 1.898156 The box plot of the The box plot of the log return for series one show that the series one is not nornally distributed. The box plot of the lor return for series 2 show that the log return for series two is symetrical. The log return of series of series one show that the data is normally distributed since the normal plot indicate that the point are very close to the line. dfuller consump, lags(0) Dickey-Fuller test for unit root Number of obs = 210 ---------- Interpolated Dickey-Fuller --------- Test 1% Critical 5% Critical 10% Critical Statistic Value Value Value ------------------------------------------------------------------------------ Z(t) 24.450 -3.473 -2.883 -2.573 ------------------------------------------------------------------------------ MacKinnon approximate p-value for Z(t) = 1.0000 The dickey- fuller also indicates that the log return is not volatile. The z(t) has a test statistic of 24.450, with a critical value of -3.473 at 99%, the critical value of the log return of series one at 955 confidence is -2.883, the critical value of the log return at 905 confidence level is equal to -2.573 this means that the log return of series one is not volatile about all the level of confidence. . The normal probability plot of the log return of series two show that its normally distributed. This is because the normal probability plot indicates that the log return of the series is normally distributed. Comparing if there is significant difference in the log return of series one and log retutn of series two Two-sample t test with equal variances ------------------------------------------------------------------------------ Variable | Obs Mean Std. Err. Std. Dev. [95% Conf. Interval] ---------+-------------------------------------------------------------------- consump | 211 1618.767 114.6842 1665.885 1392.687 1844.847 pc92 | 207 2565.943 85.64446 1232.209 2397.091 2734.795 ---------+-------------------------------------------------------------------- combined | 418 2087.823 75.33717 1540.272 1939.735 2235.911 ---------+-------------------------------------------------------------------- diff | -947.1757 143.5368 -1229.324 -665.0278 ------------------------------------------------------------------------------ diff = mean(consump) - mean(pc92) t = -6.5988 Ho: diff = 0 degrees of freedom = 416 Ha: diff < 0 Ha: diff != 0 Ha: diff > 0 Pr(T < t) = 0.0000 Pr(|T| > |t|) = 0.0000 Pr(T > t) = 1.0000 From the two difference in the mean with equal variance assumption, we can observe that the difference between the first series and the second series is 143.5368, with a t statistic value of -6.5988 eoth a two sided p- value of 0.000 which is less than the 0.05 level of confidence. this implies that the value of there is significant difference in the mean of the two series Volatility The volatility Phillips-Perron test for unit root Number of obs = 210 Newey-West lags = 4 ---------- Interpolated Dickey-Fuller --------- Test 1% Critical 5% Critical 10% Critical Statistic Value Value Value ------------------------------------------------------------------------------ Z(rho) 2.888 -20.167 -13.920 -11.147 Z(t) 17.326 -3.473 -2.883 -2.573 ------------------------------------------------------------------------------ MacKinnon approximate p-value for Z(t) = 1.0000 The Phillips perro test for unit root is used to test if the variable log returns of stock are volatile. From the Phillips- perron test for unit root, it can be observed that the series one is volatile since it has a p- value of 1 which is greater than the 0.05 level of confidence. Portmanteau test for white noise --------------------------------------- Portmanteau (Q) statistic = 4366.7050 Prob > chi2(40) = 0.0000 newey consump pc92, lag(0) Regression with Newey-West standard errors Number of obs = 207 maximum lag: 0 F( 1, 205) = 1936.42 Prob > F = 0.0000 ------------------------------------------------------------------------------ | Newey-West consump | Coef. Std. Err. t P>|t| [95% Conf. Interval] -------------+---------------------------------------------------------------- Log stock 1 | 1.299005 .0295196 44.00 0.000 1.240804 1.357206 _log return 2| -1685.913 77.59265 -21.73 0.000 -1838.895 -1532.931 ------------------------------------------------------------------------------ The CAPM indicate that the regression model indicate that the coefficient of log return of stock one is 1.299 with a p- value of 0.000 which is less than 0.05 level of confidence. This implies that there is significant. The regression model indicate that the coefficient of log return of stock two is -1685.913 with a p- value of 0.000 which is less than 0.05 level of confidence. This implies that there is significant. Reference Bekaert. G and Harvey. C. R (1997). Emerging equity market volatility. Journal of financial Economics 43: 29 -77 Glosten L. R, Jagannathan, R, and Runkle D. E (1993). “ on the relation between the epected value and the volatility of the nomimal ecess return on stock” journal of financial 48: 1779- 1801 Hongyu. P and Zhichao, Z (2006). Forecasting financial volatility: evidence from chinese stock market. Working paper in econonics and financial no 0602 university of Durham. Read More
Cite this document
  • APA
  • MLA
  • CHICAGO
(Forecasting the Stock Assignment Example | Topics and Well Written Essays - 1628 words, n.d.)
Forecasting the Stock Assignment Example | Topics and Well Written Essays - 1628 words. Retrieved from https://studentshare.org/finance-accounting/1685805-applied-statistics-for-finance-and-economics-project-report
(Forecasting the Stock Assignment Example | Topics and Well Written Essays - 1628 Words)
Forecasting the Stock Assignment Example | Topics and Well Written Essays - 1628 Words. https://studentshare.org/finance-accounting/1685805-applied-statistics-for-finance-and-economics-project-report.
“Forecasting the Stock Assignment Example | Topics and Well Written Essays - 1628 Words”, n.d. https://studentshare.org/finance-accounting/1685805-applied-statistics-for-finance-and-economics-project-report.
  • Cited: 0 times

CHECK THESE SAMPLES OF Forecasting the Stock

Science Refers to a System of Knowledge

Science of psychology What is science Science refers to a system of knowledge that can be explained rationally and could be applied on events and happenings in a reliable manner.... The knowledge is gathered in the form of assumptions that have prevailed through the historical periods and tested against the real facts of life....
5 Pages (1250 words) Essay

Stock Market Cycles

Many would argue that what drives the stock market is what is going on in the news or at the White House.... Yes, the stock market reacts to announcements with fluctuations in the market that are short lived.... hellip; The announcement that President Bill Clinton was going to be impeached, Scooter Libby's indictment, and in the aftermath of Hurricane Katrina the stock market responded by losing ground.... But, in the above mentioned cases the stock market quickly recovered and made gains....
3 Pages (750 words) Essay

Business and Economic Forecasting

We consider the price index of the Rio Tinto, the 5 day weekly stock price for the period 31st December 1999 to 31st December 2007 is used and the following chart summarizes the price index for the period.... This paper uses Rio Tinto price index to estimate an appropriate model that can be used in forecasting future prices and returns.... The maximum likelihood technique is used to estimate an appropriate model that can be used for forecasting future prices and returns....
14 Pages (3500 words) Essay

The Bullwhip Effect

Bullwhip effect first identified by Forrester and subsequently named as such by the Procter and Gamble is the cumulative effect of distortions in demands due to inaccurate forecasts resulting in piling up of unwanted inventories and at the same time shortage of and out of stock… This effect translates into lost sales and loss of significant margins.... Where as, such a stockpile should be of a comfortable reserve in stock in trade, there is actually out-of-stock situation at all the points....
6 Pages (1500 words) Essay

Policies of Warnsley Ltd

The policy in order forming for the customer can be presented as: A new order is positioned at the specific time, when the stock levels fall to a certain level the order quantity is constant.... The assumption is that every time a new order has to be placed in any condition in the event that the stock level is large then a new ordering should not occur.... Stage one comprises of customers whereby their stock level depreciates to a certain level before a new order is sent to Warnsley Ltd who is the wholesaler in our case....
4 Pages (1000 words) Assignment

Dividend and Non-Dividend Stock Valuation

A capital gain indicates the appreciation of price on stock price while dividends provide a regular investment on income.... Once the variables of the model are known, calculating the share of stock is forthright.... Second, it is Dividend and Non-dividend stock Valuation Introduction According to Peris the discount growth model is a technique that is used to value dividend stocks and covers gains in both capital and dividends.... A capital gain indicates the appreciation of price on stock price while dividends provide a regular investment on income....
2 Pages (500 words) Research Paper

DuPont Analysis and Recommendations for MarineMax

2014) WMAR is the least preferred stock from the investor's viewpoint due to the lowest return on equity of just 0.... DuPont Corporation initially developed the method in the 1920s.... Using this method “assets are measured at their gross book value rather than at net book… HZO's return on equity of 4....
7 Pages (1750 words) Assignment

Cash Flow Forecasting

In the paper “Cash Flow forecasting” the author uses past data to distinguish seasonal and other cyclical fluctuation from long term underlying trends.... An example of the use of this approach is the monthly inflation statistics which show headline figure and the underlying trend....
10 Pages (2500 words) Research Proposal
sponsored ads
We use cookies to create the best experience for you. Keep on browsing if you are OK with that, or find out how to manage cookies.
Contact Us