StudentShare
Contact Us
Sign In / Sign Up for FREE
Search
Go to advanced search...
Free

Cash Flow Forecasting - Research Proposal Example

Cite this document
Summary
In the paper “Cash Flow Forecasting” the author uses past data to distinguish seasonal and other cyclical fluctuation from long term underlying trends. An example of the use of this approach is the monthly inflation statistics which show headline figure and the underlying trend…
Download full paper File format: .doc, available for editing
GRAB THE BEST PAPER92% of users find it useful
Cash Flow Forecasting
Read Text Preview

Extract of sample "Cash Flow Forecasting"

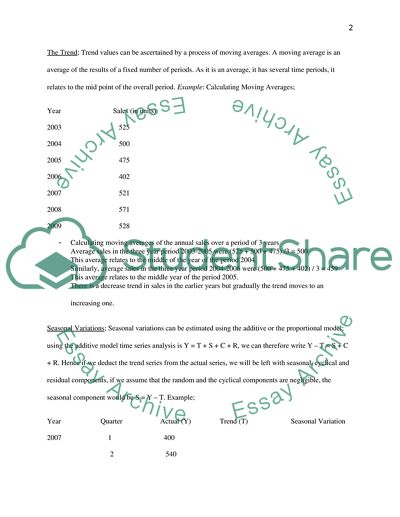
Assignment Forecasting The past is not a good guide to the future. It may be so in simple static conditions, but complex or dynamic environments require sophisticated techniques such as the use of leading indicators and scenarios; decisions that are made in a complex and dynamic environment require forecasting to predict the future. Forecasting attempts to reduce the uncertainty managers face. In simple and static conditions, the past is relatively good guide to the future, though, of course, this is not the case in dynamic or complex conditions. There are many techniques which are used in forecasting. (Paul et al 2006) Time Series Analysis uses past data to distinguish seasonal and other cyclical fluctuation from long term underlying trends. An example of the use of this approach is the monthly inflation statistics which show headline figure and the underlying trend. A time series is a series of figures or values recorded over time. It has four components: a trend, seasonal variations, cyclical variations and random variations. A graph of a time series is referred to as a Historigram (Palepu et al 2008, ACCA-P3 2008 & ACCA practice & revision kit 2009). Trend is the underlying long term movement over time in values of data recorded. Seasonal variations are short term fluctuations in recorded values due to different circumstances which affect result at different times of the year. Cyclical variations are medium term changes in results caused by circumstances which repeat in cycles. Hence, the actual time series is denoted as, Y= T+S+C+R, this is known as the additive model; Where Y= the actual time series; T= the trend analysis; S= the seasonal component; C= the cyclical component; R= the random component The Trend; Trend values can be ascertained by a process of moving averages. A moving average is an average of the results of a fixed number of periods. As it is an average, it has several time periods, it relates to the mid point of the overall period. Example: Calculating Moving Averages; Year Sales (in units) 2003 525 2004 500 2005 475 2006 402 2007 521 2008 571 2009 528 Calculating moving averages of the annual sales over a period of 3 years Average sales in the three year period 2003-2005 were (525 + 500 + 475) /3 = 500 This average relates to the middle of the year of the period 2004. Similarly, average sales in the three year period 2004-2006 were (500 + 475 + 402) / 3 = 459 This average relates to the middle year of the period 2005. There is a decrease trend in sales in the earlier years but gradually the trend moves to an increasing one. Seasonal Variations; Seasonal variations can be estimated using the additive or the proportional model; using the additive model time series analysis is Y = T + S + C + R, we can therefore write Y – T = S + C + R. Hence if we deduct the trend series from the actual series, we will be left with seasonal, cyclical and residual components, if we assume that the random and the cyclical components are negligible, the seasonal component would be S = Y – T. Example; Year Quarter Actual (Y) Trend (T) Seasonal Variation 2007 1 400 2 540 3 380 480 -100 4 600 488 112 2008 1 570 492 78 2 650 495 155 3 420 4 550 Supposing that the seasonal variations for the third and fourth quarter of 2008 and the first and second quarter of 2009 are -140, 67, -11 and 108 respectively. The variation between the actual result for a particular period and the trend line average is not the same from year to year, but an average of these variations can be taken (ACCA-P3 2008 & ACCA practice & revision kit 2009). Quarter 1 Quarter 2 Quarter 3 Quarter 4 2007 -100 112 2008 78 155 -140 67 2009 -11 108 Total 67 263 -240 179 Average (/2) 33.5 131.5 -120 89.5 Q1 Q2 Q3 Q4 Total Estimated quarterly variations 33.5 131.5 -120 89.5 134.5 Adjustments to reduce variations to zero -33.625 -33.625 -33.625 -33.625 -134.5 Final estimates of quarterly estimations -0.125 97.875 -153.625 55.875 0 Regression Analysis is a quantitative technique to check any underlying correlations between two variables (e.g. sale of ice cream and the weather). The relationship between the two variables may only hold between certain values. Like in the example above if the temperature becomes hotter, the sale of ice creams would increase but there are probably a maximum number of ice creams that an individual can consume, no matter how hot it is. (Paul et al 2006 ACCA-P3 2008 & ACCA practice & revision kit 2009). Linear regression analysis involves determining a line of best fit and it can be denoted in the formula y= a+bx where Y, total cost/ dependant variable X, level of activity/ the independent variable A, the intercept of the line on the y – axis/ the fixed cost B, the gradient of the line/ the variable cost per unit of activity If y = a+ bx, b = n∑xy - ∑x∑y and a = ∑y - b∑x n∑x² - (∑x)² n n Where n is the number of pair of data for x and y. This provides a number of readings for different activity levels and their associated costs. Example of a factory output and its costs of production All figures below are in thousands Month Output Costs ‘000 ‘000 ($) (x) (y) January 15 60 February 20 80 March 25 100 April 10 40 May 22 85 Calculating an equation to determine the expected cost for any given output volume Equation y = a + bx Calculations; x y xy x² y² 15 60 900 225 3600 20 80 1600 400 6400 25 100 2500 625 10000 10 40 400 100 1600 22 85 1870 484 7225 ∑x = 92 ∑y = 365 ∑xy = 7270 ∑x² =1834 ∑y² = 28825 n= 5 (there are 5 pairs of data for x and y values) Using the formula above; b = {(5 x 7270 – (92 x 365)}/ {(5 x 1834 – (92)²} b = {(36350 – 33580)/ (9170 – 8464) b = 2770/706 b = 3.92 a = (365/ 5) – (3.92 x (92/5) a = 0.87 y = 0.87 + 3.92x Where y = total cost, in thousands of pounds and x is the output of units in thousands. If now for example the output is 18,000 units, we would expect the costs to be 0.87 + 3.92 x 18 = $71, 430. (Palepu et al 2008, ACCA-P3 2008 & ACCA practice & revision kit 2009). Scatter Diagrams; can be used to estimate the fixed and variable component of costs. The fixed cost is the intercept of the line of best fit on the vertical axis. For example if the fixed cost are $1000, the output is of 500 units, the total costs for the 500 units being $2000, variable cost of 500 units would be calculated as $(2000 – 1000) = $1000/ 500 units = 2/ unit. The equation of the line of best fit is therefore approximately (y = 1000 + 2x). The disadvantage of the scatter diagram technique is that the cost line is drawn by mere judgment and approximation, which cannot correct for sure. Another mode of making decisions is by using the theory of correlation which describes the degree to which change is one variable is related to change in another (example; change in weather can vary the demand for different type of clothing). Two variables can be perfectly correlated, partially correlated, or uncorrelated (Williamson 2004, Fight 2006, Shim, 2000 & ACCA-P3 2008) Cash Flow Forecasts; is considered as a short term planning technique. There will always be unpredicted changes which can affect the pattern and amount of cash flow. If a cash flow forecast predicts a shortage in cash, necessary steps can be taken to overcome it. Cash Flow forecasts do not give full protection against cash shortages problems because of the dynamic nature of the environment and unforeseen changes (Journal of Business Forecasting, 2005 & Accurate Business Forecasting 1991). Indices and Index; An index is a measure of the average changes in the value of a group of items. It comprises a series of index numbers may be a price index or a quantity index. Price index measure changes in value of money while quantity index measure non monetary changes in values. The other limitation is the selection of suitable base period, hence the result are approximate and are bound to give misleading results in fast and changing business environment ((Journal of Business Forecasting, 2005 & Accurate Business Forecasting 1991). Forecasting Problems; There are certain problems with forecasting. Errors can be expected due to unpredictable changes. This is more likely to happen where a more futuristic data is analysed, the smaller the time period the better will be the forecasting, hence longer term forecasting is more unreliable. The other problem is that of the data availability, the less the data available, the less unreliable the forecast. Random variation may upset pattern of trend and seasonal variations (Hanke & Wichern, 2009). Recommendations; All the above techniques above are considered good forecasting tools and techniques, each company chooses the technique which best suits its company profile and the business environment in which it operates. While using forecasting techniques to predict future changes in price or other variable certain general checks should be made; - The time period should be long enough to include any periodically paid costs but short enough to ensure that averaging of variations in the activity levels has not occurred. - The data used in forecasting should be thoroughly examined to ensure that non activity level factors affecting costs were approximately the same in the past as those forecast for the future. - The method of data collection and the accounting policies should not coincide with each other, hence creating bias (ACCA-P3 2008). Assignment 2 A company, to prosper, requires to indulge in profitable projects so as to increase the inward flow of funds which are needed for a company to survive. To enter into these projects, funds are required by companies. Organizations have different modes to obtain these funds. The two major sources to obtain finance are Equity Finance and Debt Finance ((Palepu et al 2008, ACCA-P3 2008 & ACCA practice & revision kit 2009). Equity Finance; This mode of finance is raised by companies via the issue of new shares or right issue. Cash generated by the use of retained earnings is another source of equity finance. Retained cash earnings are the most important and the cheapest form of equity finance. Retained earnings can be used to finance existing operations, however it may not be enough if a company is trying to grow. A company may also have problem retaining earnings if shareholders require urgent dividend payments. The other two ways of obtaining cash from equity finance is Right Issues and New Share Issue (Palepu et al 2008, ACCA-P3 2008 & ACCA practice & revision kit 2009). Rights Issue; A rights issue is an offer to existing shareholders to buy shares of the company, usually at a price lower than the market value of the shares. It gives the existing shareholders to subscribe for shares with respect to their existing proportion of shareholding. Right issue is some times considered as an internal proposal for generating funds. The major advantages with such an issue are; - Right issues are cheaper because they do not require heavy advertisement, no prospectus and hence the costs of issuing the shares would be cheaper. - Relative voting rights are unaffected if shareholders take up their respective rights. - The finance raised by such mode would reduce gearing in book value terms as share capital would increase and that finance raise can also be used to pay off any debts which would also eventually reduce gearing making the company look less risky hence reducing the chances of liquidity (Paul et al 2006). New Share Issue; A company can issue new shares to the general public at open if it is a listed company. This way the company has access to a wider pool of finance. Shares can be issued on the Stock exchange by means of an offer for sale, a placing or an introduction. Ordinary shares issued to general public makes them owners of the company and entitles them to vote in many different meetings of the company. There are certain advantages of new share issue such as improved marketability of shares on the stock exchange, enhancement of company’s image as its shares are being traded on the stock exchange. Stock exchange listing can also help majorly in achieving Debt finance, as the lender would have improved confidence in the company (Palepu et al 2008, ACCA-P3 2008 & ACCA practice & revision kit 2009). Debt Finance; If the current shareholders of a company are unwilling to contribute additional capital and the company cannot avail the option of new share issue, the other option left over for the company is that of debt finance. The other reasons for choosing debt finance may include lesser cost and easier availability as compared with equity finance, particularly if the company has very less or no existing debt finance. A company willing to raise debt finance will need to consider the type of the debt finance that might be available. If the company is seeking medium-term bank finance, it ought to be in the form of a loan or an overdraft. Bank finance is a most important source of debt for small companies. There are many types of debt financing e.g. Loan Stocks, redeemable Debentures, Redeemable Preference Shares (Palepu et al 2008, ACCA-P3 2008 & ACCA practice & revision kit 2009). Gearing; must be considered when deciding how to finance a business. Operational and Financial gearing need to be distinguished; financial gearing measures relationship between shareholder’s fund and prior charge capital while operational gearing measures the relationship between contribution and profit before interest and tax. Financial Gearing = Prior Charge Capital Equity capital (including reserves) Operational Gearing = Contribution Profit before interest and tax If a company can generate returns on capital in excess f the interest payable on debt, financial gearing will raise the earnings per share. Gearing will however also increase the variability of returns for shareholders and increase the chance of corporate failure. The more a company is geared, the more the chances that it might lead the company towards bankruptcy as there is a fixed liability always of paying the debt payments (e.g. interest payments, which might be paid when they fall due. Gearing is also limited by the reluctance of lenders to lend to a company which does not have an adequate equity base, e.g. the more a company is geared the more difficult it would be for the company to obtain additional debt finance. There are many factors that influence the decision of the mode of finance to be chosen i.e. either equity finance or debt finance. Debt finance tends to be relatively low risk for the debt holder as it is interest bearing and can be secured, the cost of the debt is relatively low. The greater the level of risk the more the financial risk to the shareholders of the company, so the higher return is required (Palepu et al 2008, ACCA-P3 2008 & ACCA practice & revision kit 2009). Bibliography Paul, Debra, and Donald Yeates. Business Analysis. Swindon: British Computer Society, 2006. Palepu, Krishna G., and Paul M. Healy. Business Analysis & Valuation: Using Financial Statements. Mason, OH: Thomson/South-Western, 2008. Acca - P3 Business Analysis. Gardners Books. BPP LEARNING MEDIA. (2008). Williamson, David. Strategic Management and Business Analysis. Amsterdam: Elsevier, Butterworth-Heineman, 2004. Fight, Andrew. Cash Flow Forecasting. Essential capital markets. Burlington, MA: Elsevier Butterworth-Heinemann, 2006. Shim, Jae K. Strategic Business Forecasting: The Complete Guide to Forecasting Real World Company Performance. Boca Raton, Fla: St. Lucie Press, 2000. Hanke, John E., and Dean W. Wichern. Business Forecasting. Upper Saddle River, NJ: Pearson/Prentice Hall, 2009. The Journal of Business Forecasting. [Flushing, N.Y.]: Graceway Pub. Co, 2005. . Accurate Business Forecasting. Harvard business review paperback, no. 90069. Boston, Mass: Harvard Business Review, 1991. Association of Chartered Certified Accountants (Great Britain). Business Analysis. ACCA practice & revision kit, paper P3. London: BPP Learning Media Ltd, 2009. Read More
Cite this document
  • APA
  • MLA
  • CHICAGO
(Cash Flow Forecasting Research Proposal Example | Topics and Well Written Essays - 2500 words, n.d.)
Cash Flow Forecasting Research Proposal Example | Topics and Well Written Essays - 2500 words. Retrieved from https://studentshare.org/finance-accounting/1727198-finance-forecasting-techniques
(Cash Flow Forecasting Research Proposal Example | Topics and Well Written Essays - 2500 Words)
Cash Flow Forecasting Research Proposal Example | Topics and Well Written Essays - 2500 Words. https://studentshare.org/finance-accounting/1727198-finance-forecasting-techniques.
“Cash Flow Forecasting Research Proposal Example | Topics and Well Written Essays - 2500 Words”, n.d. https://studentshare.org/finance-accounting/1727198-finance-forecasting-techniques.
  • Cited: 0 times

CHECK THESE SAMPLES OF Cash Flow Forecasting

The Lawrence Sports Simulation

The Recommendation on Policy Itself and An Evaluation of Risk Associated With the Recommendation The recommendation made to Lawrence Sports is to do some cash flow analysis—and to emphasize simply having greater cash flow coming in than going out.... This is why cash flow is so important.... According to Fight (2005), “Analysis of cash flow, then, cannot merely isolate debt capacity but must also consider all the factors producing major changes in cash inflows and outflows” (pp....
6 Pages (1500 words) Research Paper

Cost Reduction and Management of an Organization

dvising on Cash Flow Forecasting.... t takes into consideration the conversion of cash based accounting system into accrual systems, defining the cost centers as well as cost allocation.... It is very important for an organization to strive to work on the best efficiency possible....
4 Pages (1000 words) Essay

Fundamentals of Financial Management

The determination of a correct discount rate is very important in the calculation of NPV as it is the rate which is used to discount back the value of future cash inflows to their present values.... The concept of net present values can be used in this situation to advise Harriet on the most appropriate action to take....
7 Pages (1750 words) Essay

Published Financial Statements

This information includes the cash flow and profitability position of the company.... Lenders need information about the company's stability and cash flow.... To avail information concerning the likelihood of the firm to have enough cash to pay its debts in the immediate future....
8 Pages (2000 words) Essay

Cash Flows in Business Organisations

Included in the report are the reasons for unequal net income and net cash flow during a financial period; the difference between direct and… ndirect method of cash flow preparation; a two-year comparative analysis of the Viacom and Omnicom group cash flow statement; and the identification of the strategies implemented by the two companies based on the result of their cash flow analysis. The net profit of a company On the other hand, net cash flow can be defined as the difference between the cash that is brought in and that goes out of a company....
4 Pages (1000 words) Coursework

Cash Flow Analysis and the Fund's Statement

?Cash Flow Forecasting and liquidity.... The cash flow statement also report the cash used in various investing activities like purchasing fixed assets.... The cash flow statement also report the cash used in various investing activities like purchasing fixed assets.... Failing to provide the cash flow statement, the company will lack the proper information on telling the sources of cash and its use.... Additionally, the company will not have adequate planning tool for its business success in the long term (“cash flow statements”, 2000)....
2 Pages (500 words) Essay

Marketing Planning Process

The group's primary objective was to construct a business plan that would help us to better understand the company's business, marketing and financial strategies.... For example, the STP process research helped us to understand why the MixtapeMadness chose the particular target… The group decided to distribute the work among members in order for each one to carry out individual research and gather as much information as possible....
5 Pages (1250 words) Essay

Financial Decision Making and Risk

The most beneficial feature of this method is that it takes into account the liquidity of the project, which is useful for businesses to understand and concentrate on the cash flows of the company.... et Present Value (NPV) is the most commonly used method and it utilizes the discounted cash flows to compute the returns from an investment.... In this method, initially, all the future cash flows that will be generated by the project are discounted to present value....
8 Pages (2000 words) Coursework
sponsored ads
We use cookies to create the best experience for you. Keep on browsing if you are OK with that, or find out how to manage cookies.
Contact Us