StudentShare
Contact Us
Sign In / Sign Up for FREE
Search
Go to advanced search...
Free

Multivariate Data Analysis (Short computational exercise) - Essay Example

Cite this document
Summary
From the results of the correlation analysis, there is a negative correlation analysis between the occupational status and the number of visits to the Gymnasium in the last 4 weeks. The coefficient of linear correlation is -0.077. This is a weak negative correlation based on the…
Download full paper File format: .doc, available for editing
GRAB THE BEST PAPER94% of users find it useful
Multivariate Data Analysis (Short computational exercise)
Read Text Preview

Extract of sample "Multivariate Data Analysis (Short computational exercise)"

Essay, Other Multivariate Data Analysis (Short computational exercise) Question Answer From the results of the correlation analysis, there is a negative correlation analysis between the occupational status and the number of visits to the Gymnasium in the last 4 weeks. The coefficient of linear correlation is -0.077. This is a weak negative correlation based on the hypothesis that there is an association between the two variables.Fig 1: Results of Linear Correlation AnalysisQuestion 2: AnswerThe hypothesis is that there is an association between the age and the level of satisfaction.

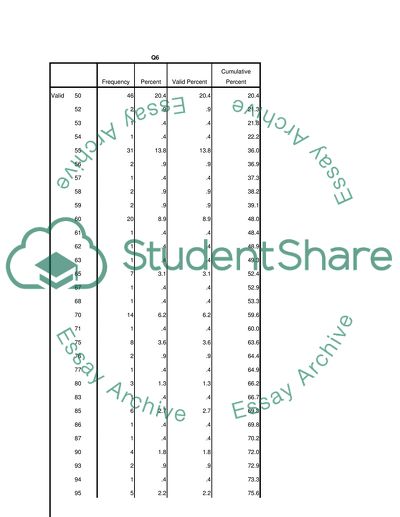
From the linear correlation analysis, we run linear correlation between Q2 and Q7. The finding is that there is a strong negative correlation between the two variables, the age of the level of satisfaction. The coefficient of linear correlation was found to be -0.154.CorrelationsQ2Q7Q2Pearson Correlation1-.154*Sig. (2-tailed).021N225225Q7Pearson Correlation-.154*1Sig. (2-tailed).021N225225*. Correlation is significant at the 0.05 level (2-tailed).Fig 2: Linear Correlation ResultsQuestion 3: AnswerQ6FrequencyPercentValid PercentCumulative PercentValid504620.420.420.4522.9.921.3531.4.421.8541.4.422.2553113.813.836.0562.9.936.9571.4.437.3582.9.938.2592.9.939.160208.98.948.0611.4.448.4621.4.448.9631.4.449.36573.13.152.4671.4.452.9681.4.453.370146.26.259.6711.4.460.07583.63.663.6762.9.964.4771.4.464.98031.31.366.2831.4.466.78562.72.769.3861.4.469.8871.4.470.29041.81.872.0932.9.972.9941.4.473.39552.22.275.6991.4.476.01003113.813.889.8105135.85.895.611052.22.297.811531.31.399.11601.4.499.63201.4.4100.

0Total225100.0100.0Fig 3: Descriptive Statistics of the willingness to payFrom the frequency descriptions, the number that is willing to give at least £75 is 39.7%. The hypothesis therefore, scores 39.7% positive response. The remaining percentage (60.3%) is the score for the willingness to pay less than £75.Question 4: AnswerThe hypothesis is that there is no association between gender aspect and the willingness to pay. We run a linear correlation analysis on the two variables Q1 and Q6. The findings are as follows:CorrelationsQ1Q6Q1Pearson Correlation1.394**Sig. (2-tailed).

000N225225Q6Pearson Correlation.394**1Sig. (2-tailed).000N225225**. Correlation is significant at the 0.01 level (2-tailed).Fig 4: Gender influence on the willingness to payThere is a positive linear correlation coefficient of 0.394. This indicates that the gender group positively influences the willingness to pay is positively influenced by the gender. It therefore leads to a conclusion that females are willing to pay more than the males. This is against the hypothesis.Question 5: AnswerThe hypothesis is that the net weekly income positively influences the willingness to pay.

We run a linear correlation analysis using two variables CorrelationsQ4Q6Q4Pearson Correlation1.492**Sig. (2-tailed).000N225225Q6Pearson Correlation.492**1Sig. (2-tailed).000N225225**. Correlation is significant at the 0.01 level (2-tailed).Fig 5: Influence of Net Income on the Willingness to payThe coefficient of linear correlation between the two variables is 0.492. This is a strong positive linear correlation, indicating that the willingness to pay increases as the net income per week increases, as per the hypothesis.

Fig 6: Willingness to pay against Net IncomeThe gradient of the plotted line is 0.242. A person earning £300 will be willing to pay 300 * 0.242 = £72.Question 6: AnswerFig 7: Multivariate Linear Regression(i) The significance of gender (Q1) in the multiple regressions is 0. It shows that the regression model did not consider the gender factor.Fig 7: Gender and the Willingness to payFig 8: Occupational Status and willingness to payThe significance of the occupational Status (Q3) is 0.492. It was the most influential variable in the linear regression model.

Fig 9: Net weekly Income and the willingness to payThe net weekly income was of significance. The linear regression model did not make use of it.(ii) SimilarityThe multiple regressions and the two variable linear regression model give zero significance for the gender and net weekly income. DifferenceThe multiple regressions shows the three plots for net weekly income, occupational status and the gender factor in a single regression model. The two variable linear regression on the other hand shows a single plot between the dependent and independent variable.(iii). Net Weekly IncomeA person with weekly income of £500 is willingness £110.(iii). Net incomeiv.

A female earning weekly income of £400 is willingness £95.

Read More
Cite this document
  • APA
  • MLA
  • CHICAGO
(“Multivariate Data Analysis (Short computational exercise) Essay”, n.d.)
Multivariate Data Analysis (Short computational exercise) Essay. Retrieved from https://studentshare.org/miscellaneous/1635823-multivariate-data-analysis-short-computational-exercise
(Multivariate Data Analysis (Short Computational Exercise) Essay)
Multivariate Data Analysis (Short Computational Exercise) Essay. https://studentshare.org/miscellaneous/1635823-multivariate-data-analysis-short-computational-exercise.
“Multivariate Data Analysis (Short Computational Exercise) Essay”, n.d. https://studentshare.org/miscellaneous/1635823-multivariate-data-analysis-short-computational-exercise.
  • Cited: 0 times

CHECK THESE SAMPLES OF Multivariate Data Analysis (Short computational exercise)

Financial Analysis Exercises and Questions

he author does exercise on expanded accounting equation, balance sheet preparation, income statement preparation, cash flow computations, retained earnings computations, cash flow classifications.... Running head: FINANCIAL ANALYSIS EXERCISES AND QUESTIONS Financial Analysis Questions and Exercises of University/Institution] Practice 2-14 Expanded Accounting Equation Assets Liabilities Capital Stock Retained Earnings Case A $20,000 $ 8,000 $ 8,500 $ 3,500 Case B $16,000 $ 9,000 $ 5,000 2,000 Case C $57,000 11,000 14,000 32,000 Case D 46,000 30,000 20,000 ($4000) exercise 2-6 Balance Sheet Preparation Simon Company Balance Sheet as on December 31, 2006 Assets Liabilities and Owners' Equity Cash $ 179,750 Liabilities Accounts receivable 123,000 Accounts payable $62,500 Supplies 3,750 Mortgage payable 479,500 Land 130,000 Building 418,500 Owners' equity* 313,000 Total assets $855,000 Total liabilities and owners' equity $855,000 *Owners' equity (01/01/06) $210,000 Less: Distributions to owners during 2006 $(21,750) Add: Net Income $124,750 Owners' equity (12/31/06) $313,000 exercise 2-8 Income Statement Preparation Beckstrom Corporation Income Statement For the Year Ended December 31, 2006 Revenues $ 384,000 Less: Expenses Advertising expense 15,000 Supplies expense 46,000 Rent expense 10,000 Utilities expense 3,000 Salaries expense 61,000 Miscellaneous expenses 4,400 Income before tax 244,600 Less: Tax (30%) 73,380 Net income $171,220 exercise 2-9 Cash Flow Computations 1....
2 Pages (500 words) Essay

Pricing derivatives using Monte Carlo Techniques

In practice generic Monte Carlo pricing engines face computational problems in the presence of discontinuous payoffs options, because of above stated time consumption limitation but also due to poor convergence with its finite difference estimates and brute force perturbation.... The simulation's capabilities to handle several variables in one construct makes it an ideal technique to address issues involved in analysis of market risk and credit risk and thereby it assumes an important place in overall risk management architecture....
4 Pages (1000 words) Essay

Data Analysis for National Treasure Online Shop

The class diagram has three important classes that are Product, Customer, and Purchase Order along with three other classes as Product category, Line product, and Payment detail.... The various attributes of the… Every product has only one product category, therefore the association between the Product class and Product category class is one to one, i....
4 Pages (1000 words) Essay

Assessed assignment 2 - Data Analysis Exercise

“The language teacher's view of what constitutes knowledge of a language is ------ a knowledge of a syntactic structure of sentences ----- The assumption that the language teacher appears to make is that once this basis is provided, then the learner will have no difficulty… An analysis of the transcript of the following role-playing conversation will help to identify where the speakers with L1 Chinese diversify from the grammatical and lexical patterns used by native speakers. Spare times – the word “time” The plural form of ‘time' is used in English but in specific contexts and with different connotations....
3 Pages (750 words) Essay

Business Forecasting and Data Analysis

The author of the paper promotes business forecasting and data analysis, such as regression analysis, prediction of sales using a regression equation, prediction of the change of sales given a change in overall mean management score, modification of sales regression model by distinguishing among management scores and etc.... nbsp;… The author states that in conducting the regression analysis, the intention is to predict the value of a dependent variable if the values of predictor variables are known....
8 Pages (2000 words) Essay

Multivariate and Methodology Critique

df The article… There was also the use of regression analysis as well as multicollinearity.... There was also the use of regression analysis as well as multicollinearity.... Units of analysis.... escribe the units of analysis for this study.... The unit of analysis was, therefore, statistical numbers derived from the questionnaire.... ependent Variable NameDependent Variable Level of MeasurementIndependent Variable Name (Including moderating and mediating variables) Independent Variable Level of Measurement Corporate social responsibilityNumbers (Measures of central tendency Likert scale)Firms ageYears Collinearity statisticsTolerance and VIF based on Likert scale)Firms sizeNumber of employees, and floor sizeExternal Orientation in planningNumbers (Measures of central tendency Likert scale) Internal orientation in planning Numbers (Measures of central tendency Likert scale) Resources provided in planningNumbers (Measures of central tendency Likert scale) Functional coverage in planningNumbers (Measures of central tendency Likert scale) Analytical techniques in planning Numbers (Measures of central tendency Likert scale) analysis: Quantitative8....
2 Pages (500 words) Essay

Multivariate Data Analysis( Short computational exercise)

From table 1 below, p-value=0.... 000.... 5(significance level) we thus fail to reject the null hypothesis and conclude that the mean willingness-to-pay for membership of the upgraded Gymnasium is at least £75 From table 5, we see that female respondents are willing to pay a maximum of $80.... 5 while the male respondents are willing to pay $68....
4 Pages (1000 words) Assignment

Computational Fluid Dynamic

computational fluid Dynamics (CFD) can be described as the art of replacing existing PDE systems with a set of algebraic equations which can be solved using digital computers.... computational fluid Dynamics (CFD) usually provides a qualitative prediction of the fluid flow by the… CFD enables engineers and scientists to perform numerical environments in virtual flow laboratories.... computational fluid Dynamics (CFD) has a wide range of uses in the engineering It can be used by architects to produce 3D models of their buildings, by engineers to model the production of their outputs and also by designers to improve the aerodynamics of the cars....
11 Pages (2750 words) Assignment
sponsored ads
We use cookies to create the best experience for you. Keep on browsing if you are OK with that, or find out how to manage cookies.
Contact Us