StudentShare
Contact Us
Sign In / Sign Up for FREE
Search
Go to advanced search...
Free

Lab Report 2: On the Significance of Correlation - Essay Example

Cite this document
Summary
The most widely used method of calculating the strength of the correlation between two sets of variables is Pearson’s product-moment correlation coefficient which is designated as r and…
Download full paper File format: .doc, available for editing
GRAB THE BEST PAPER96.9% of users find it useful
Lab Report 2: On the Significance of Correlation
Read Text Preview

Extract of sample "Lab Report 2: On the Significance of Correlation"

The Significance of Correlation Correlation is a measure of the strength of the association between two sets of variables. The most widely used method of calculating the strength of the correlation between two sets of variables is Pearson’s product-moment correlation coefficient which is designated as r and often times referred to as Pearson’s r. The coefficient of correlation ranges from -1 to +1. A correlation coefficient of -1 at one extreme indicates a perfectly negative correlation between the independent and the dependent variable while a correlation coefficient of +1 indicates a perfectly positive correlation between the two sets of variables.

If r = - 0.5, or r = + 0.05 then there is a moderately negative or a moderately positive association between both sets of variables. The closer r is to +1 and -1 the stronger the level of association while the closer r is to 0 the weaker the level of association. A value of r = 0 indicates that there is no association between the independent and the dependent variables. In order to determine the statistical significance of a correlation result the p-value which represents the probability is compared with the significance level.

If the p-value is less than the significance level then the null hypothesis: r = 0 is rejected and the alternative hypothesis: r ≠ 0 is accepted. On the other hand if the p-value is greater than the significance level then the null hypothesis: r = 0 is accepted and the alternative hypothesis: r ≠ 0 is rejected.The SPSS Manual which is written by Julie Pallant provides several examples of how the SPSS software can be used to perform correlation analysis. The data set that I have chosen to perform my analysis on is Sleep4ED.

This dataset represents a survey of 271 subjects with ages from 18 to 84 years of age and consisting of both male and female. The survey questions related to sleep behavior patterns, gender, weight, and height. The correlations of the variables in the dataset were found to be significantly correlated in some cases with varying levels of correlation. The variables – gender and fall asleep while driving found to be statistically significant but were spurious correlations since they have no meaning.

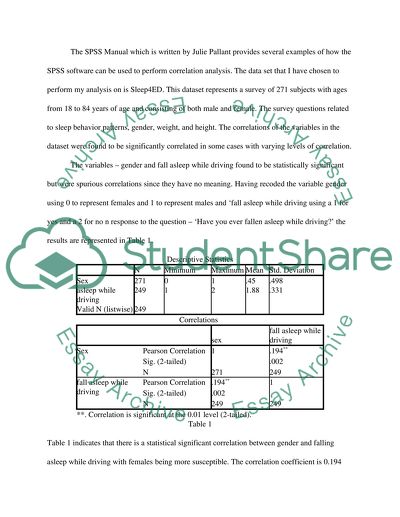
Having recoded the variable gender using 0 to represent females and 1 to represent males and ‘fall asleep while driving using a 1 for yes and a 2 for no n response to the question – ‘Have you ever fallen asleep while driving?’ the results are represented in Table 1.Descriptive StatisticsN MinimumMaximumMeanStd. DeviationSex27101.45.498asleep while driving249121.88.331Valid N (listwise)249Correlationssexfall asleep while drivingSexPearson Correlation1.194**Sig. (2-tailed).002N271249fall asleep while drivingPearson Correlation.194**1Sig. (2-tailed).

002N249249**. Correlation is significant at the 0.01 level (2-tailed).Table 1Table 1 indicates that there is a statistical significant correlation between gender and falling asleep while driving with females being more susceptible. The correlation coefficient is 0.194 and the p-value is 0.002 which is the less than the significance level of 0.01. The fact s that the cause for falling asleep is not related to being simply male or female since males can also fall asleep as a result of being tired.

A meaningful explanation in this case would be that the females who answered the questions were likely to be suffering from anemia or tend to be tired while driving. Weight and physical fitness happened to be two of the variables from the Sleep4ED dataset for which the correlation were not only statistically significant but were also meaningful. The question – ‘Overall, how would you rate your physical fitness?’ was used to assess physical fitness with scores from 1 to 10 – 1 and 10 representing poor and very good respectively.

Table 2 provides information on the results.Descriptive StatisticsNMinimumMaximumMeanStd. DeviationWeight2494316073.3815.284physical fitness2661106.421.717Valid N (listwise)245Correlationsphysical fitnessWeightphysical fitnessPearson Correlation1-.157*Sig. (2-tailed).014N266245WeightPearson Correlation-.157*1Sig. (2-tailed).014N245249*. Correlation is significant at the 0.05 level (2-tailed).Table 2Table 2 indicates that there is a statistically significant negative correlation between poor physical fitness and weight with p = 0.

014 at the 5% significance level. Therefore, as weight increases physical fitness deteriorates and so people who are weightier tend to become tired easily. However, some other explanations may include genetics and diseases. The results suggest that some correlations are meaningful while others are not. However, adding another variable may result in meaningful interpretations. This is the nature of statistics.

Read More
Cite this document
  • APA
  • MLA
  • CHICAGO
(“Lab Report 2: On the Significance of Correlation Essay”, n.d.)
Lab Report 2: On the Significance of Correlation Essay. Retrieved from https://studentshare.org/miscellaneous/1596463-lab-report-2-on-the-significance-of-correlation
(Lab Report 2: On the Significance of Correlation Essay)
Lab Report 2: On the Significance of Correlation Essay. https://studentshare.org/miscellaneous/1596463-lab-report-2-on-the-significance-of-correlation.
“Lab Report 2: On the Significance of Correlation Essay”, n.d. https://studentshare.org/miscellaneous/1596463-lab-report-2-on-the-significance-of-correlation.
  • Cited: 0 times

CHECK THESE SAMPLES OF Lab Report 2: On the Significance of Correlation

Household Env Impact Lab

lab Report: An Experiment on Household Water Consumption (Name) (Subject) (Professor) (Date) Abstract This experiment aims to determine if household “water consumption can be easily and systematically reduced at significant levels by limiting the consumption of water in every instance of toilet flush” (Coyne and Knutzen 253).... lab Report: An Experiment on Household Water Consumption Introduction According to the American Water Works Association, Americans are the biggest water consumers worldwide....
5 Pages (1250 words) Lab Report

Proteins as Essential Nutrients

00394) relative to the level of significance, 0.... Proteins are essential nutrients and are therefore significant to the body, a factor that identifies the need to understand their presence in substances for nutritional, and other, purposes.... An understanding of protein levels in the body is also important in determining changes from equilibrium fluid compositions....
6 Pages (1500 words) Lab Report

Heat Transfer from Steam to Water

The following lab report under the title "Heat Transfer from Steam to Water" focuses on the aspect of heat transfer.... According to the text, the heat equipment is designed to test the ultimate coefficient of heat transfer for the two techniques identified.... nbsp;… The data collected during the experiment is expected to reflect the variation in the flow rates of heat from the two sources, as well as the comparison of the trends....
12 Pages (3000 words) Lab Report

Positive Correlation Between Facebook Usage and Self-Esteem

This study, therefore, undertakes an experimental approach in determining the correlation between Facebook usage and self-esteem.... The grade one gets on an exam, the way one is treated by friends, the ups and downs in the daily lives can have an impact on how one feels about himself or herself....
10 Pages (2500 words) Lab Report

Speciation Is the Natural Change in a Species Behavior

In effect, the species is compelled… The following lab report methodically accounts for the series of events following the sudden split of a species of lizards into two groups by a hurricane resulting in the isolation of a small group of individuals on an Science lab 2 Science lab 2 Introduction Speciation is the natural change in a species' behavior and prevalence over a given periodfollowing a natural disturbance.... The following lab report methodically accounts for the series of events following the sudden split of a species of lizards into two groups by a hurricane resulting in the isolation of a small group of individuals on an island far from the mainland....
1 Pages (250 words) Lab Report

The Level of the Key Biomarkers

This lab report "The Level of the Key Biomarkers" uses spectrometry enzyme assay and Sandwich ELISA to accurately measure the level of the key biomarkers (i.... .... glucose, insulin and C-peptide) for five samples from unknown patients (A-E).... There was a proportional bias present....
13 Pages (3250 words) Lab Report

Stigma as a Significant Social Problem

This study sought to ascertain the significance of belief in a just world and empathy on stigma.... hellip; The pervasive scope of stigma, its ability to disorganize different aspects of life, and effects on health that emerge from stress are some of the major factors that establish the significance of stigma as a social problem.... correlation between stigma and empathy was significant (p=0.... he results are consistent with existing literature that shows a negative correlation between empathy and stigma and uncertainty in the relationship between stigma and just world belief....
5 Pages (1250 words) Lab Report

Priming Study Attitudes to Smoking

"Priming Study Attitudes to Smoking" paper argues that negative priming and attitude to smoking had the highest mean scores in males and females at 59.... 222 and 64.... 727 scores respectively.... The mean value for men with positive prime about smoking was higher than that of women at 59.... 000 and 51....
7 Pages (1750 words) Lab Report
sponsored ads
We use cookies to create the best experience for you. Keep on browsing if you are OK with that, or find out how to manage cookies.
Contact Us