StudentShare
Contact Us
Sign In / Sign Up for FREE
Search
Go to advanced search...
Free

Use Of A Range Of Lean Tools - Report Example

Cite this document
Summary
This report "Use Of A Range Of Lean Tools" details the use of five such tools for the five problems listed below. …
Download full paper File format: .doc, available for editing
GRAB THE BEST PAPER95.6% of users find it useful
Use Of A Range Of Lean Tools
Read Text Preview

Extract of sample "Use Of A Range Of Lean Tools"

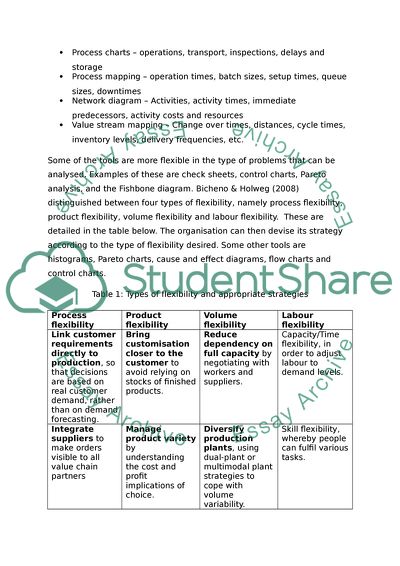
The use and analysis of a range of lean tools Introduction, objectives and selected problems Lean thinking involves systematically identifying and eliminating waste through a continual process of improvements. It originated in the manufacturing industry but the principles can be applied to any organisation. A range of lean tools is available to use for analysing and solving various problems related to engineering business. This report details the use of five such tools for the five problems listed below. The objectives are to: (a) Analytically explain the basic tasks and barriers that exist when implementing and sustaining solutions for these problems; (b) Identification of the most appropriate tool for solving the problem; (c) Identification of the primary functions of the persons using the tools; (d) Illustration of how the tools help in energy auditing. The following problems were selected for this report to which the objectives were applied: 1, Mistakes with order 4, Long setup times 5. Frequent machine breakdowns 9. Delays in repairing equipment 10. Long transportation distances/times Range of lean tools available There is a broad range of lean tools available. Many of these can be categorised into process charts, process mapping, network diagrams, and value stream mapping, as follows: Process charts – operations, transport, inspections, delays and storage Process mapping – operation times, batch sizes, setup times, queue sizes, downtimes Network diagram – Activities, activity times, immediate predecessors, activity costs and resources Value stream mapping – Change over times, distances, cycle times, inventory levels, delivery frequencies, etc. Some of the tools are more flexible in the type of problems that can be analysed. Examples of these are check sheets, control charts, Pareto analysis, and the Fishbone diagram. Bicheno & Holweg (2008) distinguished between four types of flexibility, namely process flexibility, product flexibility, volume flexibility and labour flexibility. These are detailed in the table below. The organisation can then devise its strategy according to the type of flexibility desired. Some other tools are histograms, Pareto charts, cause and effect diagrams, flow charts and control charts. Table 1: Types of flexibility and appropriate strategies Process flexibility Product flexibility Volume flexibility Labour flexibility Link customer requirements directly to production, so that decisions are based on real customer demand, rather than on demand forecasting. Bring customisation closer to the customer to avoid relying on stocks of finished products. Reduce dependency on full capacity by negotiating with workers and suppliers. Capacity/Time flexibility, in order to adjust labour to demand levels. Integrate suppliers to make orders visible to all value chain partners Manage product variety by understanding the cost and profit implications of choice. Diversify production plants, using dual-plant or multimodal plant strategies to cope with volume variability. Skill flexibility, whereby people can fulfil various tasks. Perpetuate sales data through the supply chain to avoid any time delays and enable a fast response to changes. Make support structures more mutable to support total responsiveness. Use incentives to manage demand and profits, rather than reactively discount excess stock. Geographical flexibility (ability to move workers between plants). (Source: Bicheno & Holweg, 2008) It is pertinent to point out that strictly; lean is not merely a set of tools. Individual tools are useful for specific purposes, but they are designed to be used together in such a way that increases overall efficiency. The combination and synchronisation of tools allows for a wide range of strategic options. The improvement in competitiveness is made possible by “an end-to-end value stream” (Bicheno & Holweg, 2008). It is therefore a complete system, which involves processing for enhancing value by reducing waste. Lean tools serve to be applied such that they improve specific and overall efficiency. Nonetheless, each of the specific problems listed above will now be examined in turn according to the objectives. First problem: mistakes with order Mistakes could be made at any time during ordering, but most of these tend to be the result of human errors. It is important to prevent mistakes, for example because it could lead to producing defective parts, giving the wrong service, and ultimately to customer dissatisfaction. Moreover, “mistakes in one area have consequences in all others” (Nicholas & Steyn, 2008: 485). The alternative could be to make inspections but this itself is not mistake proof, and it is also an inefficient method. Preventing mistakes could eliminate the possibility of failures, and thus producing wastes. This could in turn avoid time wasting and prevent unnecessary costs. Mistakes with an order can be prevented by implementing a safety mechanism at any stage of the ordering process where mistakes would be likely to occur. The Japanese term for making processes protected from mistakes is ‘poka yoke’ (ポカヨケ), which literally means ‘mistake proofing’. This concept was first formalised as a safety mechanism in the Toyota Production System. The mechanism or method should be able to just avoid mistakes from happening altogether. In some engineering processes, some mistakes can be prevented by making equipment and parts simply not work together if the combination is not permitted. The technique is therefore to make such designs that disallow mistakes from happening by first anticipating the kind of mistakes that could happen. A simple example is a three-pin plug that can only fit into a standard three-pin socket in one way. A mistake cannot occur because the plug and socket are designed to prevent it. Similarly, a USB device can only be inserted into a USB port in one right way. However, CDs are not mistake proof in the same way. Examples of such mechanisms for ordering processes could be the following: A waiter lets the customers enter the details of the order themselves in some input device such as an iPad and confirms the order before having the food prepared. A customer service centre can streamline the process for gathering important data about their customers and their orders and issues. To illustrate how mistakes with an order can be avoided, suppose a company has several ranges of products such as books, clothing and stationery and presently uses a four-digit number to identify items. Codes such as 1234 or 3516 provide no clue as to what range the item belongs to. It could also be possible to confuse these numbers with other strings of numbers as in dates or telephone numbers according to the number of digits. One solution could be to assign a letter to start off each code to make it recognisable, firstly to which range the item belongs to, and secondly to help distinguish it from other number strings, i.e. prevent mistakes. Examples of existing and alternative new codes and remarks about their order entry are given in the table below. Existing code New code Remarks 1234 B1234 It is clear that this item is a book, so if a customer ordered a book, there can be no mistake, for example by entering the code 1324 instead, which could be an item of clothing. 251210 C251210 It is clear that this item is a piece of clothing that has been ordered and not the date 25-Dec-2010. Second problem: long setup times Setup times are when certain activities are undertaken that do not add any value to the product. Long setup times can lead to problems such as insufficient flexibility, large batch sizes, mounting stocks, and therefore a waste of inventory. The problem is very important to tackle because it is highly wasteful. Reducing the setup times can potentially increase capacity and thereby increase productivity, improve delivery times, and reduce batch sizes and costs of maintaining inventory. Setup times can be monitored and designed effectively by successful capacity planning. Long setup times can be reduced by using Cycle Time Reduction (CTR) techniques. This involves examining the entire order-to-delivery process for identifying opportunities for making it more efficient. Examples of strategies for reducing setup times could be as follows: Improving documentation to assist setups Minimising waiting times in cases where these are contributing to the long setup times Use of checklists to ensure the requirements are being met Reducing the complexity involved in the setup process An example of the use of a lean tool for reducing setup times is for Flexographic Label Printing, when it was found to lead to considerable downtime (TPS, 2007). They used Single Minute Exchange of Die (SMED) to reinvent the entire operation for minimising downtime. Other issues were also addressed at the same time using other tools. As far as setup times are concerned however, they were able to reduce setup and changeover times down from an average of 5 hours to less than 30 minutes. The Setup Time Reduction is therefore a process applied to reduce changeover time using SMED. The analysis should help to identify which functions can be eliminated and which operations can be undertaken prior to setup. The technique for reducing setup time involves closely examining the existing setup process, documenting it, separating its internal and external elements, and streamlining the elements after converting the internal elements to external ones. A trial should be conducted in order to test the new setup, and if successful in reducing time, it should then be documented for reference. This procedure is summarised in the table below. In practice, there are a number of functions within an organisation that impact upon setup times. These would therefore need to be improved as well in order to improve setup times. Phase Details 1 Examine existing setup 2 Document existing setup 3 Separate internal and external elements 4 Convert internal elements to external and streamline both elements 5 Conduct trial of new setup 6 Document new setup Third problem: Frequent machine breakdowns Machines could breakdown if inadequate inspections fail to detect problems early on or if they have been detected, then from failing to adequately conduct maintenance. Frequent machine breakdowns in critical operations affect other processes as well and therefore have a major impact on the organisation. It is not therefore so much the frequency of breakdowns but their severity that is of more concern (Nicholas, 1998: 219). It is possible that operational staff can fix minor breakdowns on the spot but major breakdowns are likely to require the attention of more technical staff. Regardless, some form of predictive maintenance is necessary as the advance warning system can indicate if and when a replacement or overhaul is needed in order to prevent more serious problems developing (Nicholas, 1998: 233). However, the solution should focus not only on effective regular preventive maintenance for general checkups, and corrective maintenance to deal with problems as they occur, but also on ‘maintenance prevention’. The latter is key to implementing lean techniques for a more long term and thorough implementation. It involves making important decisions that can impact significantly on minimising the frequency of machine breakdowns. The most appropriate tool for dealing with frequent machine breakdowns is Total Productive Maintenance (TPM). This can help to use the equipment to its full potential and maintain it at its optimum level. TPM thus maximises the equipment’s productivity over its lifetime. In addition, TPM also incorporates measures for Overall Equipment Effectiveness (OEE), which can help by relating the operation times with the rate of performance and quality output. Its formula is given below. A smaller value would indicate scope for improvement. OEE: availability x performance x quality TPM involves several persons, including those not directly involved in the maintenance. The objective is to eliminate the six major losses that lead to sub-optimum performance, not just restricted to breakdowns, which are as follows: Setups Start-ups Slowdowns Idling Defects Breakdowns Although TPM has many advantages, it is not easy to implement. It requires a high degree of commitment as well as infrastructural investment. It may not be possible to implement TPM effectively if insufficient resources are provided. Moreover, TPM is a long-term strategy, as it also requires a changed culture and approach. As a case study, the managing director of Aster Training recounts how as a production manager, he helped introduce ‘technical operators’ (Wilson, 2006). These were regular machine operators who had been trained and were capable of undertaking some maintenance and change procedures that were previously carried out by more skilled maintenance technicians. The six months of initial training shows that it took time to make the new arrangement possible, but the outcome was satisfactory because it saved a lot of time from having to wait for maintenance technicians each time maintenance was required no matter how minor. In Whirlpool’s case, the company actually implemented a combination of tools and strategies to establish its TPM system (Ryan, 2010). This included root cause failure analysis, a preventive/predictive maintenance system, support from divisional leadership, etc. This shows that it is a synchronisation therefore of a mix of tools and strategies that leads to more efficient outcomes. Fourth problem: Delays in repairing equipment Delays in repairing equipment can occur due to a number of possible reasons. For example: Waiting to obtain supplies of parts to undertake the repairs Lack of expertise in repairing equipment Absenteeism of repair technicians Unrealistic schedules in anticipating the repair times Delays in repairing equipment are a waste because they do not add any value. There are already delays during repairs, but such extended delays waste even more time. Furthermore, if the delays set back critical tasks, the overall project or operation is delayed due to a ripple effect. Repairing equipment promptly is therefore necessary in order to bring the equipment to normal working condition as soon as possible, and minimise the disruption. A measure of the delays can be obtained by using process charts, and by process mapping techniques such as value stream mapping (VSM). However, it is a lengthy procedure due to the time required to monitor the processes over a period. Contingency plans should be drawn beforehand in anticipation of any possible delays. Another strategy could be to maintain essential supplies of parts in anticipation of future repairs in order to prevent the kind of delays caused by having to wait for supplies. Nonetheless, VSM is very useful for identifying such wastes as delays by depicting the flow of information and materials. A triangle symbol is usually used to indicate a delay, which is also calculated precisely and stated below the symbol. The goal is then to minimise the delay. In the simple illustration below, there is a delay of x minutes between activities 1 and 2. Simple illustration of a delay between two activities Fifth problem: Long transportation distances/times Transportation problems typically involve one or more of the following: Optimising distribution networks Identifying suitable locations of plants Minimising setup times Allocating products or parts to specific machines Long transportation distances/times could be wasting time when it is possible to accomplish the same in less time and usually therefore at a lower cost. It is in short, an inefficiency of distances and times. The chief objective in case of such problems is therefore to reduce times spent during transportation through minimising distances travelled, which consequently also reduces transportation costs. Problems that can be made to fit the transportation model can be solved using the transportation method instead of using the full linear programming formulations (Barnett, 1996). The procedure can be summarised, as shown in the table below. Although this method would be suitable if the transportation model can be applied, it would not be suitable therefore if it cannot. However, if this method is used, it involves some guesswork during the third step, and the later steps may have to be repeated if the optimum solution is not found immediately. Thus, it could prove useful in place of full linear programming but there is no precise way for identifying the optimum solution in the first instance. Table 2: Steps for solving the transportation problem 1 Formulate problem according to transportation format 2 Assign each journey a unit cost 3 Find a first feasible solution (i.e. possible though not necessarily optimum) 4 Test for optimality 5 If not optimum, improve the solution 6 Repeat the previous two steps until the optimum solution is reached Source: Barnett, 1996 (adapted) It is possible to graphically depict transportation problems using network diagrams, as the one shown below for illustration. However, as mentioned, linear programming models are usually used to solve real world problems that are likely to be much more complex. Spreadsheet can also be used to assist in solving the problems. The diagram below shows nodes and branches for a network of railroad routes. The numbers assigned to each branch usually represents the distance, time or cost. The first node in this case is the location of origin and the others represent possible destinations. The network helps to see which is the shortest distance, time interval or cost. If distances are to be minimised, then the problem becomes a shortest route problem with the objective of finding the shortest distance. Illustration of a simple network diagram (Source: Taylor, 2008: 291) Solving transportation problems is common, for example in the petroleum industry. In this context, models for solving transportation problems are designed to find out how to minimise the total of cost, maximise production, satisfy storage requirements in the depots and at the same time, meet the demand for oil in different areas (Sharma & Jana, 2009). In fact, such transportation problems are a concern for any organisation involved in supply chain management. Summary of analysis There is a commonality in the different problems in that they all lead to inefficiencies. In general, the two basic affected resources are time and cost. The inefficient situations caused by the problems tend to increase both times and costs more than necessary or beyond the degree of being unavoidable. The objective is generally therefore, to improve efficiency and effectiveness. Although specific problems can be dealt with individually, in practice, an improvement in overall effectiveness is only achieved by adopting a combination of different tools and strategies, and in synchronisation with one another. The table below summarises the key points for each of the above problems with reference to most of the initial objectives. As for energy or environmental auditing, this is useful for checking compliance with what is expected. “It’s a great tool for testing whether your organization is on track, or for learning how to get back on track” (Gordon, 2001: 65). The tools therefore help in energy auditing because they can help to know how efficient the organisation is given that a high degree of efficiency is also associated with being energy and resource efficient. Table 3: Summary of report findings Problem Reason(s) why it is a problem Most appropriate tool Basic tasks for implementation Barriers to implementation Primary function of tool user 1. Mistakes with order Fails to complete order as required Poka yoke Prevent mistakes Requires redesign Identify possibilities for making mistakes 2. Long setup times Inflexibility, large batch sizes, waste of inventory Cycle Time Reduction (CTR) Capacity planning Re-examination of order-to-delivery process Identify opportunities for reducing setup times 3. Frequent machine breakdowns Machine is unusable during breakdowns Total Productive Maintenance (TPM) and Overall Equipment Effectiveness (OEE) Preventive maintenance, corrective maintenance, and maintenance prevention Requires high degree of commitment, infrastructural investment, and change of culture Decision making on important factors to minimise problem 4. Delays in repairing equipment Extra time is wasted during extended repairs Process charts and process mapping Eliminate or minimise delays Requires detailed time monitoring Identify delays and how to avoid or minimise them 5. Long transportation distances/ times Distances and times are longer than the optimum Transportation method Reduce distances and improve times Formulation as transportation model and guesswork Identify optimum solution in model References Barnett, Howard. 1996. Operations management. Second edition. MacMillan Business Masters. Bicheno, John & Holweg, Matthias. 2008. The lean toolbox. Fourth edition. Picsie Books. Gordon, Pamela J. 2001. Lean and green: profit for your workplace and the environment. Berrett-Koehler Publishers. Nicholas, John M. 1998. Competitive manufacturing management: continuous improvement, lean production, customer-focused quality. Irwin/McGraw Hill. Nicholas, John M. & Steyn Herman. 2008. Project management for business, engineering, and technology: principles and practice. Butterworth-Heinemann. TPS. 2007. Case studies/results. ThroughPut Solutions. Available at http://www.tpslean.com/resultsall.htm [Accessed 25 December 2010]. Ryan, James K. 2010. Maximized manufacturing reaps rewards at Whirlpool – Findlay. TPM Online. Available at http://www.tpmonline.com/articles_on_total_productive_maintenance/tpm/whirpoolcase.htm [Accessed 25 December 2010]. Sharma, Dinesh & Jana, R. K. A hybrid genetic algorithm model for transhipment management decisions. International Journal of Production Economics, Vol. 122, Issue 2, pp. 703-713. Taylor. 2008. Introduction to management science. 9th edition. Pearson Education. Wilson, Paul. 2006. I hadn’t really intended to introduce Total Productive Maintenance (TPM). Aster Training. Plant Maintenance Resource Center. Available at http://www.plant-maintenance.com/articles/Unintended_TPM.shtml [Accessed 25 December 2010]. Read More
Cite this document
  • APA
  • MLA
  • CHICAGO
(Use Of A Range Of Lean Tools Report Example | Topics and Well Written Essays - 1750 words, n.d.)
Use Of A Range Of Lean Tools Report Example | Topics and Well Written Essays - 1750 words. https://studentshare.org/engineering-and-construction/1574549-use-and-analyse-the-use-of-a-range-of-lean-tools-engineering-business
(Use Of A Range Of Lean Tools Report Example | Topics and Well Written Essays - 1750 Words)
Use Of A Range Of Lean Tools Report Example | Topics and Well Written Essays - 1750 Words. https://studentshare.org/engineering-and-construction/1574549-use-and-analyse-the-use-of-a-range-of-lean-tools-engineering-business.
“Use Of A Range Of Lean Tools Report Example | Topics and Well Written Essays - 1750 Words”. https://studentshare.org/engineering-and-construction/1574549-use-and-analyse-the-use-of-a-range-of-lean-tools-engineering-business.
  • Cited: 0 times

CHECK THESE SAMPLES OF Use Of A Range Of Lean Tools

MA TEFL: Technology in TEFL

You will develop the skills and knowledge required to use and integrate a wide range of media into your online platforms, which will help you interact more professionally and confidently with your peers in order to help you establish professional networks.... It talks about different tools, which can assist teachers' career.... It seems that this video will help teachers to have new ideas and tools everyday.... The books divided into twelve parts and each part have different ideas to explain how to use technology in the classroom and what is the process you have to use....
5 Pages (1250 words) Essay

Digital Tools That Increase Academic Success For The Adult Learner

Today, it is not uncommon to find students and teachers in a lecture hall using a range of digital tools for… Digitals tools can enhance the adult learning experience and prepare students for academic success by providing learning opportunities that allow students to learn when they learn best and progress at their own pace.... With the current advancements in technology, learning has shifted from the conventional methods of learning to modern styles that involve the use of digital tools....
5 Pages (1250 words) Research Paper

Defining manufacturing sequence of a tool steel

As steel can be used for various applications, from building material to machinery and equipment manufacture, tools that work on such metal alloys must be stronger and tougher.... Hence, material used to make such tools from different grades of steel is called tool steel.... While tool steels are fundamentally medium or high carbon steels, they have varied amounts of specific elements that shape them into specialized application tools, with significant characteristics....
20 Pages (5000 words) Literature review

Construction and Purpose of Chumash Tomol

The paper «Construction and Purpose of Chumash Tomol ” tells about Indians' canoe that today might seem exotic and not very warehouse, but it was a big part of the Indians' cultural and economic life.... The tomol made it possible fishing, cargo transportation, and regular cross-channel trade....
7 Pages (1750 words) Coursework

Internet Grammar Tool Developed at Chemnitz University

Through the use of questionnaires provided, the system is able to aid the teacher on a learner's language progression, computer literacy and general behaviour.... b) CING, through its deductive program, is able to analyze areas of each language such as the use of verbs, nouns and clauses.... The paper “CALL tools” focusses on an internet grammar tool that was developed at Chemnitz University.... hellip; CALL tools have only just recently begun being used in schools and homes in large scale capacities....
6 Pages (1500 words) Essay

Application of Lean Tools and Techniques for Continues Improvement of Electronics Manufacturing's

The author of the paper "Application of lean tools and Techniques for Continues Improvement of Electronics Manufacturing's" will begin with the statement that the new uprising within the manufacturing of goods and services sector has caused various challenges for the electronic industry.... Therefore, the resounding principle of lean manufacturing is basically to make cost reductions through a continuous improvement that will lead to the ultimate reduction of costs incurred in the creation of products and services rendered, and thus raising more profits....
13 Pages (3250 words) Term Paper

Fire Protection Techniques and Effects to Operational Strategy of Fire Fighting

This case study "Fire Protection Techniques and Effects to Operational Strategy of Fire Fighting" presents a fire that is a good servant when properly handled but a bad master when poorly handled.... It is very useful in day-to-day activities, and we cannot do without it.... hellip; Devastation from fire is known by everybody, and we should be all dedicated to making living places safer....
10 Pages (2500 words) Case Study

Machine Tool Characteristics and Operation

The focus of this paper is to analyze the characteristics of various machine tools and their machining operations.... The focus of this paper is to analyze the characteristics of various machine tools and their machining operations.... The paper has also explained the operation of types of drive and the axis control system, such as hand-wheels and servo-motors, forgiven machine tools and described the six degrees of freedom of a rigid body....
8 Pages (2000 words) Assignment
sponsored ads
We use cookies to create the best experience for you. Keep on browsing if you are OK with that, or find out how to manage cookies.
Contact Us