StudentShare
Contact Us
Sign In / Sign Up for FREE
Search
Go to advanced search...
Free

The Inventory Turnover Rate for CocaCola - Essay Example

Cite this document
Summary
The following paper under the title 'The Inventory Turnover Rate for Coca–Cola' presents a measure of the company’s ability to cover its current liabilities using its existing assets. It is evident that Pepsico is in a better position compared to Coca–Cola…
Download full paper File format: .doc, available for editing
GRAB THE BEST PAPER96.9% of users find it useful
The Inventory Turnover Rate for CocaCola
Read Text Preview

Extract of sample "The Inventory Turnover Rate for CocaCola"

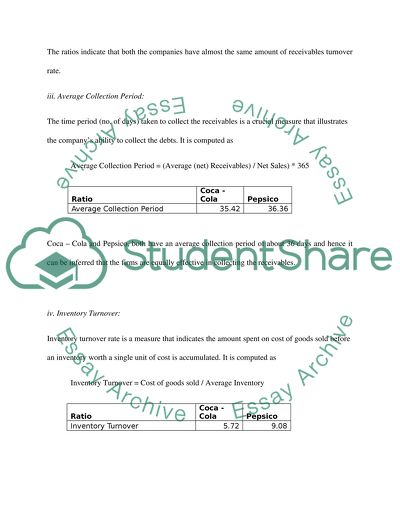
Interpreting Financial ments Liquidity Ratios: i. Current Ratio: The current ratio is a measure of the company’s ability to cover its current liabilities using its current assets. It is computed as Current Ratio = Current Assets / Current Liabilities Ratio Coca - Cola Pepsico Current Ratio 1.10 1.28 It is evident that Pepsico is in a better position compared to Coca – Cola. However, it is imperative to note that any current ratio above 1 is considered sufficient. Hence both the companies are in good liquidity condition. ii. Receivables Turnover: The receivables turnover is an indication of the debts that are to be collected and is computed as Receivables Turnover = Net Sales / Average Receivables Ratio Coca - Cola Pepsico Receivables Turnover 10.31 10.04 The ratios indicate that both the companies have almost the same amount of receivables turnover rate. iii. Average Collection Period: The time period (no. of days) taken to collect the receivables is a crucial measure that illustrates the company’s ability to collect the debts. It is computed as Average Collection Period = (Average (net) Receivables) / Net Sales) * 365 Ratio Coca - Cola Pepsico Average Collection Period 35.42 36.36 Coca – Cola and Pepsico, both have an average collection period of about 36 days and hence it can be inferred that the firms are equally effective in collecting the receivables. iv. Inventory Turnover: Inventory turnover rate is a measure that indicates the amount spent on cost of goods sold before an inventory worth a single unit of cost is accumulated. It is computed as Inventory Turnover = Cost of goods sold / Average Inventory Ratio Coca - Cola Pepsico Inventory Turnover 5.72 9.08 The inventory turnover rate for Coca – Cola indicates that for every $ 5.72 million spent on goods, $ 1 million goes into inventory. However, in the case of Pepsico $ 1 million worth of inventory is accumulated only when $ 9.08 million is spent on the cost of goods sold. Hence it is evident that Pepsico is effectively utilizing the cost spent on goods and moving them for sale. v. Days in Inventory: The time period (no. of days) spent by goods in the inventory indicates the ability of a firm to convert its inventory into sale. The days in inventory is measured as Days in Inventory = (Average Inventory / Cost of goods sold) * 365 Ratio Coca - Cola Pepsico Days in Inventory 63.84 40.21 The number of days in inventory for Pepsico is 40 days whereas it is 64 days for Coca – Cola. It is evident that Pepsico is more effective in converting its inventory into sale and hence has a better liquidity position in terms of the revenue generated. vi. Current Cash Debt Coverage: The current cash debt coverage is the ratio of the cash from operating activities to the average current liabilities, i.e., Current Cash Debt Coverage = Cash from Operations / Average Current Liabilities Ratio Coca - Cola Pepsico Current Cash Debt Coverage 0.63 0.77 It is evident that Pepsico generates more cash from operations to cover the liabilities when compared to that of Coca – Cola. Solvency Ratios: i. Debt to Total Assets Ratio: The debt to assets ratio or the gearing ratio is an indication of how well the company is utilizing the debts to raise capital and increase the capital structure. Debt to Total Assets = Total Liabilities / Total Assets Solvency Coca - Cola Pepsico Debt to Total Assets Ratio 49% 52% Both the companies have almost equally geared in terms of debt. The debt to total assets ratio is an indication of the company’s long term growth capacity and its ability to generate more capital through debts. ii. Times Interest Earned: Time Interest Rate figure is the ability to cover the interest expenses from the earnings. It is computed as the ratio of profit before interest and tax to the interest expense incurred. Times Interest Earned = Earnings before Interest and Tax / Interest Solvency Coca - Cola Pepsico Times Interest Earned 32.74 34.44 Both Coca – Cola and Pepsico have significant interest coverage, as the earnings are almost 33 times the interest expenses. Hence it is evident that the companies will not face any issues in covering the interest expenses. iii. Cash Debt Coverage Ratio: The cash debt coverage ratio is the ratio of the cash from operations after paying dividends and the average current liabilities. Cash Debt Coverage Ratio = (Cash from Operating Activities – Dividends) / Average Current Liabilities Solvency Coca - Cola Pepsico Cash Debt Coverage Ratio 0.38 0.57 The cash debt coverage is a measure of the ability of the company to cover its debts with the liquid cash in hand generated from the operations. Though both the firms have a significant value, Pepsico is able to generate higher cash from its operations and hence can manage about 57% of its debts with the cash from operations. iv. Free Cash Flow: The free cash flow measures the cash available to the company from its operations after taking into account any capital expenditures incurred during the period. It is computed as Free Cash Flow = Cash from Operating Activities – Capital Expenditures Solvency Coca - Cola Pepsico Free Cash Flow 5213 3667 The free cash flow, as the name indicates, is measured in million USD and is found that in 2004, Coca – Cola has a free cash of $ 5,213 million whereas Pepsico has about $ 3,667 million. It is evident that Coca – Cola has significantly higher free cash compared to that of Pepsico. Profitability Ratios: i. Profit Margin: The profit margin is the measure of the company’s ability to earn profit from the generated revenue. This is a very important and crucial ratio as this depicts the earning capacity of the company. Profit Margin = (Net Income / Net Sales) * 100 Profitability Coca - Cola Pepsico Profit Margin 22% 14% It is clear from the values that Coca – Cola is able to convert 22% of its revenue as earnings or profit, whereas Pepsico converts only 14% of its revenue into income. Hence the profitability of Coca – Cola is comparatively much higher than that of Pepsico. This is the percentage of revenue after all the expenses, interests and taxes that is available to the shareholders and to the company. ii. Asset Turnover: The Asset Turnover rate determines the ability of the company to effectively utilize its assets to generate revenue. It is important to note that a company generating high revenues may not actually be effective if its utilizing much higher value assets to generate sales. Hence the revenue can only be justified by measuring the company’s ability to use its assets. It is measured as follows, Asset Turnover = Net Sales / Average Total Assets Profitability Coca - Cola Pepsico Asset Turnover 0.75 1.10 Pepsico is able to generate revenue worth 110% of its assets. However Coca – Cola generates only 75% of its assets. Hence it is evident that Pepsico is effectively utilizing its assets compared to that of Coca – Cola. iii. Return on Assets: This ratio measures the income generating ability of the assets, in contrast to the asset turnover which measures the revenue. This ratio is also necessary, since the income or the earnings is given higher importance and a company should not only have high revenues, but should also earn the income from it. The return on assets is computed as Return on Assets = (Net Income / Average Total Assets) * 100 Profitability Coca – Cola Pepsico Return on Assets 17% 16% It is interesting to note that though Pepsico had a higher asset turnover rate, Coca – Cola has a higher return on assets, in terms of the income earned. Hence Coca – Cola is able to effectively generate income from its assets. iv. Return on Common Stakeholder’s Equity: This ratio measures the income that is available for the common stakeholders. It is measured as the ratio of net income to the average common stakeholder’s equity. Return on Common Stakeholder’s Equity = (Net Income / Average Common Stakeholder’s Equity) * 100 It is a measure that is of interest to potential investors and hence it is essential that the company maintains a steady and constantly growing return on common stakeholder’s equity to retain its current investors and also to attract new stakeholders. Pepsico and Coca – Cola have almost equal returns on common stakeholder’s equity and hence are equally attractive to potential investors. Read More
Cite this document
  • APA
  • MLA
  • CHICAGO
(“Interpreting Financial Statements Essay Example | Topics and Well Written Essays - 1500 words”, n.d.)
Interpreting Financial Statements Essay Example | Topics and Well Written Essays - 1500 words. Retrieved from https://studentshare.org/miscellaneous/1554539-interpreting-financial-statements
(Interpreting Financial Statements Essay Example | Topics and Well Written Essays - 1500 Words)
Interpreting Financial Statements Essay Example | Topics and Well Written Essays - 1500 Words. https://studentshare.org/miscellaneous/1554539-interpreting-financial-statements.
“Interpreting Financial Statements Essay Example | Topics and Well Written Essays - 1500 Words”, n.d. https://studentshare.org/miscellaneous/1554539-interpreting-financial-statements.
  • Cited: 0 times

CHECK THESE SAMPLES OF The Inventory Turnover Rate for CocaCola

Financial Management Coca-Cola Company

This signifies that each dollar of current liability of cocacola Company is backed by $1.... In this project the financial conditions of PepsiCo and the Coca cola Company has been analyzed from the point of view of the investor.... Various ratios have been calculated to analyze the financial strength of the company....
6 Pages (1500 words) Research Paper

Inventory Turnover of Centamin Plc

the inventory turnover ratio of the company in 2011 was 2.... the inventory turnover metric shows how many times a company is able to sell its entire inventory during a fiscal year (Investopedia, 2013).... This essay "inventory turnover" presents Centamin Plc was incorporated on March 24, 1970, in South Australia....
2 Pages (500 words) Essay

Using Evidence and Applying Relevant PR Concepts

Every organisation manages its relationships with its customers by a practice.... This practice process is generally referred as Public Relationship.... It is a mutually beneficial communication process which connects an organisation to its customers.... .... ... ... Using Evidence and Applying Relevant PR Concepts, Assess the Effectiveness of the Promotional Tactics and Strategy Used By ONE Organisation in the Last 12 Months ...
12 Pages (3000 words) Essay

Management Efficiency Impact on Performance within CocaCola

The objective of the project "Management Efficiency Impact on Performance within cocacola" is to find the existing link between management and performance of a multinational company - Coca Cola and to provide a rationale for management strategies leading to enhancing performance in the companies....
4 Pages (1000 words) Dissertation

High Rate of Employee Turnover

ProblemA high turnover rate among employees of a given company has a negative impact on the overall performance of the company.... The paper "High rate of Employee Turnover" highlights that the company should first seek to establish the reasons for employees wanting to leave the company, and then try to eliminate these reasons, as they are the main causes of employees leaving the company.... A high rate of employee turnover reduces the capability of the company to perform efficiently and at full capacity....
6 Pages (1500 words) Essay

Inventory management ratio analysis of Ford and GM

The days in a specific period are determined and divided by the inventory turnover formula.... There are two methods of calculating the inventory turnover.... the inventory turnover ratio determines the management's efficiency in converting the available inventory into sales.... the inventory turnover ratio of Ford is 15.... This essay describes inventory turnover ratio indicates the number of times the inventory in a specific company is converted to sales and replaced over a period....
4 Pages (1000 words) Essay

Strategic Management in Cadbury Plc

The author of the current research paper "Strategic Management in Cadbury Plc" underlines that Cadbury Plc is today at the crossroads.... Although basically still under the control of the Cadbury family, the company that has survived many challenges over the years.... ... ... ... The corporate strategic moves of Cadbury Plc have pushed it to a position of competing with other leading companies in the industry....
12 Pages (3000 words) Research Paper

CocaCola Funds Scientists Who Shift Blame for Obesity away from Bad Diets

This paper focuses on the analysis of a newspaper article by The New York Times on how scientists funded by cocacola shifted blame for obesity from bad diets to lack of physical exercises.... This paper focuses on the analysis of a newspaper article by The New York Times on how scientists funded by cocacola shifted blame for obesity from bad diets to lack of physical exercises.... This paper focuses on the analysis of a newspaper article by The New York Times on how scientists funded by cocacola shifted blame for obesity from bad diets to lack of physical exercises....
8 Pages (2000 words) Article
sponsored ads
We use cookies to create the best experience for you. Keep on browsing if you are OK with that, or find out how to manage cookies.
Contact Us