StudentShare
Contact Us
Sign In / Sign Up for FREE
Search
Go to advanced search...
Free

MGM600-0803B-02 Applied Managerial Decision-Making - Phase 3 Individual Project - Essay Example

Cite this document
Summary
The chi-square test is conducted to examine whether the standard deviation of a population or sample is equal to the predetermined value of standard deviation. The test can be performed from two perspectives: either as one sided test or two sided test. The two sided test is…
Download full paper File format: .doc, available for editing
GRAB THE BEST PAPER97.4% of users find it useful
MGM600-0803B-02 Applied Managerial Decision-Making - Phase 3 Individual Project
Read Text Preview

Extract of sample "MGM600-0803B-02 Applied Managerial Decision-Making - Phase 3 Individual Project"

MGM600-0803B-02 Applied Managerial Decision-Making - Phase 3 Individual Project The chi-square test is conducted to examine whether the standard deviation of a population or sample is equal to the predetermined value of standard deviation. The test can be performed from two perspectives: either as one sided test or two sided test. The two sided test is performed against the alternative hypothesis that the actual standard deviation is greater than or less than the specified value. The one sided test concentrate only on one aspect.

The chi-square test can either be one sided or two sided depending on the situation. For instance, while testing new software, we may require an understanding whether the variance of information is greater than the variability of the existing procedure. Thus the chi-square test hypothesis may be described as follows:Null Hypothesis is represented as H0 where σ = σ0Alternative Hypothesis is represented as Ha where Ha : σ less than σ0 (a low one tail test result)σ greater than σ0 (an upper one tail test result)σ is not equal to σ0 (a two tailed test result)The test statistics is calculated by the formula T = (n-1) (s/ σ0)2.

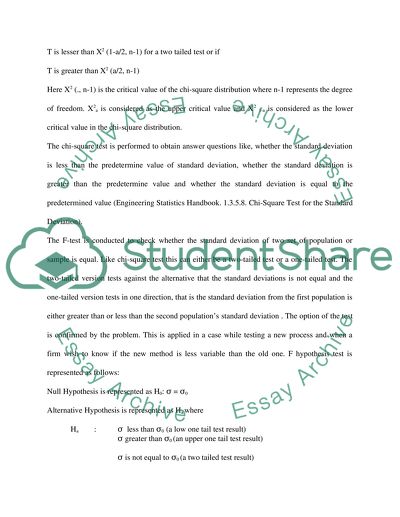
The main element of this formula is the ratio s/ σ0 which compares the ratio of the sample standard deviation to the target standard deviation and n is the sample size and s is the sample standard deviation. The more this ratio deviates from 1, the probability of rejecting the null hypothesis increases. Significance level:The null hypothesis is rejected when the standard deviation is a specific value σ0 if T is greater than X2 (a, n-1) for upper one tailed alternativeT is lesser than X2(1-a, n-1) for a lower one tailed alternativeT is lesser than X2 (1-a/2, n-1) for a two tailed test or if T is greater than X2 (a/2, n-1)Here X2 (., n-1) is the critical value of the chi-square distribution where n-1 represents the degree of freedom.

X2a is considered as the upper critical value and X2 1-a is considered as the lower critical value in the chi-square distribution. The chi-square test is performed to obtain answer questions like, whether the standard deviation is less than the predetermine value of standard deviation, whether the standard deviation is greater than the predetermine value and whether the standard deviation is equal to the predetermined value (Engineering Statistics Handbook. 1.3.5.8. Chi-Square Test for the Standard Deviation).

The F-test is conducted to check whether the standard deviation of two set of population or sample is equal. Like chi-square test this can either be a two-tailed test or a one-tailed test. The two-tailed version tests against the alternative that the standard deviations is not equal and the one-tailed version tests in one direction, that is the standard deviation from the first population is either greater than or less than the second population’s standard deviation . The option of the test is confirmed by the problem.

This is applied in a case while testing a new process and when a firm wish to know if the new method is less variable than the old one. F hypothesis test is represented as follows:Null Hypothesis is represented as H0: σ = σ0Alternative Hypothesis is represented as Ha where Ha : σ less than σ0 (a low one tail test result)σ greater than σ0 (an upper one tail test result)σ is not equal to σ0 (a two tailed test result)Test Statistics, F+ S21 / S22S21 , S22 are the sample variance. This ratio is compared to the old standard deviation and the amount of deviation represents the unequal variance of the population.

Significance LevelThe null hypothesis is rejected ifF is greater than F (a, n1-1, n2-1) for upper on tailed testF is lesser than F (1-a, n1-1, n2-1) for lower one tailed testF is lesser than F (1-a/2, n1-2, n2-1) for two tailed test orF is greater than F (a/2, n1-1, n2-1).In this F distribution F (a,k-1, n-k) is the critical value. Fa is the upper critical value and Fa-1 is the lower critical value (F-Test for Equality of Two Standard Deviations).Chi-square distribution can be found out using a statistical experiment where a random sample of size n is taken from a normal population having a standard deviation of σ.

It may be assumed that the standard deviation is equal to s. Chi-square can now be calculated with the equation T = [ ( n - 1 ) * s2 ] / σ2. The experiment can be repeated infinite number of times to arrive at a sampling distribution for a chi-square statistics. Chi-square distribution may be defined by the probability density function Y = Y0 * (Χ2) ( v/2 - 1 ) * e-Χ2 / 2 . The chi-square distribution has several properties that indicate that the mean of the distribution is equal to the number of degrees of freedom: μ = v.

The variance is equal to two times the number of degrees of freedom: σ2 = 2 * v. When the degree of freedom is high, the chi-square curve approaches a normal distribution. Cumulative Probability and the Chi-Square DistributionThe chi-square distribution is designed in a particular manner that the total is equal to 1. The cumulative probability of a chi-square statistics can be evaluation from the following examples.For example, the Oyster Battery Corporation has manufactured a cell phone battery.

The average charge of the battery is sixty minutes for a single recharge. The standard deviation is calculated at four minutes. A quality control test by the company tested seven randomly selected batteries. The standard deviation of the randomly selected battery is six minutes. The chi-square test for these batteries may be evolved as follows;Standard deviation of the battery is 4 minutesStandard deviation of the selected sample is 6 minutesThe number of selected battery is 7To compute the chi-square statistic, we plug these data in the chi-square equation, as shown below. T = (n-1) (s/ σ0)2T = [ ( 7 - 1 ) * 62 ] / 42 = 13.

5 where T is the chi-square statistic, n is the sample size, s is the standard deviation of the sample, and σ is the standard deviation of the population. The problem may be evaluated in a different manner. The battery company conducts a quality control test by selecting seven batteries. The test concludes that the standard deviation is 6 minutes and the chi-square statistics is 13.5. Even if we follow this method the degrees of freedom equates to n-1 = 7-1 = 6.The cumulative probability can be calculated by calculating the chi-square statistics and degrees of freedom in the chi-square distribution calculation which gives the result as 0.96. The result shows that the probability of standard deviation being less than or equal to 6 minutes is 0.96 times. The result also reveals that the probability that the standard deviation would be greater than 6 minutes is 1 – 0.96 or 0.04 times (Stat Trek.

Statistics Tutorial: Chi-Square Distribution).In conclusion chi-square distribution is used to compare the analyzed frequencies to expected frequencies. The selection of menu can be used to measure the probability of chi-square statistics or to find out the critical value of chi-square for a particular probability. The Vice President (Sales) of Widgecorp may be briefed about the qualitative analysis of variance using non-parametric like the chi-square test. The null hypothesis and alternative hypothesis may be calculated according to the formula to arrive at the variance of using the software by the marketing personnel to analyse present performance with expected performance and thereby improve their marketing strategies.

ReferenceEngineering Statistics Handbook. 1.3.5.8. Chi-Square Test for the Standard Deviation. Available:http://www.itl.nist.gov/div898/handbook/eda/section3/eda358.htm. Accessed on September 18, 2008.F-Test for Equality of Two Standard Deviations. Available: http://www.itl.nist.gov/div898/handbook/eda/section3/eda359.htm. Accessed on September 18, 2008.Stat Trek. Statistics Tutorial: Chi-Square Distribution. Available: http://stattrek.com/Lesson3/ChiSquare.aspx. Accessed on September 18, 2008.

Read More
Cite this document
  • APA
  • MLA
  • CHICAGO
(“MGM600-0803B-02 Applied Managerial Decision-Making - Phase 3 Essay - 1”, n.d.)
Retrieved from https://studentshare.org/miscellaneous/1548219-mgm600-0803b-02-applied-managerial-decision-making-phase-3-individual-project
(MGM600-0803B-02 Applied Managerial Decision-Making - Phase 3 Essay - 1)
https://studentshare.org/miscellaneous/1548219-mgm600-0803b-02-applied-managerial-decision-making-phase-3-individual-project.
“MGM600-0803B-02 Applied Managerial Decision-Making - Phase 3 Essay - 1”, n.d. https://studentshare.org/miscellaneous/1548219-mgm600-0803b-02-applied-managerial-decision-making-phase-3-individual-project.
  • Cited: 0 times

CHECK THESE SAMPLES OF MGM600-0803B-02 Applied Managerial Decision-Making - Phase 3 Individual Project

MGM600-0803B-02 Applied Managerial Decision-Making - Phase 1 Discussion Board

A population data is a discrete data because it mgm600-0803b-02 applied managerial decision-making - phase Discussion Board Information that can be characterised into a group is called discrete data.... Discrete data can be counted by finite numbers which cannot be further divided into meaningful information....
2 Pages (500 words) Essay

Why Data Driven Decision Making is Your Path To Business Success

The management style and business decision making of WidgeCorp are primarily based on statistical data analysis of the relevant information taken from the surveys and US… The new Regional Sales Manager of WidgeCorp requires assistance in deciphering and analysing the demographic data to recommend appropriate strategy for its new snack that it needs to introduce in the market....
2 Pages (500 words) Essay

MGM600-0803B-02 Applied Managerial Decision-Making - Phase 3 Discussion Board 2

The test uses the F distribution and can handle any number of factors, but the researcher often is interested only in a few (Doane, Analysis of Variance (ANOVA) Phase-3(DB2) MGM600-0803B-02: applied managerial decision-making Analysis of Variance (ANOVA) Phase-3(DB2) An ANOVAtest is a technique for analyzing the variances in multiple populations to check they have similar distribution and hence an equivalent mean.... applied Statistics in Business and Economics....
2 Pages (500 words) Essay

MGM600-0803B-02 Applied Managerial Decision-Making - Phase 4 Group Project

In the end, mgm600-0803b-02 applied managerial decision-making - phase 4 Group Project mgm600-0803b-02 applied managerial decision-making - phase 4 Group ProjectTitus Rock ManickamOrder No.... 24115720 September 2008MGM600-0803B-02 applied managerial decision-making- Phase 4 Group ProjectIntroductionThere are many multivariate techniques....
2 Pages (500 words) Essay

MGM600-0803B-02 Applied Managerial Decision-Making - Phase 4 Individual Project

While studying the characteristics of a series involving only a single variable, which is generally referred to as univariate distribution, one is often required to confine oneself to the measure of central tendency, its variation, skewness, etc.... However, when the idea of a… iate distribution or a multivariate distribution comes into scenario, one may require to know how the two or more given variables are related to each other and to quantify the extent of their relationship....
2 Pages (500 words) Essay

MGM600-0803B-02 Applied Managerial Decision-Making - Phase 4 Discussion Board

For example, we know that the level of income of an individual can be explained by education, position, race, gender, and even age.... One of these frequently utilized tools is the regression analysis which simply put, is the determination of relationship between or among variables....
2 Pages (500 words) Essay

MGM625-0903A-01 Applied Finance for Decision-Making - Phase 1 Individual Project 2

he working capital of the firm is applied Finance for Decision Making Look at Superiors balance sheet and analyze it.... Be sure to focus on working capital, current ratio, short-term and long-term debt.... End with a bulleted summary addressing the CFOs concerns as related to these areas. ...
2 Pages (500 words) Essay

Decision Making with Managerial Accounting

Managerial accounting techniques facilitate the provision of sustainable information that is necessary decision-making while influencing an organization's financial performance.... Managerial accountants also play a major role in the decision-making the process of the organization as all information pertaining to the financing of the company and the application of the same run through them (Pietrzak and Wnuk-Pel, 2015).... This paper "Decision Making with managerial Accounting" focuses on the fact that managerial accounting, also known as Management Cost Accounting refers to the process through which organizations determine the number of resources needed to undertake its mandate....
12 Pages (3000 words) Case Study
sponsored ads
We use cookies to create the best experience for you. Keep on browsing if you are OK with that, or find out how to manage cookies.
Contact Us