StudentShare
Contact Us
Sign In / Sign Up for FREE
Search
Go to advanced search...
Free

Managerial Accounting and Business - Essay Example

Cite this document
Summary
The paper "Managerial Accounting and Business" tells that the most important thing revealed in the horizontal analysis is a trend. The comparison done by horizontal analysis for several years brings before us the trend followed by the company. …
Download full paper File format: .doc, available for editing
GRAB THE BEST PAPER94.8% of users find it useful
Managerial Accounting and Business
Read Text Preview

Extract of sample "Managerial Accounting and Business"

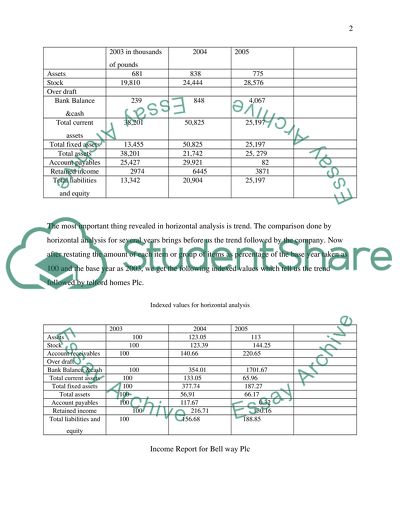
Address: Managerial Accounting and Business Analysis To find out appropriate conditions for investment in the shares of a company requires the following analyses. Horizontal or comparable analysis. Vertical analysis Ratio analysis Debt analysis In the present context we have to construction companies available to invest operating in a same stock exchange. It is advisable to choose the best after performing all the above analyses on the basis of financial reports of the companies from 2003 to 2005. Income Statement for Telford homes Plc. 2003 in thousand pounds000 000 2004 2005 Turnover 25,334 41,051 58,245 Gross Income 6,885 10,377 13,298 Trading income 4,975 7,484 9,471 Interest received 22 47 79 Earnings before interest and tax 4,272 6.615 7,770 Interest paid 725 916 1,780 Taxation 1.282 1,897 2,903 Earnings after tax 2.990 4,718 5,467 Dividends 755 1,247 1,596 Retained income for the year 2,974 6,445 3,871 Balance sheet for Telford homes Plc. 2003 in thousands of pounds 2004 2005 Assets 681 838 775 Stock 19,810 24,444 28,576 Over draft Bank Balance &cash 239 848 4,067 Total current assets 38,201 50,825 25,197 Total fixed assets 13,455 50,825 25,197 Total assets 38,201 21,742 25, 279 Account payables 25,427 29,921 82 Retained income 2974 6445 3871 Total liabilities and equity 13,342 20,904 25,197 The most important thing revealed in horizontal analysis is trend. The comparison done by horizontal analysis for several years brings before us the trend followed by the company. Now after restating the amount of each item or group of items as percentage of the base year taken as 100 and the base year as 2003, we get the following indexed values which tell us the trend followed by telford homes Plc. Indexed values for horizontal analysis 2003 2004 2005 Assets 100 123.05 113 Stock 100 123.39 144.25 Account receivables 100 140.66 220.65 Over draft Bank Balance &cash 100 354.01 1701.67 Total current assets 100 133.05 65.96 Total fixed assets 100 377.74 187.27 Total assets 100 56,91 66.17 Account payables 100 117.67 0.32 Retained income 100 216.71 130.16 Total liabilities and equity 100 156.68 188.85 Income Report for Bell way Plc Figures in million of pounds 2003 000 000 2004 2005 Turnover 954,197 1,092,571 1,178,063 Gross Income 739,479 829,598 280,402 Trading income 172,762 213,277 229,448 Interest received 1,427 1,361 2,267 Earnings before interest and tax 169,251 205,530 218,163 Interest paid 5,811 10,477 13,474 Taxation 50,687 61,700 65,400 Earnings after tax 169,251 205,530 152,763 Dividends 24,166 29,864 37,137 Retained income for the year 94,398 113,971 115,620 Balance sheet for Bell way Plc. 2003 2004 2005 Assets 16,200 16,673 16,203 Stock 478,935 587,635 Over draft Bank Balance &cash 3,468 4,926 703,048 Total current assets 482,327 590,246 697,649 Total fixed assets 16,200 16,200 697,649 Total assets 482,327 590,246 681,446 Account payables Retained income 94,398 113,971 115,626 Total liabilities and equity 482,327 590,246 697,649 If the above results are converted into indexed values form the following results can be obtained. 2003 2004 2005 Assets 100 102.47 109.26 Stock 100 119.56 145.27 Account receivables 100 100 100 Over draft Bank Balance &cash 100 135.83 75.24 Total current assets 100 118.12 145.02 Free hold property Total assets 100 117.52 144.69 Account payables 100 100 100 Total liabilities 100 125.04 121.57 Equity 100 100.59 101.64 Share capital 100 100 100 Share premium 100 102.65 106.97 Non distributable reserve 100 100 100 Retained income 100 120.87 142.56 Share holders interest 100 108 108 Total liabilities and equity 100 120.71 142.59 Recommendation according to horizontal analysis: Though the investment decision cannot be taken only on comparison it can serve as one of the criteria. In case of two companies the profits and turnover had shown a trend of increasing. The total current assets of the Telford was not showing consistent trend when compared to Bell way Plc. The account payables in the 2006 were less for Telford and thus it maintained a increase trend in profit. But the decrease in account payables may show affect in the coming year and the increase trend may not be this much stronger. In contrast to Telford the Bell way was increasing the current assets along with account payables done and still maintaining the increasing trend of profit. This tells us about the good marketing, payment, asset increasing and profit retaining strategies and according to comparison it is advisable to invest in Bell Way Vertical Analysis: According to vertical analysis the items in the income account were calculated as the percentage of turnover. This tells us about the healthy and unhealthy trends of profit making, the company is experiencing. 2003 2004 2005 Turnover 25334 41051 58,245 Assets 2.69 2.04 1.33 Stock 75.83 59.55 49.06 Account receivables 71.65 62.20 68.76 Over draft Bank Balance &cash 0.94 2.07 6.98 Total current assets 150.79 123.01 43.26 Total fixed assets 53.11 123.01 43.26 Total assets 150.79 52.96 43.40 Account payables 100.37 72.89 0.14 Retained income 11.74 15.70 6.65 Total liabilities and equity 52.66 50.92 43.26 Common size table for Bell way Plc for vertical analysis 2003 2004 2005 Turnover 954.2 1092.571 1178.063 Assets 1.70 1.52 1.50 Stock .90 93.89 105.80 Bank Balance and cash 9.25 10.98 5.64 Total current assets 74.44 76.8 87.93 Total fixed assets 76.31 78.32 89.43 Total assets 76.31 78.32 89.43 Retained income 9.89 10.43 9,82 Share holders for dividend 2.54 2.73 3.15 Total liabilities 28.23 30.83 27.8 Equity 1.46 1.26 1.2 Share Capital 2.1 1.83 1.7 Share premium 10.67 9.56 9.24 Non distributable reserve 0.1.6 0.14 0.13 Retained income 58.53 61.78 67.58 Share holders interest 0.061 0.066 0.066 Total liabilities and equity 58.52 61.69 67.58 In vertical analysis it can be observed that the bank balance, current assets were not following a healthy trend in case of Telford Plc. The liquidation of assets was maintained as cash in telford. Whereas in the case of Bell way not only they are able to maintain reasonable bank balance and healthy and consistent growth in assets along with increase of turnover with a fixed capital which is a measure of good marketing along with paybacks and payments. Even in the case of liabilities also the Bell way is showing lesser liabilities for regular increase of turnover, but it was not that in case of Telford. Though one should seek explanation for holding of assets in the case of Bell way the liquidation of assets in case of Telford did not show any remarkable increase in turnover or profit. Holding of assets more than a limitation is not a good practice but one should observe it was not affecting the profits and turnover of Bell way. Ratio analysis: Along with the above analyses the indicators of past performance in terms of critical success factors were taken and observed for investment. Using liquidity ratios let us measure the capacity of the above two companies in meeting the short term financial needs. Current Ratio: It is taken that the capacity of the company meeting its financial requirements will be healthy if C.R is 2. Current Ratio = Current assets /Current liabilities. =72695/48191 =1.51 for Telford at the end of 2005 is < 2, which is taken as safe for meeting the short term financial liabilities. It is 38,201 /(25,427) = 1.5 in 2003 and 50,825 /(29,921) =1.7. It is clear that if any sudden financial requirement comes in the way the Telford cannot manage efficiently. Current Ratio = 1363.3/327.5 = 4.16 at the end of 2005 for Bell Way, which implies that the company is able meet successfully short time financial needs very much efficiently. 979.7 / (269.3) = 3.64 in 2003 and 1,175.9 / (336.8) =3.49 at the end of 2004. So the company was being able to meet it short tem financial requirements efficiently since last three years. Asset Management/Activity Ratios When a business does not use its assets properly investors find it to take money to a safer place. High turnover is needed to use its assets effectively. Unless the business continues to generate high turnover, assets will be idle as it is impossible to buy and sell fixed assets continuously as turnover changes. Using Activity ratios there is a need to assess how active various assets are in the business in case of Telford and Bell way. Increased turnover can be just as dangerous as reduced turnover if the business does not have the working capital to support the turnover increase. As turnover increases more working capital and cash is required and if not, overtrading occurs. Average Collection Period The average collection period measures the quality of debtors since it indicates the speed of their collection. This is measured with: short average collection period, as long collection period tells us about the bad quality of debtors. Even too low collection period also is not advisable as it effects the profit making and turnover of company due to restricted credit policy. Average collection period = Accounts receivable/annual credit sales x 365 days. For Telford 22/18152 x365= 0.44 for 2003, 47/25533 x365 =0.67 for 2004, 79/40052 x365 =0.72 for 2005. This implies the collection period of the company was too low in 2003 that can affect sales and profit but it was gradually increasing to a reasonable level as even too low collection period also affects sales negatively and profits adversely. For Bell way 1427/470935 x365 = 1.09 for 2003, 1361/587635 x365 = 0.85 for 2004, 2267/690078 x365 = 1.19 for 2005. This shows that the collection period for Telford was too low and it was some better in case of Bell Way. Actually in other businesses the too low collection period effects sales profit negatively. In that sense the Bell way was in a better position than the Telford with reasonable collection period. Inventory Turnover This ratio measures the stock in relation to turnover in order to determine how often the stock turns over in the business. It indicates the efficiency of the firm in selling its product. It is calculated by dividing he cost of goods sold by the average inventory. Inventory turnover = Cost of Sales /Average inventory = (18,449) / 19810= 0.93 in 2003, It is (30,674) / 24444= 1.25 in 2004, and it is 44947/29576 = 1.52 in 2005 for Telford. Stock Period = Average Stock /Sales of COGS x 365 days = 1.08x365=394.20, o.8x365=292 in 2004 and 0.66 x 365 -248.90in 2005 for Telford. The ratio shows a relatively low stock turnover. The company did not turn the stock every in 2003, it turned over the stocks in 292 days in 2004 and in 248 days in 2005. For Bell Way 857,984 739.479 x365 = 313.90 in 2003, 829598/1025764 x365 = 295.20 in 2004, 897661/1246433 x365 = 262.8 in 2005 Here also the ratio shows low stock turnover but it is better than that of telford. As both were construction companies and cannot move goods daily, the comparison of frequency of moving goods (sales) was considered. This ratio is almost equal and close comparison for both the companies they cannot be differentiated on this basis. Total Assets Turnover Asset turnover is the relationship between sales and assets The firm should manage its assets efficiently to maximise sales. The total asset turnover indicates the efficiency with which the firm uses all its assets to generate sales. It is calculated by dividing the firm's sales by its total assets. Total Asset Turnover = Sales /total assets For Telford 25334/13455 = 1,88 in 2003, 41051/21742 =1.89 in 2004 58245/25279 =2.3 in 2005 For Bell Way 954197/726844= 1.31 in 2003 1092571/855737 =1.28 in 2004, 1178063/1053591= 1.12 in 2005 The above values imply that Telford is at its best in utilising the assets to increase its turnover than Bell way. The capacity of Telford in utilising the assets to enhance turnover increased in last three years, but that of bell way decreased. Fixed Asset Turnover The fixed assets turnover ratio measures the efficiency with which the firm has been using its fixed assets to generate sales. It is calculated by dividing the firm's sales by its net fixed assets as follows: Fixed asset turnover = Sales /net fixed assets For Telford 25334/681 = 37.2 in 2003 41051/838 =48.9in 2004 58245/775= 75.15 in 2005 For Bell Way 954197/16200= 58.90 in 2003 1092571/16673=65.53 in 2004, 1178063/17767=66.31 in 2005 The above values indicate that except in 2005 Bell way was efficient in using its fixed assets. As both were construction companies using of fixed assets to generate turnover can be termed as efficient business management. Equity Ratio The equity ratio is calculated as Equity ratio = Ordinary shareholder's interest/ total assets For Telford 7850/13455 = 0.58 in 2003, 12310/21742=0.57 in 2004, 12309/25279=0.49in 2005. If these values are multiplied by 100 we get percentage of total assets supplied by ordinary stock holders. It is 58% in 2003, 57% in 2004 and 49% in 2005. For Bell Way 101791/482327=0.21 in 2003, 104492/590246=0.18 in 2004, 108886/697649=0.16 in 2005 The percentages are 21%, 18% and 16% respectively in the years of 2003, 04, 05. This tells us that Bell way is paying more on debt interest and Telford is getting capital from share holders, which indicates the trust of investors on the company. This tells us that Telford has strong financial structure than Bell way though it was newer than the later. Gross Profit Margin Normally the gross profit has to rise proportionately with sales. It can also be useful to compare the gross profit margin across similar businesses although there will often be good reasons for any disparity. Gross profit Margin = Sales-cost of sales /Sales For Telford 25,334 -18449 /25334 = 0.27 in 2003, 41,051-(30,674) /41051 =0.25 in 2004, 58,245- (44,947) /58245 = 0.23 in 2005. The decrease in ratio from 2003 to 2005 tells us that rate in increase in cost of goods is more than the rate of increase in sales, hence the decreased efficiency. For Bell way 954,197- 739,479 /954197 = 0.23 in 2003, 1,092,571 - (829,598)/1092571 =0.24 in 2004, 1,178,063 -897,661/1178063 =0.24 in 2005. Observing this trend we can observe that the efficiency of Bell way in sales is slightly better than that of Telford. Net Profit Margin This is a widely used measure of performance and is comparable across companies in similar industries. The important thing in any trend is the margin and whether it compares well with similar businesses. Net Profit Margin =After Tax Earnings/Sales For Telford 2990/25334 =0.12 in 2003, 4718/41051=0.11 in 2004, 5467/58245 =0.09 in 2005. This trend tells us about the decrease in net margin which denotes the decrease in profitability. For Bell way 169251/954197 =0.18 in 2003, 205530/1092571=0.19 in 2004, 210163/1178063 =0.19 in 2005. This trend tells us that the profitability increased slightly from 2003 to 2004 and was consistent in 2004 to 2005. This was better when compared with Telford. Hence the profitability of Bell way is better than that of Telford and it is a better place to invest as there will be no returns without profits. Debt analysis The debt analysis of a company is done by its debt ratio and debt to equity ratio. This is the measure of the capital funded by debt. The ratio is calculated by total debt /total assets. For Telford (25,427) / 13,455 = 1.89 in 2003, (29,921) / 21,742= 1.38 in 2004, (48,191) / 25,279 =1.91 For Bell way (16,276) / 482,327 =0.03 in 2003, (18,515) / 590,246 = 0.03 in 2004, 21602/697649=0.03 With higher debt ratio, the company would find it relatively difficult to raise additional financial support from external sources if it needed. The higher the debt ratio the more difficult it becomes for the firm to raise debt. Though for both the companies the ratio was less but Bell Way will be more efficient in raising credit if needed, in that sense gaining the investors' trust. Debt to Equity ratio This ratio indicates the extent to which debt is covered by shareholders' funds. It reflects the relative position of the equity holders and the lenders and indicates the company's policy on the mix of capital funds. The debt to equity ratio is calculated as Debt to equity ratio = Total debt / Total equity. For Telford, 25427/10000 =2.54 in 2003, 29921/10000=2.99 in 2004, 48191/10000 =4.82 The above results tell us that the debt on each pound of the equity of the company was 2.54 in 2003 and it increased to 4.82 in 2005. This denotes the financial weakness of the company. The overall measure of success of a business is the profitability which results from the effective use of its resources. For Bell Way 438/20000 =0.02 for 2003, 587/20000=0.03 for 2004, 216/20000= 0.01 for the year 2005 When the above values of the two companies were compared it is clear that Bell way is having less credit per each pound of equity. This means the financial structure of Bell way was stronger than that of Telford. Capital appreciation The Capital of a company can be appreciated with its increase in market price, enhancement in profitability and more earnings per share. The profitability of the Bell way is slightly more than that of Telford and the earnings of share in Bell way is 3 to 5 times more than that of Telford in between 2003 to 2005. The profitability and appreciation of Bell way is more than that of Telford. It is advisable to invest in Bell way as from horizontal analysis to debt analysis and in the case of earnings per share, the bell way was more efficient in managing the business and giving returns to investors. In every analysis the Bell way showed good business management and enhancement of profit resulting in Capital appreciation. In the wake of sudden need of cash, when unforeseen circumstances arise, Bell way was able to mobilise cash as its credit rating was more. So though Telford was a growing company Bell way was more immune to sudden changes, if any, take place. Conclusion: The two companies were analysed on the basis of comparison, vertical analysis, ratio analysis (including profitability and margin), and debt analysis. In each analysis Bell way was clearly showing its efficiency and earned more money to its investors as its earnings per share is more than that of Telford. The credit rating and profitability was more for Bell way than that of Telford. The factors that influence the returns are the profitability, credit rating, managing the assets to increase turnover and earnings per share. In each of the aforesaid cases Bell way is a head of its competitor (in this article) Telford. Hence it is advisable to invest in Bell way if an investor was interested in investing in construction business. The various values taken for analysis of the companies were obtained from http://www.telfordhomes.plc.uk/05/corporate_results.cfm http://www.bellway.co.uk/investorinformation.htm References: The references were given in the order of Name/s of author/, date of publication, title of publication, publisher/organisation, edition, type of medium, date of item retrieved, name or site address on internet. 1. cbdd team, 2006, horizontal and vertical analysis course, cbdd, electronic, 13-07-07, cbdd.wsu.edu/kewlcontent/cdoutput/TR505r/page37.htm 2. Schaum, 2006, Financial analysis, Mc graw hill, electronic, 13-07-06, http://books.google.co.in/booksid=_lnmxnhoAUEC&pg=PA68&lpg=PA21&ots=3O4aP7LMV7&dq=vertical+analysis&sig=e0LpmpFi5Iu02rCf5Y4UjtzBuKY 3. biz-ed team, 2006, Ratio analysis, Biz-ed, electronic, 13-07-06, http://www.bized.ac.uk/compfact/ratios/ror1.htm 4. biz-ed team, 2006, Ratio analysis profit, Biz-ed, electronic, 13-07-06, http://www.bized.ac.uk/compfact/ratios/profit1.htm 5. Trans union team, 2006, debt analysis, trans union, electronic, 13-07-06, http://annualcreditreport.transunion.com/popup/debtAnalysis.jsp 6. Scott trade team, 2006, capital appreciation, Scottrade, electronic, 13-07-06, http://www.investorwords.com/695/capital_appreciation.html 7. cbdd team, 2006, vertical analysis, cbdd, electronic, 13-07-06, cbdd.wsu.edu/kewlcontent/cdoutput/TR505r/page38.htm 8. Annual reports and accounts of telford homes plc. 9. Annual reports and accounts of Bellway Plc. Read More
Cite this document
  • APA
  • MLA
  • CHICAGO
(“Managerial Accounting and Business Analysis Essay”, n.d.)
Managerial Accounting and Business Analysis Essay. Retrieved from https://studentshare.org/miscellaneous/1513806-managerial-accounting-and-business-analysis
(Managerial Accounting and Business Analysis Essay)
Managerial Accounting and Business Analysis Essay. https://studentshare.org/miscellaneous/1513806-managerial-accounting-and-business-analysis.
“Managerial Accounting and Business Analysis Essay”, n.d. https://studentshare.org/miscellaneous/1513806-managerial-accounting-and-business-analysis.
  • Cited: 0 times

CHECK THESE SAMPLES OF Managerial Accounting and Business

Managerial Accounting

Part 2 There are two types of accounting information: financial accounting and management accounting.... Business ethics is an important component of managerial accounting as illustrated in downfall of companies like Enron (Higgins, 2007).... By providing the required financial information, the internal accounting system enables the management to monitor the business performance.... The internal accounting system can be characterized as a performance management system which enables the management to maximize business efficiency by monitoring the different operational processes....
3 Pages (750 words) Essay

Principles of Managerial Finance and Business Accounting

The paper "Principles of Managerial Finance and business Accounting" presents the balance sheet of Savannah Enterprise that is composed of several major accounts (Noreen, 2008).... The assets include the resources that are owned by the business (Gibson, 2006).... nder the going concern concept of accounting, the business is assumed to continue operating until five, ten, or even more years.... Thus, the business is assumed not to close shop or file for bankruptcy in the next several years....
5 Pages (1250 words) Assignment

Managerial Accounting Practices

Just-In-Time represents a new paradigm of business strategy shifting from traditional inventory management to web-based supply chain management that increases inventory turnover and reduces inventory holding.... you did not think it fit and proper to examine the financial statements prepared by the external accounting department discloses your dissatisfaction with the present state of affairs within the Company, and mostly with the present inventory and accounting system....
5 Pages (1250 words) Essay

Week 5 discussion Questions

he two business majors that have greatest utilize and maximum value for a corporation is Managerial Accounting and Business research.... managerial accounting can help managers determine the cost structure of the company in a precise manner.... Statistics are also very useful DDQ1 The business administration function that give me the biggest problems academically are statistics and economics.... business research can be used in different ways to add value to a corporation....
3 Pages (750 words) Essay

MANAGERIAL FINANCE AND ACCOUNTING

managerial accounting is more about monitoring financial performance, conducting variance analysis, following through with revised targets.... inancial Accounting is solely based on the past performance of the company, while managerial accounting focuses on the current predicaments and the possible future outcomes based on the previous performance of the company.... This report encompasses the differences in accounting responsibilities of a Financial Accountant compared to a Management Accountant, and validates the need for an additional resource in the firm....
5 Pages (1250 words) Essay

The Changing Role of Management Accountants

This essay will analyze the changing role of management accountants in modern day businesses by looking at the The essay will also look at the role played by management accountants today and assess whether this is relevant to modern day business requirements.... hanges in the traditional role of management accountants has been necessitated by developments within the business environment such as changes in consumer preferences, technological changes, socio-economic changes and volatile political environment....
9 Pages (2250 words) Essay

Current event business articles relative to managerial accounting

The managerial accounting problem stated in the article is the reduced profit and shrinking market share due to its declining ratings. ... The changing technology such Teacher Current event business article related to managerial accounting: Viacom: The autumn of Summer Link: http www.... The managerial accounting problem stated in the article is the reduced profit and shrinking market share due to its declining ratings.... Conclusion To save the company, Viacom employs the traditional managerial accounting remedy to stop the company from “financially bleeding”....
1 Pages (250 words) Essay

Investment Decision - Managerial Accounting and Business Analysis

This paper "Investment Decision - Managerial Accounting and Business Analysis" provides an insight into the financial position and performance of two companies Whittard of Chelsea plc and Greggs plc, both from the same industry, in order to evaluate these companies' future potential for investment.... Both the companies observed in the paper are from the food and manufacturing industry and their business operations cover the entire boundaries of the United Kingdom....
11 Pages (2750 words) Case Study
sponsored ads
We use cookies to create the best experience for you. Keep on browsing if you are OK with that, or find out how to manage cookies.
Contact Us