StudentShare
Contact Us
Sign In / Sign Up for FREE
Search
Go to advanced search...
Free

Analyzing Cross-sectional Data and Correlation and Regression - Essay Example

Cite this document
Summary
This report describes the results of a research done on our members regarding the quality of services we offer on both full members and weekend members; it was aimed at exposing the level of our customer satisfaction regarding our services and equipment use…
Download full paper File format: .doc, available for editing
GRAB THE BEST PAPER91.1% of users find it useful
Analyzing Cross-sectional Data and Correlation and Regression
Read Text Preview

Extract of sample "Analyzing Cross-sectional Data and Correlation and Regression"

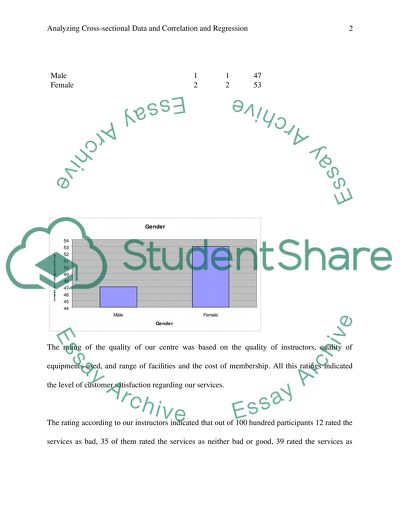
Analyzing Cross-sectional Data and Correlation and Regression Part one Analyzing cross sectional data This report describes the results of a research done on our members regarding the quality of services we offer on both full members and weekend members; it was aimed at exposing the level of our customer satisfaction regarding our services and equipment use. There were 100 participants and this number included 55 full members and 45 weekend members, 47 of them were male and 53 were female. Full membership 55 Weekend only membership 45 Male 1 1 47 Female 2 2 53 The rating of the quality of our centre was based on the quality of instructors, quality of equipments used, and range of facilities and the cost of membership. All this ratings indicated the level of customer satisfaction regarding our services. The rating according to our instructors indicated that out of 100 hundred participants 12 rated the services as bad, 35 of them rated the services as neither bad or good, 39 rated the services as good and only 14 of them rated our services as very good, the majority therefore rated our services good. This can be graphically represented as follows quality of instructors Frequency Very bad 0 Bad 12 Neither bad nor good 35 Good 39 Very Good 14 As graphically shown the mode is good, the graph is negatively skewed or skewed to the left meaning that the majority of the outcomes or observations are on the left of the graph, another notable observation is that none of the participants rated our instructors as very bad. The mean of this observation was 3.55 and the standard error was 0.88048 and therefore the variance is 0.29673, therefore our confidence interval at 95% can be calculated as follows, P(X - T Sx X + T Sx) = 95% Where X is the sample mean, T is the value of 5% on the T table and Sx is the standard error of the mean. The T value from the t table is 0.172572 P(3.55- 0.172572 (0.88048) 3.55+ 0.172572 (0.88048) = 95% Therefore we get the confidence interval as P ( (-3.398) (3.702) )= 95% Our services were also rated through the quality of equipments used, out of 100 participants 6 of them rated the quality of equipments as very bad, 25 of them rated the equipments as bad, 33 of them rated the equipments as neither bad nor good, 27 of them rated the equipments as good and only 9 rated the equipments as very good. Therefore the mode or the majority of the participants did not rate our services as bad or good regarding the quality of equipments, the mean of this observation was 3.08 and the standard error was 0.106059, the median and the mode were both 3, the results can be graphically represented as follows: quality of any equipment used Frequency Very bad 6 Bad 25 Neither bad nor good 33 Good 27 Very Good 9 0 We can construct a 95% confidence interval as follows P(X - T Sx X + T Sx) = 95% P ((3.08 - 0.172572 (0.106059)) (3.08 + 0.172572(0.106059)) = 95% P ((3.0617) (3.183)) = 95% According to the participants our services were also rated according to the range of facilities available, out of 100 participants only one rated the range of facilities available as very bad, 6 rated the facilities as bad, 20 as neither good or bad and 38 rated the facilities as good, the rest rated them as very good. Therefore according to the rating of the range of facilities we offer, 73 participants rated them as good or very good. This is graphically shown below: The range of facilities available Frequency Very bad 1 Bad 6 Neither bad nor good 20 Good 38 Very Good 35 The mean was 4 and this shows that the average rated the range of equipments available as good; the mode was 4 which indicate that the majority of the participants rated the equipments as good. In the case where the mode, the median and mean are equal, the distribution assumes an asymmetric or bell shape where both deviations from the mean are identical, the negative value of skew ness indicates that the distribution is skewed to the left, the standard error of this observation was 0.094281 and therefore we can construct a 95% confidence interval as follows: P(X - T Sx X + T Sx) = 95% P ((4 - 0.172572 (0.094281)) (4 + 0.172572(0.094281)) = 95% P ((3.9837) (4.0163)) = 95% The ratings of the cost of membership indicate that most people rate the costing as bad and only a few people rate the cost of membership as very good, only 3 out of 100 rate the cost of membership as very good, 16 as good, 21 of them rate the cost of membership as neither good or bad, 37 as bad and 23 of them rated the cost of membership as very bad. However the mode rating was the bad rating, therefore the majority rated the cost of membership as bad, the mean rating or the average rating was 2.39 meaning that the mean was the bad rating. Positive skew ness in this distribution shows that the distribution is skewed to the right. This is graphically shown below; The Costs of Membership Frequency Very bad 23 Bad 37 Neither bad nor good 21 Good 16 Very Good 3 The mean of this observation was 2.39, the median and the mode were 2 and the standard error was 0.11, the graph is skewed to the right, therefore we can construct a 95% confidence interval as follows: P(X - T Sx X + T Sx) = 95% P ((2.39 - 0.172572 (0.11)) (2.39+ 0.172572(0.11)) = 95% P ((2.371) (2.409)) = 95% From the above results however it is evident that we have a wide range of equipments and that most of our members are female, most of our members are full members, however there is need to improve on the services rendered by our instructors because most of the participants rated their services to be of low quality, we need also to improve on the quality of equipments used although the distribution of the observation across the ratings assumed a normal distribution or a bell shaped distribution. Another observation made is that the overall rating of our centre indicate that the majority rated it as good and that the most used facility is the dance studio, the least used facility is sauna. Most of our members are aged between 20 to 30 years was also indicated in the outcome, finally out of 1000 participants 53 of them would recommend our centre to friends and members of the family while only 47 would not recommend our centre. Overall rating of the leisure Centre Frequency Very bad 0 Bad 16 Neither bad nor good 40 Good 40 Very Good 4 facility used most often Code Bin Frequency Fitness Centre (machines) 1 1 27 Dance studio (Pilates, yoga, dance) 2 2 32 Swimming Pool 3 3 28 Games Room (Football, badminton etc 4 4 8 Sauna 5 5 5 Those who would recommend the centre to friends or family Frequency yes 53 No 47 Part two Correlation and regression We will investigate the increase of unemployment over time using the data available; we will use Denmark to analyze the increasing unemployment rate over time in years, therefore time in years is the independent variable and the unemployment rate is the dependent variable. rate of unemployment in Denmark from the year 1970 to 1994 year Denmark 1970 0.6 1971 0.9 1972 0.8 1973 0.7 1974 2.8 1975 3.9 1976 5.1 1977 5.9 1978 6.7 1979 4.8 1980 5.2 1981 8.3 1982 8.9 1983 9 1984 8.5 1985 7.1 1986 5.4 1987 5.4 1988 6.1 1989 7.4 1990 7.7 1991 8.4 1992 9.2 1993 10.1 1994 8.2 Scatter diagram Correlation coefficient(r) It is the measure of the degree of the relationship between two or more variables, in our case we will determine our correlation coefficient using the absolute deviation method where1 n X Y - X Y r = ______________________________ (nX2 - ( X)2) ( nY2 - (Y)2)1/2 X Y XY X2 Y2 year Denmark 1 1970 0.6 0.6 1 0.36 2 1971 0.9 1.8 4 0.81 3 1972 0.8 2.4 9 0.64 4 1973 0.7 2.8 16 0.49 5 1974 2.8 14 25 7.84 6 1975 3.9 23.4 36 15.21 7 1976 5.1 35.7 49 26.01 8 1977 5.9 47.2 64 34.81 9 1978 6.7 60.3 81 44.89 10 1979 4.8 48 100 23.04 11 1980 5.2 57.2 121 27.04 12 1981 8.3 99.6 144 68.89 13 1982 8.9 115.7 169 79.21 14 1983 9 126 196 81 15 1984 8.5 127.5 225 72.25 16 1985 7.1 113.6 256 50.41 17 1986 5.4 91.8 289 29.16 18 1987 5.4 97.2 324 29.16 19 1988 6.1 115.9 361 37.21 20 1989 7.4 148 400 54.76 21 1990 7.7 161.7 441 59.29 22 1991 8.4 184.8 484 70.56 23 1992 9.2 211.6 529 84.64 24 1993 10.1 242.4 576 102.01 25 1994 8.2 205 625 67.24 325 147.1 2334.2 5525 1066.93 Therefore our correlation coefficient (r) is 0.01162 Regression line We use the classical estimation model which states that when Y= + x, then we estimate the model as = Y- x, and 2 = n x y - x y ______________ n x2 - ( x) 2 3Therefore in our case = 0.3245 And = -0.498 Our model therefore will be stated as Y = - 0.498 + 0.3245 X The autonomous level of unemployment is - 0.498 and the model still states that an increase in one unit of time (year) will increase the level of unemployment by 0.3245 units. Over time there has been a rise in the level of unemployment despite the high economic growth in developed countries, the data on Denmark's unemployment rate trend shows that there has been an increase the rate of unemployment over the years, the rising unemployment rate is matter of concern to all economies in the world and that's why there has been an increase in efforts to reduce unemployment rates by the use of policies to bring unemployment down and also the level of inflation. The model we have specified as Y = - 0.498 + 0.3245 X where Y is the level of unemployment and X is time in years, therefore the autonomous level of unemployment is - 0.498 and the model still states that an increase in one unit of time (year) will increase the level of unemployment by 0.3245 units, the model also shows that there is an increase in the level of unemployment overtime, however the autonomous level of unemployment is less than zero and this would show that there has been efforts to reduce the unemployment levels. The correlation coefficient for the two variables is 0.01162; the value shows a positive relationship between the two variables, however regarding the strength of the relationship we could say that there do not exist a strong relationship between the two variables, this could be because we have omitted other important variables that will determine the level of unemployment example price levels or inflation, the level of national income and government policies. References P. Schmidt (1976) Econometrics, Marcel Decker publishers, USA Sergio J. Ray (1956) Advances in Spatial Econometrics: methodology, tools and applications, Springer publishers, USA Wooldridge J. (2002) Econometric Analysis of Cross -section and Panel Data, MIT Press, US Read More
Cite this document
  • APA
  • MLA
  • CHICAGO
(“Analyzing Cross-sectional Data and Correlation and Regression Essay”, n.d.)
Analyzing Cross-sectional Data and Correlation and Regression Essay. Retrieved from https://studentshare.org/miscellaneous/1513801-analyzing-cross-sectional-data-and-correlation-and-regression
(Analyzing Cross-Sectional Data and Correlation and Regression Essay)
Analyzing Cross-Sectional Data and Correlation and Regression Essay. https://studentshare.org/miscellaneous/1513801-analyzing-cross-sectional-data-and-correlation-and-regression.
“Analyzing Cross-Sectional Data and Correlation and Regression Essay”, n.d. https://studentshare.org/miscellaneous/1513801-analyzing-cross-sectional-data-and-correlation-and-regression.
  • Cited: 0 times

CHECK THESE SAMPLES OF Analyzing Cross-sectional Data and Correlation and Regression

The World Bank Organisation About the Gross National Income

Part 2 correlation and regression: Data was collected by the Office for National Statistics on the number of visitors(000's) to London who were here for a holiday and the amount of money they spent (?... Part 1: Analysing cross-sectional data Data was collected by the World Bank Organisation about the Gross National Income, expressed in purchasing power parity dollars to adjust for price level differences across countries.... The data is not adjusted for inflation....
5 Pages (1250 words) Essay

Global Utilization of Social Networks

Research Approach Saunders, Lewis & Thornhil (2007 & 2009) pointed out that researchers should select any one of the research approach from available approaches such as, 1- correlation Study- understanding the relationship between variables is the key aim in such kind of studies and 2- Causal Study- finding out the reasons behind the variation in the behaviour of variables is the key reason behind such kind of research approach.... As the researcher is trying to understand the role of social networking websites such as Facebook and twitter on increasing effectiveness of Internet marketing tool for companies hence the researcher will use correlation approach to find out what is the relationship between effectiveness of Internet marketing tool and social networking website penetration....
14 Pages (3500 words) Term Paper

The Impact of Trends in General Market and Macroeconomic Factors

hellip; The cross-section of stock returns reflects a premium for downside risk and it is specifically, those stocks that covary strongly with the market when the market declines that have high average returns. While examining the historical financial data for publicly traded securities issued by Real Estate Investment Trusts (REIT), the inquiry isolates certain quantifiable firm specific financial data and organizes the data into pooled, time-series cross-sections.... Most of these studies have utilised the cross-sectional difference of REIT financial conditions and REIT management structure in estimating the relationship between these variables and risk....
26 Pages (6500 words) Essay

Empirical Techniques in Econometrics

These problems are generally faced due to the subsequent revisions in the reference data and the incorrect data estimation or incorrect measurement of data.... Earlier it was a general practice to estimate nonstationary process equations in macroeconomic models by the simple linear regression.... live Granger (1981) proposed a solution to the time series by a simple regression equation: (1)where, = dependent variable = single exogenous regressor = white noiseTo stress the solution, Granger defined the degree of integaration of the variable....
10 Pages (2500 words) Essay

Are New and Old EU Members Becoming More Financially Integrated A Threshold Cointegration Analysis

The main limitation with this approach is that if data on financial instruments with similar characteristics are not available, then the interpretation of results based on the price or approach can be problematic.... Many different authors have tried to examine the process of financial integration1 in the European Countries ever since the European Monetary system has commenced....
11 Pages (2750 words) Essay

Children With Cerebral Palsy and Genetic Disorder

This paper will explore some studies regarding children with cerebral palsy and genetic disorder under the following divisions: type of study; location setting; variables framework; theory; study design; sample; data sources; procedures; data analysis; results/findings; recommendations.... The author has rightly presented that through the comparative approach, they can determine these differences and similarities and make deductions from the data....
9 Pages (2250 words) Assignment

Epidemly and biostat

== The SECOND SECTION includes questions related to analyzing, and interpreting data, and summarizing the findings and its impact on nursing practice (FIVE QUESTIONS=19 POINTS).... Download and use the file Q1.... Which of the following best describes the design where subjects are… (Choose one best answer and provide rationale)....
5 Pages (1250 words) Assignment

Juvenile Justice System in the USA

The study “Juvenile Justice System in the USA” focuses on resistant and persistent offenders, their characteristics, type of antisocial behavior, the degree of different kind of behaviors offenders show, and whether the behavior is related to social development.... hellip; The author evaluates the best rehabilitation and therapeutic methods that we can employ to help the juvenile criminals successfully rejoin the society without repeating the criminal acts....
11 Pages (2750 words) Essay
sponsored ads
We use cookies to create the best experience for you. Keep on browsing if you are OK with that, or find out how to manage cookies.
Contact Us