StudentShare
Contact Us
Sign In / Sign Up for FREE
Search
Go to advanced search...
Free

Hypothesis Tests for Means and Proportions - Research Paper Example

Cite this document
Summary
The test we will conduct will be one tail test (left tail test). Left tail test means that we are we have the condition of the population mean less than 12 ounces as our alternative hypothesis, whereas, the null hypothesis would be testing the weight of each bag of chips being either equal to or greater than 12 ounces…
Download full paper File format: .doc, available for editing
GRAB THE BEST PAPER95.1% of users find it useful
Hypothesis Tests for Means and Proportions
Read Text Preview

Extract of sample "Hypothesis Tests for Means and Proportions"

Assumption: Since the sample size is 30, According to Central Limit Theorem, the distribution of the sample mean tends to be normally distributed. We shall estimate the sample standard deviation in place of population standard deviation, in estimating the standard error.Type of Test:The test we will conduct will be one tail test (left tail test). Left tail test means that we are we have the condition of the population mean less than 12 ounces as our alternative hypothesis, whereas, the null hypothesis would be testing the weight of each bag of chips being either equal to or greater than 12 ounces.

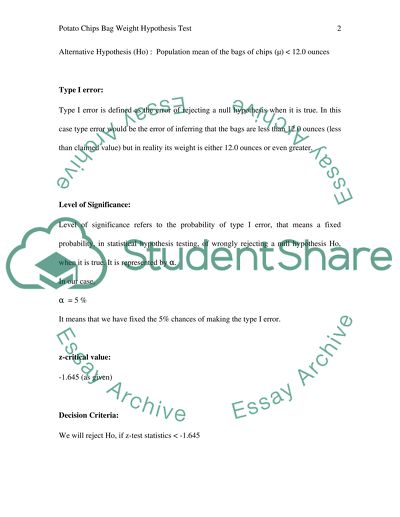
There is the one tail test because the condition of inequality will not be sufficient to reject the null hypothesis, which means that the null hypothesis will be rejected ONLY if the weight if the bag is less than 12. Thus, due to the condition of less than in alternative, it is one tail test, simple words; both inequalities (greater than and less than) do not support the idea to make complaint, rather only one inequality (less than) can fulfill the task.Mathematically, it can be stated as:Null Hypothesis (Ho) : Population mean of the bags of chips () 12.

0 ouncesAlternative Hypothesis (Ho) : Population mean of the bags of chips () < 12.0 ouncesType I error:Type I error is defined as the error of rejecting a null hypothesis when it is true. In this case type error would be the error of inferring that the bags are less than 12.0 ounces (less than claimed value) but in reality its weight is either 12.0 ounces or even greater. Level of Significance:Level of significance refers to the probability of type I error, that means a fixed probability, in statistical hypothesis testing, of wrongly rejecting a null hypothesis Ho, when it is true.

It is represented by .In our case, = 5 %It means that we have fixed the 5% chances of making the type I error.z-critical value:-1.645 (as given)Decision Criteria:We will reject Ho, if z-test statistics < -1.645z-test statistics: _z-test statistics = x - . n = 11.9 - 12 0.4 30 = -0.1/ (0.4 / 5.48) = -0.1/0.073 = -1.37Conclusion:At 5% level of significance, there is insufficient evidence to reject the null hypothesis. Thus we fail to reject the claim of the weight of potato chips being 12.

0 ounce or greater. Conclusions in terms of the business problem:As evident from the given problem, the investigator had a doubt that the claimed weight of the potato bags is greater than the actual weight. To verify the authenticity of this claim, he collected some 30 bags and found the mean of those bags, which came out to be 11.9 ounces. Although the mean weight came out to be lesser than the claimed one. But the real question or logic behind hypothesis testing is that we want to ascertain that whether it would be appropriate to consider the difference of 0.

1 ounces from observing 30 bags with the standard deviation of 0.4 a 'significant' one and infer this difference as on the entire population. Thus the above shown hypothesis test showed that how significant is the abovementioned difference, if we allow the 5% of the probability of type I error. The result of the test shows that the acquired value of z-test statistics is in the non-rejection region (above -1.645). Thus, we can say that the difference in weight found from the sample of 30 bags is not significant to infer the difference on the entire population (all bags).

Thus, it is not recommended to complaint for the lesser weight.ReferencesSpiegel, M., & Lindstrom, D. (2000). Statistics: Based on Schaum's Outline of Theory and Problems of Statistics by Murray R. Spiegel. Boston: McGraw Hill.

Read More
Cite this document
  • APA
  • MLA
  • CHICAGO
(“Hypothesis Tests for Means and Proportions Research Paper”, n.d.)
Hypothesis Tests for Means and Proportions Research Paper. Retrieved from https://studentshare.org/miscellaneous/1505863-hypothesis-tests-for-means-and-proportions
(Hypothesis Tests for Means and Proportions Research Paper)
Hypothesis Tests for Means and Proportions Research Paper. https://studentshare.org/miscellaneous/1505863-hypothesis-tests-for-means-and-proportions.
“Hypothesis Tests for Means and Proportions Research Paper”, n.d. https://studentshare.org/miscellaneous/1505863-hypothesis-tests-for-means-and-proportions.
  • Cited: 0 times

CHECK THESE SAMPLES OF Hypothesis Tests for Means and Proportions

M&M Project Report

The number of candies per bag and the color proportions will be established and analyzed using excel tools in part two.... Different claims of color proportions will be tested in the fourth part.... The population here means a collection of all the subjects that are to be studied – all the M&M candies for that matter....
4 Pages (1000 words) Research Paper

Binary Outcome Using Proportion

In this paper “Binary Outcome Using Proportion” confidence interval for a proportion, the sample size required for a proportion, confidence interval for the difference of two proportion, comparison of a proportion with hypothesized proportion, and comparison of two proportions will be discussed.... Using this estimate, a confidence interval for the difference of two population proportions, (π1− π2), is given by For normal sampling distribution, the test statistic for the hypothesis test will be z score....
3 Pages (750 words) Assignment

Homework: Week 6, Chapter 6

This paper seeks to explore a case study and to reflect the topic “test of hypothesis”. Given that a… porter considered a random sample of 725 votes from a population of 12,457 and recorded 338 votes in favor of an issue on the ballot, the 95 % confidence interval is the set of proportions in the range of 0.... Case Study95 % Confidence IntervalGiven that a reporter considered a random sample of 725 votes from a population of 12,457 and recorded 338 votes in favor of an issue on the ballot, the 95 % confidence interval is the set of proportions in the range of 0....
2 Pages (500 words) Essay

Analysis Tools Unit 5 IP

a) What is the difference in proportions in the original data?... a) The difference in proportions is -0.... Conduct a randomization test for two means with 3000 randomizations.... Explain in the context of the problem what the p-value means.... Which of the following p-values would provide more evidence in support of the alternate hypothesis and against the null hypothesis?... Most cases the null hypothesis is rejected when it is less than the alpha significance level (....
2 Pages (500 words) Research Paper

Original Cost of the Product

he selected test is Two Independent proportions z-Test.... he two proportions are So, The standard error of the difference is The test statistic is The value of test statistic, z = -2.... 45, thus reject null hypothesis H0.... 60, thus reject null hypothesis H0.... 60, thus reject null hypothesis H0....
2 Pages (500 words) Coursework

Application of Statistical Tools

In this assignment "Application of Statistical Tools", there are cases considered which shows the application of there statistical tools such as the Normal Distribution, t-Distribution, and Test on Two proportions.... The statistical tool, Test on Two proportions is done to verify whether there is a direct relationship between poverty and prostitution.... Since the alternative hypothesis has a symbol of < (less than), this entails that this is the case of a one-tailed test....
6 Pages (1500 words) Assignment

Introduction to Statistics Exam

he null and alternate hypotheses are:H0 : p1 = p2 (There is no significant difference in the proportions of men and women).... 1  : p1 = p2 (There is a significant difference in the proportions of men and women).... onclusion: There is insufficient evidence that there is a significant difference in the proportions of men and women who rate slot machines as their favorite game.... Thus, At the 1% significant level, it cannot be concluded there is a statistically significant difference in the proportions of men and women who rate slot machines as their favorite game....
6 Pages (1500 words) Assignment

From the Survey to Hypothesis in Establishing Cafeteria on Campus

The paper "From the Survey to hypothesis in Establishing Cafeteria on Campus" focuses on the opinion of the students towards coming up with a cafeteria on the campus (Thomashow 2014, p.... 8).... It also answers the questions of the kind of foodstuffs that need to be sold by the cafeteria....
9 Pages (2250 words) Research Paper
sponsored ads
We use cookies to create the best experience for you. Keep on browsing if you are OK with that, or find out how to manage cookies.
Contact Us