StudentShare
Contact Us
Sign In / Sign Up for FREE
Search
Go to advanced search...
Free

Measures of Dispersion - Speech or Presentation Example

Cite this document
Summary
The mean weight of the patients was 80 kg. For this group, the standard deviation (SD) was calculated to be 5 kg. 
f) Based on scenario described above, draw a normal distribution shaped…
Download full paper File format: .doc, available for editing
GRAB THE BEST PAPER92.8% of users find it useful
Measures of Dispersion
Read Text Preview

Extract of sample "Measures of Dispersion"

Measure of Dispersion  Question Source: Harris & Taylor 2009]  Scenario: A group of patients enrolling for a trial had a normal distribution for weight. The mean weight of the patients was 80 kg. For this group, the standard deviation (SD) was calculated to be 5 kg. a) Calculate the value for 1 SD below the mean weight of 80 kg. Mean – 1(SD) = 80 – 5 = 75 kgb) Calculate the value for 1 SD above the mean weight of 80 kg.Mean + 1(SD) = 80 + 5 = 85 kgc) Since 68.2% of the subjects will be included in ±1 SD, state the weight range for 68.

2% of the patients.The weight range for 68.2% of the patients is between 75 kg and 85 kg.d) Calculate the weight range for 95.4% of the patients (i.e. ±2 SD).Mean – 2(SD) = 80 – 2(5) = 80 – 10 = 70 kgMean + 2(SD) = 80 + 2(5) = 80 + 10 = 90 kgThe weight range for 95.4% of the patients is between 70 kg and 90 kg.e) Calculate the weight range for 99.7% of the patients (i.e. ±3 SD).Mean – 3(SD) = 80 – 3(5) = 80 – 15 = 65 kgMean + 3(SD) = 80 + 3(5) = 80 + 15 = 95 kgThe weight range for 99.

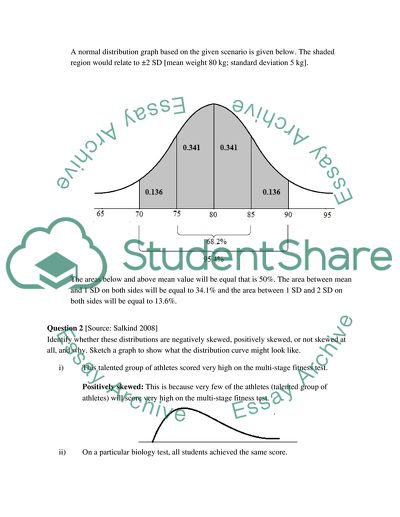
7% of the patients is between 65 kg and 95 kg.f) Based on scenario described above, draw a normal distribution shaped graph, and illustrate the region, which would relate to ±2 SD [mean weight 80 kg; standard deviation 5 kg]. Explain your graph. A normal distribution graph based on the given scenario is given below. The shaded region would relate to ±2 SD [mean weight 80 kg; standard deviation 5 kg].The areas below and above mean value will be equal that is 50%. The area between mean and 1 SD on both sides will be equal to 34.

1% and the area between 1 SD and 2 SD on both sides will be equal to 13.6%.Question 2 [Source: Salkind 2008] Identify whether these distributions are negatively skewed, positively skewed, or not skewed at all, and why. Sketch a graph to show what the distribution curve might look like.i) This talented group of athletes scored very high on the multi-stage fitness test.Positively skewed: This is because very few of the athletes (talented group of athletes) will score very high on the multi-stage fitness test.ii) On a particular biology test, all students achieved the same score.

 Not Skewed At All: This is because the standard deviation in this case will be zero. The distribution curve will be a vertical line as all students achieved the same score.Question 3 [Source: Harris & Taylor 2009] What percentages of subjects are included in ±1 SD, ±2 SDs, or ±3 SDs from the mean? About 68.2% of subjects are included in ±1 SD from the mean.About 95.4% of subjects are included in ±2 SDs from the mean. About 99.7% of subjects are included in ±3 SDs from the mean.Question 4 [Source: Harris & Taylor 2009] SD should only be used when the data have a normal distribution.

However, means and SDs are often wrongly used for data that are not normally distributed. A simple check for a normal distribution is to see if 2 SDs away from the mean are still within the possible range for the variable. For example, if we have some length of hospital stay data with a mean stay of 10 days and a SD of 8 days then calculate ±2 SD for this data, i.e. The length of stay will be between -6 days and 26 days. Are these values for ‘length of stay’ plausible? Why? No, these values for ‘length of stay’ are not plausible.

This is because ‘length of stay’ cannot be a negative number. It should be at least one day (length of stay ≥ 1 day).What does this tell you about the distribution of the data? This tells us that the distribution of the data is not normally distributed (positively skewed). In other words, there are very few patients with very long length of hospital stay.Question 5 Use the following set of 16 scores that consists of income levels ranging from about $50,000 to about $200,000. What is the best measure of central tendency and why?

$199,999 $98,789 $90,878 $87,678 $87,245 $83,675$77,876 $77,743 $76,564 $76,465 $75,643 $66,768$65,654 $58,768 $54,678 $51,354The best measure of central tendency is median value. Because there is one score with very high-income level of $199,999 (Outlier) and all other scores consists of income levels ranging from about $50,000 to about $100,000. Thus, the data is positively skewed. 

Read More
Cite this document
  • APA
  • MLA
  • CHICAGO
(“Measures of Dispersion Speech or Presentation Example | Topics and Well Written Essays - 250 words”, n.d.)
Measures of Dispersion Speech or Presentation Example | Topics and Well Written Essays - 250 words. Retrieved from https://studentshare.org/mathematics/1595495-measures-of-dispersion
(Measures of Dispersion Speech or Presentation Example | Topics and Well Written Essays - 250 Words)
Measures of Dispersion Speech or Presentation Example | Topics and Well Written Essays - 250 Words. https://studentshare.org/mathematics/1595495-measures-of-dispersion.
“Measures of Dispersion Speech or Presentation Example | Topics and Well Written Essays - 250 Words”, n.d. https://studentshare.org/mathematics/1595495-measures-of-dispersion.
  • Cited: 0 times

CHECK THESE SAMPLES OF Measures of Dispersion

Sympatric Speciation

Measures of central tendency (Means, and range), Measures of Dispersion (standard deviations, and variance) as well a t-test was conducted to ascertain this connotation.... 7619 Additionally, the measures of central tendency (mean) and Measures of Dispersion variance) and the t-test value between the victims (variable 1) and the survivors (variable 2) were calculated.... Tables3, 4, 5, and 6 shows the measures of central tendency, Measures of Dispersion, and the t-test value between the victims and survivors....
3 Pages (750 words) Essay

Quantitative Reasoning

Central Tendency and Measures of Dispersion could be considered as two sections of the subject primarily targeted towards yielding descriptive details of a given set of observations.... easures of dispersion indicate the degree to which the observations are scattered around the mean value.... he percentage of female smokers distributed among various groups in the entire population differs from the mean value so calculated, though it is lower than the degree of dispersion of the male smokers....
5 Pages (1250 words) Report

Post-Lab Report Variation and selection in a population of wood lice -rollie pollie

Measures of central tendency (Means, and range), Measures of Dispersion (standard deviations, and variance) as well a t-test was conducted to ascertain this connotation.... Additionally, the measures of central tendency (mean) and Measures of Dispersion variance) and the t-test value between the victims (variable 1) and the survivors (variable 2) were calculated.... Tables3, 4, 5, and 6 shows the measures of central tendency, Measures of Dispersion, and the t-test value between the victims and survivors....
5 Pages (1250 words) Lab Report

Mystery Shopping research for starbucks, costa coffee and cafe nero

The second aspect of validity is the measures of extreme information.... Similarly, it may not be valid to obtain a similar measure for all the three companies, say 77% for all the data being measures.... From the exercise, the expected outcome is a comparison of the three companies to determine the best performing in customer service and satisfaction....
6 Pages (1500 words) Essay

IQ Data Analysis and Interpretation

hellip; The common Measures of Dispersion are the range, minimum and maximum.... he common Measures of Dispersion are the range, minimum and maximum.... From the paper "IQ Data Analysis and Interpretation" it is clear that common measures of central tendency are the mean, median and mode.... IQ Data Analysis and InterpretationThe common measures of central tendency are the mean, median and mode....
1 Pages (250 words) Assignment

Problem Statement

The research variables will be measured through; validity measurements, reliability measurements, and Measures of Dispersion.... Statistical Measures of Dispersion illustrate the differences in performance levels, when different motivation instruments and levels are used.... Reliability illustrates the consistency of data measures....
2 Pages (500 words) Assignment

CS 2 Descriptive Statistics Part I: Normal Curves, Variability, and Plotting

The various measures used to describe a set of data, measures of central tendency, Measures of Dispersion and measures of distribution.... Central tendency measurement… Measures of Dispersion include variance or standard deviation, minimum and maximum variables values, kurtosis and skewness (Trochim, 2006).... The various measures used to describe a set of data, measures of central tendency, Measures of Dispersion and measures of distribution....
2 Pages (500 words) Case Study

Assessment of Students Satisfaction with Universities Services

hellip; Table Two-C summarizes the results of Tables Two and Two-A for Measures of Dispersion, when grouped according to University, for each aspect.... nbsp; The data were analyzed with the use of sums, means, and descriptive Measures of Dispersion (range, mean deviation, standard deviation, variance, and coefficient of variation.... able One-C is the summary of the results of Tables One and One-A, showing the Measures of Dispersion.... tandard Deviation – The most commonly used measure of dispersion, it is an adaptation of the mean deviation....
8 Pages (2000 words) Research Paper
sponsored ads
We use cookies to create the best experience for you. Keep on browsing if you are OK with that, or find out how to manage cookies.
Contact Us