StudentShare
Contact Us
Sign In / Sign Up for FREE
Search
Go to advanced search...
Free

Boeing as One of the Leading Aircraft Manufacturing Companies in the World - Research Paper Example

Cite this document
Summary
The paper "Boeing as One of the Leading Aircraft Manufacturing Companies in the World" discusses that the performance of the organisation's marketing department significantly impacts the sales revenues and profitability of the company. Boeing mainly has severe major air carrier clients…
Download full paper File format: .doc, available for editing
GRAB THE BEST PAPER95.2% of users find it useful
Boeing as One of the Leading Aircraft Manufacturing Companies in the World
Read Text Preview

Extract of sample "Boeing as One of the Leading Aircraft Manufacturing Companies in the World"

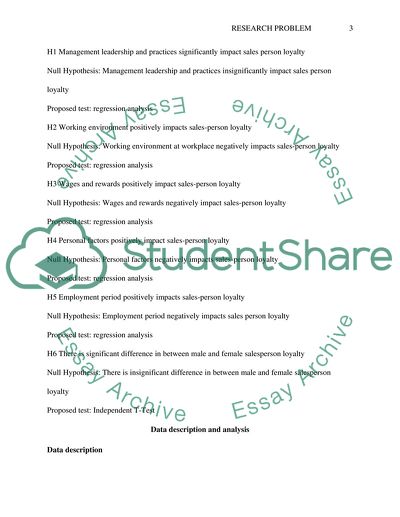
Research Problem of Institute] Research Problem Boeing is one of the leading aircraft manufacturing companies in the world. The performance of marketing department of the organization significantly impacts sales revenues and profitability of the company. Boeing mainly severe major air carrier clients and have lengthy contracts. These lengthy contracts with the customers require high salesperson loyalty and retention for a longer period. Boeings management faces challenges to identify the factors that drive salesperson loyalty. Boeing faces problem to retain sales-person loyalty towards the workplace. Management research problem of Boeing is to identify the influential factor for salesperson to incorporate in management practices. In order to identify the factors that were affecting salesperson loyalty are investigated in this study. The marketing research problem for this study is to determine which intrinsic, and extrinsic factors motivate employees to remain loyal and dedicated to the workplace for a long period. Research Approach Research Questions What is the role of salesperson loyalty in marketing? How salesperson loyalty affects sales and marketing of Boeing? What are the factors influencing salesperson loyalty? How salesperson loyalty affects marketing research and product design of Boeing? Research Hypotheses On the basis of research questions, following research hypotheses are developed H1 Management leadership and practices significantly impact sales person loyalty Null Hypothesis: Management leadership and practices insignificantly impact sales person loyalty Proposed test: regression analysis H2 Working environment positively impacts sales-person loyalty Null Hypothesis: Working environment at workplace negatively impacts sales-person loyalty Proposed test: regression analysis H3 Wages and rewards positively impact sales-person loyalty Null Hypothesis: Wages and rewards negatively impact sales-person loyalty Proposed test: regression analysis H4 Personal factors positively impact sales-person loyalty Null Hypothesis: Personal factors negatively impacts sales-person loyalty Proposed test: regression analysis H5 Employment period positively impacts sales-person loyalty Null Hypothesis: Employment period negatively impacts sales person loyalty Proposed test: regression analysis H6 There is significant difference in between male and female salesperson loyalty Null Hypothesis: There is insignificant difference in between male and female salesperson loyalty Proposed test: Independent T-Test Data description and analysis Data description • Target population The target population for the research is employees working as salespersons in the different aircraft companies to gain their views about the factors affecting their loyalty. The use of convenience sampling is made to select research participants for the study (Ryan, William, & Theeoblad, 2009). The reason to opt for convenience sampling is because of lack of time and availability to the researcher to reach each of the salesperson working at Boeing. • Sample size The sample size of 1000 male and female salespersons is selected as research participants. The researcher has selected sale-persons specifically from aircraft companies with different working experience, age, income and educational background. The researcher made use of e-mailed survey questionnaires to gather information from the participants about the factors affecting loyalty to the workplace. The questionnaires were sent to the personal email address of participants (Tuck & McKenzie, 2014). The researcher made use of close-ended questions. The questionnaire was used to gather demographic features of the sample, as well as multiple extrinsic and intrinsic factors influencing employee loyalty to an organization. The responses were gathered using a Likert scale. • Descriptive statistics of the population On the basis of descriptive statistics, it can be noted that the majority of the males were working as a salesperson. There were 52.20% of male and 47.8% of female. When the respondents were asked about their highest level of education the results indicated that 31% were some college graduates, 25.3% were college graduate, 24.3% high school graduate, 12.7% post graduate and 6.6% less than school graduates. Mostly individuals were either school or college graduates. When respondents were asked about their marital status, the results indicated the majority of the individuals were married (50.8%) and Single (32.90%). The ethnicity of the population revealed 77.4% of white people, 10.20% of Black or African America and 7.50% others. However, the Asian and American Indian (0.50%) people were relatively less. Further, the respondents were asked for how long they worked in the current position. The results show most of the participants working in the positioned worked less than five years as the sales person. 29.50% worked between 1 to 5 years, 16.8% less than one year and 15.40% for the period 5 to less than ten years. People working for a period of 30years or more were least (2.50%). 51.30% of the participants did not have any intention to change the job in the five years, whereas 32.90% had plans to change the job in the next five years. Data Analysis The gathered data was analysed using statistical methods. Cronbach’s Alpha was used to test the reliability of the test. Further, the relationship between the variables (dependent: sale-person loyalty and independent: managerial leadership and practices, work environment, wages and benefits, personal factor and employment period) was tested using regression analysis. P-Value of 0.05 was used to identify the significant relationship between variables (Thurau & Gwinner, 2009). In addition, the independent t-test was used to identify the difference between the perception between male and female and their loyalty towards the workplace. The hypothesis was tested on the basis of p-value, variables with the p-value less than 0.05 showed acceptances or research hypothesis. Findings and Interpretation Reliability Test The reliability test was conducted to determine the reliability and validity of the questionnaire. The questionnaire was self administered and the questions were designed in a way that supported the variables and the designed hypothesis. Reliability Statistics Cronbachs Alpha N of Items .770 28 The results of the reliability statistic test was .770 (0.770 > 0.70), this shows that the responses were reliable and valid. The questionnaire was well understood by the respondents and the responses were no spread. The further analysis was made using the regression analysis on SPSS. Regression Analysis The regression analysis was used to determine the degree of relationship and also to determine the significance of the relationship between the dependent (salesperson loyalty) and independent variables (Management leadership, Working environment, Wages and rewards, Personal factors and the Employment period of a sales person). The regression analysis was done using the SPSS, statistical software generally used for the analysis of data. Model R R Square Adjusted R Square Std. Error of the Estimate 1 .624a .389 .386 1.11330 The Model summary of the regression analysis shows the variation of relationship that exists between the variables. In the above case the R-value is .624 and R Square value is .389. The R Square value of the table represents that the independent variables can depict the dependent variables by a 38.9% (.389* 100). ANOVA Model Sum of Squares df Mean Square F Sig. 1 Regression 645.153 5 129.031 104.104 .000b Residual 1011.378 816 1.239     Total 1656.532 821       The ANOVA table shows the significance value (Sig.). If the value of the significance is less than 0.05 the relationship is considered to be significant. In the table above the relationship between the dependent and independent variables is significant (.000 < 0.05 standard sig. value). The significance value show that the increase of decrease in the independent variables (Management leadership, Working environment, Wages and rewards, Personal factors and the Employment period of a sales person have a significant impact on the dependent variable (salesperson loyalty). Coefficient Model Un standardized Coefficients Standardized Coefficients t Sig. B Std. Error Beta 1 (Constant) 1.363 .272   5.019 .000 Management .354 .035 .371 10.029 .000 Work environment .354 .048 .284 7.353 .000 Wage benefit .033 .028 .037 1.174 .241 Personal factors .039 .045 .026 .871 .384 Employment period -.043 .049 -.025 -.872 .383 The Coefficient table explains the relationships in more detail. The values of Beta (β), and the individual significances are examined to get the better idea of the relationship between the variables. The beta value of Management Leadership the independent variables has a positive and significant relationship with Sales Person Loyalty (β= .371 and Sig.= .000 < 0.05). This means that the increase in the Management leadership skills will improve the sales persons loyalty. The results show that there is a significant impact of Management Leadership on the Loyalty of the Sales person and therefore the Null Hypothesis is rejected and the Alternative Hypothesis (H1) is accepted (Management Leadership and Practices significantly impact the sales person loyalty). The other independent variable Work Environment also shows that there is a significant relationship between the independent variable and the dependent variable (Sales Person Loyalty) (Sig. = .000 < 0.05). The beta value shows that the relationship is positive. The other independent variables Wage Benefit, Personal Factors and the Employment Period did not show a significant relationship (significance values were .241, .384, .383 respectively, all values > .05). The results show that the variables have no significant impact on the sales person loyalty. The analysis was done to identify if the males and females had different levels of loyalty, the T Test was used to examine the difference. Independent T Test Group Statistics Gender N Mean Std. Deviation Std. Error Mean loyalty Male 468 5.2660 1.47436 .06815 Female 405 5.4370 1.35581 .06737 The total number of respondents for the analysis was 1,000, the total valid responses used for the analysis were 468 males and 405 females. The rest of the 127 respondents were not valid and their responses were not the part of the analysis.   t-test for Equality of Means t df Sig. (2-tailed) Mean Difference Std. Error Difference loyalty Equal variances assumed -1.774 871 .076 -.17101 .09641 Equal variances not assumed -1.785 867.775 .075 -.17101 .09583 The table shows that the significance value of the two-tailed test was far higher than the standardized significance value of .05. It shows that there is no difference between the loyalty of sales male and female personals working in Boeing. The mean difference also shows a negative relationship that is -.17101 showing that the negative relationship is present. The T-Test was used to analyse the hypothesis no 6 H6 (There is the significant difference in between male and female salesperson loyalty). The results show that there is an insignificant difference between the male and female sales- person loyalty, and, therefore, the null hypothesis is accepted, and the alternative hypothesis was rejected. Findings and managerial application The results of the dependent and independent variables show that only the Management Leadership and Work Environment are the two factors that can have a significant impact on the Loyalty of salespersons employed by Boeing. The organization must focus on developing more efficient and effective Management leadership within Boeing and also to create an attractive and encouraging Working Environment. Boeing can start different training and developmental programs for their employees, which teach about the ways of properly managing their work and to improve their performances. These training and development programs will help to motivate the sales persons and increase their performances. The Management Leadership style and attitudes must also be focused, and the organization must focus on removing the communication gap that exists between the managerial and workforce levels employees. The managers of Boeing must be lenient in their attitudes and recognize and appraise the employees on their better and improved sales. The employees will become loyal and hence the overall performance of the sales staff/ personal can be improved. Interactive sessions must be organized once in a month or week so that the difficulties of the sales persons are heard, and proper steps could be taken to improve the working conditions of the Boeing business. The sales persons that have good performances must be provided with monetary benefits and bonuses. The sales personals will work to get the bonuses and therefore the overall sales levels, and the loyalty of the sales teams will increase drastically. The organization will have competition between their employees. The Human Resource department must focus on providing feasible and manageable working hours for the sales personals so that the sales staff does not feel pressure regarding the working hours. The company should also work to provide their employees with the necessities of life and also to fulfil their needs. References Aguinis, H., Joo, H., & Gottfredson. (2013). What monetary rewards can and cannot do: How to show employees the money. Business Horizons, 56(2), 241-249. Baharein, K., & Noor, M. (2009). Case Study: A Strategic Research Methodology. American Journal of Applied Sciences, 11(5), 1602-1604. Cho, Y. J., & Perry, J. L. (2012). Intrinsic Motivation and Employee Attitudes. Review of Public Personnel Adminstration, 32(4), 384-406. Dobre, O.-I. (2013). Employee motivation and organizational performance. Review of Applied Socio- Economic Research, 5(1), 53-62. Ryan, B., William, R., & Theeoblad, M. (2009). Research Method and Methodology in Finance and Accounting. New York: Thomson. Teddlie, C., & Tashakkori, A. (2009). Foundations of Mixed Methods Research: Integrating Quantitative and Qualitative Approaches in the Social and Behavioral Sciences. New York: SAGE Publication Inc. Thomas, R. M. (2003). Blending qualitative and quantitative research methods in theses and dissertations. Thousand Oaks: Corwin. Thurau, T., & Gwinner, K. (2009). Understanding Relationship Marketing Outcomes an Integration of Relational Benefits and Relationship Quality. Journal of Service Research, 4(3), 230-250. Tuck, E., & McKenzie, M. (2014). Place in Research: Theory, Methodologies, and Methods: Theory, Methodology, and Methods. London: Routledge. Statistics   Gender What is the highest level of education you have completed? What is your current marital status? Ethnicity Do you consider yourself to be of Hispanic origin? children in HH Under age 6 How long have you been in your current position Do you plan to change jobs in the next five years How many jobs have you had in the past five years in what year were you born How many people in your HH contribute their income to the HH income state Age N Valid 1000 999 998 995 998 997 876 842 995 1000 994 908 1000 1000 Missing 0 1 2 5 2 3 124 158 5 0 6 92 0 0 Frequency Table Gender   Frequency Percent Valid Percent Cumulative Percent Valid male 522 52.2 52.2 52.2 female 478 47.8 47.8 100.0 Total 1000 100.0 100.0   What is the highest level of education you have completed?   Frequency Percent Valid Percent Cumulative Percent Valid Some high school or less 66 6.6 6.6 6.6 High school graduate 243 24.3 24.3 30.9 Some college 310 31.0 31.0 62.0 College graduate 253 25.3 25.3 87.3 Post-graduate degree 127 12.7 12.7 100.0 Total 999 99.9 100.0   Missing System 1 .1     Total 1000 100.0     What is your current marital status?   Frequency Percent Valid Percent Cumulative Percent Valid Single 329 32.9 33.0 33.0 Married 508 50.8 50.9 83.9 Living with someone as if married 22 2.2 2.2 86.1 Separated 20 2.0 2.0 88.1 Divorced 100 10.0 10.0 98.1 Widowed 19 1.9 1.9 100.0 Total 998 99.8 100.0   Missing System 2 .2     Total 1000 100.0     Ethnicity   Frequency Percent Valid Percent Cumulative Percent Valid American Indian or Alaskan Native 26 2.6 2.6 2.6 Asian 18 1.8 1.8 4.4 Black or African American 102 10.2 10.3 14.7 White 774 77.4 77.8 92.5 Other 75 7.5 7.5 100.0 Total 995 99.5 100.0   Missing System 5 .5     Total 1000 100.0     Do you consider yourself to be of Hispanic origin?   Frequency Percent Valid Percent Cumulative Percent Valid yes 76 7.6 7.6 7.6 no 922 92.2 92.4 100.0 Total 998 99.8 100.0   Missing System 2 .2     Total 1000 100.0     children in HH Under age 6   Frequency Percent Valid Percent Cumulative Percent Valid 0 799 79.9 80.1 80.1 1 122 12.2 12.2 92.4 2 59 5.9 5.9 98.3 3 14 1.4 1.4 99.7 4 3 .3 .3 100.0 Total 997 99.7 100.0   Missing System 3 .3     Total 1000 100.0     How long have you been in your current position   Frequency Percent Valid Percent Cumulative Percent Valid Less than 1 year 168 16.8 19.2 19.2 1 to less than 5 years 295 29.5 33.7 52.9 5 to less than 10 years 154 15.4 17.6 70.4 10 to less than 20 years 156 15.6 17.8 88.2 20 to less than 30 years 78 7.8 8.9 97.1 30 years or more 25 2.5 2.9 100.0 Total 876 87.6 100.0   Missing System 124 12.4     Total 1000 100.0     Do you plan to change jobs in the next five years   Frequency Percent Valid Percent Cumulative Percent Valid 0 513 51.3 60.9 60.9 yes 329 32.9 39.1 100.0 Total 842 84.2 100.0   Missing System 158 15.8     Total 1000 100.0     How many jobs have you had in the past five years   Frequency Percent Valid Percent Cumulative Percent Valid 0 27 2.7 2.7 2.7 1 454 45.4 45.6 48.3 2 243 24.3 24.4 72.8 3 141 14.1 14.2 86.9 4 46 4.6 4.6 91.6 5 40 4.0 4.0 95.6 Between 5 and 10 28 2.8 2.8 98.4 10 or more 16 1.6 1.6 100.0 Total 995 99.5 100.0   Missing System 5 .5     Total 1000 100.0     in what year were you born   Frequency Percent Valid Percent Cumulative Percent Valid 34 5 .5 .5 .5 35 4 .4 .4 .9 36 3 .3 .3 1.2 37 14 1.4 1.4 2.6 38 5 .5 .5 3.1 39 11 1.1 1.1 4.2 40 9 .9 .9 5.1 41 14 1.4 1.4 6.5 42 12 1.2 1.2 7.7 43 14 1.4 1.4 9.1 44 22 2.2 2.2 11.3 45 13 1.3 1.3 12.6 46 19 1.9 1.9 14.5 47 22 2.2 2.2 16.7 48 21 2.1 2.1 18.8 49 24 2.4 2.4 21.2 50 23 2.3 2.3 23.5 51 19 1.9 1.9 25.4 52 17 1.7 1.7 27.1 53 27 2.7 2.7 29.8 54 30 3.0 3.0 32.8 55 25 2.5 2.5 35.3 56 31 3.1 3.1 38.4 57 33 3.3 3.3 41.7 58 23 2.3 2.3 44.0 59 34 3.4 3.4 47.4 60 25 2.5 2.5 49.9 61 26 2.6 2.6 52.5 62 22 2.2 2.2 54.7 63 28 2.8 2.8 57.5 64 22 2.2 2.2 59.7 65 23 2.3 2.3 62.0 66 14 1.4 1.4 63.4 67 32 3.2 3.2 66.6 68 31 3.1 3.1 69.7 69 16 1.6 1.6 71.3 70 18 1.8 1.8 73.1 71 25 2.5 2.5 75.6 72 19 1.9 1.9 77.5 73 23 2.3 2.3 79.8 74 34 3.4 3.4 83.2 75 26 2.6 2.6 85.8 76 21 2.1 2.1 87.9 77 26 2.6 2.6 90.5 78 20 2.0 2.0 92.5 79 21 2.1 2.1 94.6 80 20 2.0 2.0 96.6 81 34 3.4 3.4 100.0 Total 1000 100.0 100.0   How many people in your HH contribute their income to the HH   Frequency Percent Valid Percent Cumulative Percent Valid 0 18 1.8 1.8 1.8 1 360 36.0 36.2 38.0 2 530 53.0 53.3 91.3 3 or more 86 8.6 8.7 100.0 Total 994 99.4 100.0   Missing System 6 .6     Total 1000 100.0     income   Frequency Percent Valid Percent Cumulative Percent Valid Under $25,000 116 11.6 12.8 12.8 $25,000 to less than $40,000 211 21.1 23.2 36.0 $40,000 to less than $50,000 134 13.4 14.8 50.8 $50,000 to less than $60,000 111 11.1 12.2 63.0 $60,000 to less than $75,000 138 13.8 15.2 78.2 $75,000 to less than $100,000 106 10.6 11.7 89.9 $100,000 to less than $150,000 64 6.4 7.0 96.9 $150,000 or more 28 2.8 3.1 100.0 Total 908 90.8 100.0   Missing System 92 9.2     Total 1000 100.0     state   Frequency Percent Valid Percent Cumulative Percent Valid AL 21 2.1 2.1 2.1 AR 9 .9 .9 3.0 AZ 8 .8 .8 3.8 CA 99 9.9 9.9 13.7 CO 17 1.7 1.7 15.4 CT 11 1.1 1.1 16.5 DC 2 .2 .2 16.7 DE 2 .2 .2 16.9 FL 53 5.3 5.3 22.2 GA 30 3.0 3.0 25.2 IA 12 1.2 1.2 26.4 ID 8 .8 .8 27.2 IL 34 3.4 3.4 30.6 IN 17 1.7 1.7 32.3 KS 11 1.1 1.1 33.4 KY 13 1.3 1.3 34.7 LA 15 1.5 1.5 36.2 MA 23 2.3 2.3 38.5 MD 22 2.2 2.2 40.7 ME 6 .6 .6 41.3 MI 41 4.1 4.1 45.4 MN 27 2.7 2.7 48.1 MO 25 2.5 2.5 50.6 MS 17 1.7 1.7 52.3 MT 4 .4 .4 52.7 NC 30 3.0 3.0 55.7 NE 3 .3 .3 56.0 NH 8 .8 .8 56.8 NJ 26 2.6 2.6 59.4 NM 1 .1 .1 59.5 NV 11 1.1 1.1 60.6 NY 73 7.3 7.3 67.9 OH 36 3.6 3.6 71.5 OK 20 2.0 2.0 73.5 OR 11 1.1 1.1 74.6 PA 52 5.2 5.2 79.8 RI 1 .1 .1 79.9 SC 14 1.4 1.4 81.3 SD 10 1.0 1.0 82.3 TN 20 2.0 2.0 84.3 TX 69 6.9 6.9 91.2 UT 4 .4 .4 91.6 VA 26 2.6 2.6 94.2 VT 3 .3 .3 94.5 WA 26 2.6 2.6 97.1 WI 20 2.0 2.0 99.1 WV 7 .7 .7 99.8 WY 2 .2 .2 100.0 Total 1000 100.0 100.0   Age   Frequency Percent Valid Percent Cumulative Percent Valid 18.00 34 3.4 3.4 3.4 19.00 20 2.0 2.0 5.4 20.00 21 2.1 2.1 7.5 21.00 20 2.0 2.0 9.5 22.00 26 2.6 2.6 12.1 23.00 21 2.1 2.1 14.2 24.00 26 2.6 2.6 16.8 25.00 34 3.4 3.4 20.2 26.00 23 2.3 2.3 22.5 27.00 19 1.9 1.9 24.4 28.00 25 2.5 2.5 26.9 29.00 18 1.8 1.8 28.7 30.00 16 1.6 1.6 30.3 31.00 31 3.1 3.1 33.4 32.00 32 3.2 3.2 36.6 33.00 14 1.4 1.4 38.0 34.00 23 2.3 2.3 40.3 35.00 22 2.2 2.2 42.5 36.00 28 2.8 2.8 45.3 37.00 22 2.2 2.2 47.5 38.00 26 2.6 2.6 50.1 39.00 25 2.5 2.5 52.6 40.00 34 3.4 3.4 56.0 41.00 23 2.3 2.3 58.3 42.00 33 3.3 3.3 61.6 43.00 31 3.1 3.1 64.7 44.00 25 2.5 2.5 67.2 45.00 30 3.0 3.0 70.2 46.00 27 2.7 2.7 72.9 47.00 17 1.7 1.7 74.6 48.00 19 1.9 1.9 76.5 49.00 23 2.3 2.3 78.8 50.00 24 2.4 2.4 81.2 51.00 21 2.1 2.1 83.3 52.00 22 2.2 2.2 85.5 53.00 19 1.9 1.9 87.4 54.00 13 1.3 1.3 88.7 55.00 22 2.2 2.2 90.9 56.00 14 1.4 1.4 92.3 57.00 12 1.2 1.2 93.5 58.00 14 1.4 1.4 94.9 59.00 9 .9 .9 95.8 60.00 11 1.1 1.1 96.9 61.00 5 .5 .5 97.4 62.00 14 1.4 1.4 98.8 63.00 3 .3 .3 99.1 64.00 4 .4 .4 99.5 65.00 5 .5 .5 100.0 Total 1000 100.0 100.0   Pie Chart RELIABILITY Read More
Cite this document
  • APA
  • MLA
  • CHICAGO
(“Research report Paper Example | Topics and Well Written Essays - 2000 words - 1”, n.d.)
Research report Paper Example | Topics and Well Written Essays - 2000 words - 1. Retrieved from https://studentshare.org/marketing/1693216-research-report
(Research Report Paper Example | Topics and Well Written Essays - 2000 Words - 1)
Research Report Paper Example | Topics and Well Written Essays - 2000 Words - 1. https://studentshare.org/marketing/1693216-research-report.
“Research Report Paper Example | Topics and Well Written Essays - 2000 Words - 1”, n.d. https://studentshare.org/marketing/1693216-research-report.
  • Cited: 0 times

CHECK THESE SAMPLES OF Boeing as One of the Leading Aircraft Manufacturing Companies in the World

The Aircraft Manufacturing Industry

Date: Report on the aircraft manufacturing Industry Executive Summary The demand facing commercial aircraft manufacturers for new orders is largely derived from the perceived future demand for commercial aviation.... The commercial aircraft manufacturing industry though representing an oligopolistic market structure operates as a near duopoly with main players – Airbus and Boeing.... Boeing and Airbus are the major players in the aircraft manufacturing industry and both of them have produced market forecast for the 20 year period 2010 to 2029....
24 Pages (6000 words) Essay

Industry and Company Analysis: Aircraft Manufacture

COURSE: DATE: INDUSTRY AND COMPANY ANALYSIS Industry analysis AIRCRAFT MANUFACTURE The North American Industry Classification System (NAICS) code 336411 deals with companies in the manufacturing industry and specifically the manufacture of aircrafts, aircraft modification and restoration of aircrafts to their original designs.... The top fifty largest companies in the industry account for 99.... People all over the world have increased their travelling from one part of a country to another, from one end of a continent to the other end and from one corner of the world to another....
5 Pages (1250 words) Essay

Boeing Aircraft Company

This American aircraft company is also respected for reportedly holding the most diverse, inventive and skilled workforce in the world (Boeing, 2013).... Notably, the invention of 747 Jumbo Jet in 1966 by Boeing brought about a revolution in the world of air travel.... Boeing Aircraft Company Boeing Aircraft Company is one of the largest manufacturers of military aircrafts and commercial jetliners.... As apparent from the discussion, one of the approaches considered with principal significance by Boeing when entering the aircraft marketplace is continuous innovation....
4 Pages (1000 words) Case Study

Boeing Aircraft Company

While Airbus is aggressive in its efforts to sell its jets in the world market, it is doing so at a major disadvantage.... The paper "Boeing Aircraft Company" says the world jet aircraft manufacturing industry has a duopolistic market structure for it has just two major players consisting of Boeing, which is headquartered in the United States, and Airbus Industrie, which main offices and major facilities are in Europe.... Because of such tremendous amount of fixed capital requirements, experts believe that the world can support at most only 3 manufacturers....
8 Pages (2000 words) Case Study

Analysis of Airbus A380 Engine Failure Above Bantam Island

"Analysis of Airbus A380 Engine Failure Above Bantam Island" provides a detailed investigation with the flight history, information of the aircraft, timeline of events and the cause of the failure.... This event presents a situation where the integration of the various aircraft systems led to the successful landing of the crippled plane.... EVALUATION OF ALL THE AVAILABLE RELEVANT INFORMATION All the relevant and available information regarding the aircraft's system failures, system integration, Crew Resource Management, and tech recorders among others were evaluated, and the following information regarding the situation was summarized....
14 Pages (3500 words) Research Paper

Analysis of Boeing Aircraft Companys supply chain management

About 70 percent of these airplanes are nonexistent and will be produced by Boeing, Airbus, as well as other companies in the LCA industry.... The assistance that the government provides to these companies in characteristic of two major factors.... the two companies are offered support by their respective governments in diverse ways.... resently, the large commercial aircraft (LCA) fleet, which is airplanes having more than 300 seats and over is approximately 16,000 and rising....
10 Pages (2500 words) Research Paper

Airbus and Its Activities in the Civil Aircraft Manufacturing Industry

With a large number of airline companies and fewer aircraft manufacturing companies, Airbus literally enjoys a monopoly in the market along with Boeing.... Innovation: Innovation is one of the critical success factors of the aircraft manufacturing industry.... Though there are smaller players in the industry from many parts of the world, the industry still stands on the big names Airbus and Boeing.... With the world becoming a global village people are required to be moved from one country to the other....
8 Pages (2000 words) Case Study

Composite Material Failure in Aircraft

It can be said to be the world's superhero material.... This paper ''Composite Material Failure in aircraft'' tells that Some composite materials used in the construction of aircraft structures started appearing in the late 1930s.... The Diamond materials and construction methods also got to be used for a few aircraft productions.... An entirely new structure construction method was opened up by introducing composite materials within the aircraft industry....
36 Pages (9000 words) Report
sponsored ads
We use cookies to create the best experience for you. Keep on browsing if you are OK with that, or find out how to manage cookies.
Contact Us