StudentShare
Contact Us
Sign In / Sign Up for FREE
Search
Go to advanced search...
Free

Macro and Micro Economics of the Country - Essay Example

Cite this document
Summary
This essay "Macro and Micro Economics of the Country" focuses on conducting a macroeconomic analysis of the following five countries: Australia, Brazil, China, Spain, and Zimbabwe. The following indicators will be used: GDP, inflation, unemployment, government spending, and taxes. …
Download full paper File format: .doc, available for editing
GRAB THE BEST PAPER96.4% of users find it useful
Macro and Micro Economics of the Country
Read Text Preview

Extract of sample "Macro and Micro Economics of the Country"

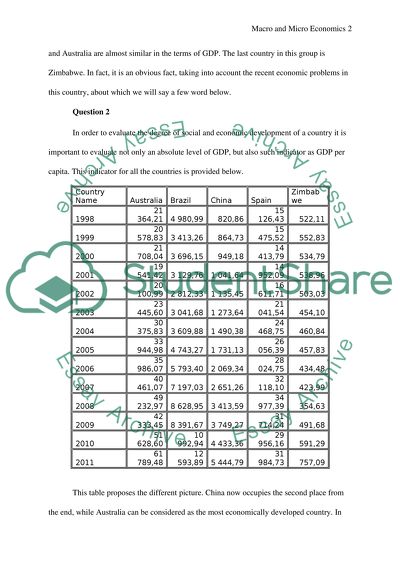
?Macro and Micro Economics We are going to conduct macroeconomic analysis of the following five countries: Australia, Brazil, China, Spain and Zimbabwe. The following indicators will be used: GDP, inflation, unemployment, government spending and taxes. The period for analysis will be from 1998 to 2012. Information will be get from the following informational source http://data.worldbank.org/indicator. Question 1 First of all, we are going to consider such important economic indicator as GDP. This indicator for all the mentioned countries is provided in the table below. Country Name Australia Brazil China Spain Zimbabwe 1998 399 745 641 999,59 843 827 363 149,36 1 019 458 585 326,15 600 838 623 454,73 6 401 968 164,11 1999 389 474 871 537,79 586 862 640 399,44 1 083 277 930 359,88 617 879 821 010,02 6 858 013 062,77 2000 415 774 037 555,74 644 701 831 101,39 1 198 474 934 198,78 580 345 494 748,48 6 689 957 610,06 2001 379 357 625 845,23 553 582 178 386,19 1 324 806 914 358,35 608 856 375 838,93 6 777 384 732,67 2002 395 012 557 555,46 504 221 228 974,04 1 453 827 554 714,01 686 295 878 035,01 6 342 116 353,99 2003 466 459 522 422,83 552 469 288 267,79 1 640 958 732 775,07 883 839 729 119,64 5 727 591 778,02 2004 611 386 399 203,30 663 760 341 880,34 1 931 644 331 142,47 1 044 612 070 303,53 5 805 598 442,67 2005 692 301 157 720,64 882 185 702 547,25 2 256 902 590 825,33 1 130 798 885 738,45 5 755 215 232,34 2006 744 836 028 751,12 1 088 916 819 852,94 2 712 950 886 698,27 1 236 352 163 544,47 5 443 896 499,72 2007 850 325 822 407,16 1 365 982 138 274,39 3 494 055 944 791,32 1 441 426 534 070,22 5 291 950 101,36 2008 1 052 817 595 438,40 1 652 817 559 096,61 4 521 827 288 303,98 1 593 420 002 197,24 4 415 702 801,28 2009 921 971 672 011,20 1 621 661 507 655,08 4 991 256 406 734,99 1 455 956 368 263,64 6 133 240 671,87 2010 1 139 200 538 110,92 2 143 035 333 258,24 5 930 529 470 799,17 1 380 109 210 526,32 7 433 314 459,74 2011 1 379 382 221 955,10 2 476 652 189 879,72 7 318 499 269 769,41 1 476 881 944 444,44 9 656 199 513,79 As we can see from the table above, China is characterized with the largest GDP among the countries under consideration. It is not surprising, since this country is, in fact, the current leader of the global economy. The second country after China is Brazil. However, the gap between the degrees of GDP of both countries is quite high. The common feature between both countries is that they both suffered the global financial crisis quite well. Spain and Australia are almost similar in the terms of GDP. The last country in this group is Zimbabwe. In fact, it is an obvious fact, taking into account the recent economic problems in this country, about which we will say a few word below. Question 2 In order to evaluate the degree of social and economic development of a country it is important to evaluate not only an absolute level of GDP, but also such indicator as GDP per capita. This indicator for all the countries is provided below. Country Name Australia Brazil China Spain Zimbabwe 1998 21 364,21 4 980,99 820,86 15 126,43 522,11 1999 20 578,83 3 413,26 864,73 15 475,52 552,83 2000 21 708,04 3 696,15 949,18 14 413,79 534,79 2001 19 541,42 3 129,76 1 041,64 14 952,09 538,96 2002 20 100,99 2 812,33 1 135,45 16 611,71 503,03 2003 23 445,60 3 041,68 1 273,64 21 041,54 454,10 2004 30 375,83 3 609,88 1 490,38 24 468,75 460,84 2005 33 944,98 4 743,27 1 731,13 26 056,39 457,83 2006 35 986,07 5 793,40 2 069,34 28 024,75 434,48 2007 40 461,07 7 197,03 2 651,26 32 118,10 423,99 2008 49 232,97 8 628,95 3 413,59 34 977,39 354,63 2009 42 333,45 8 391,67 3 749,27 31 714,24 491,68 2010 51 628,60 10 992,94 4 433,36 29 956,16 591,29 2011 61 789,48 12 593,89 5 444,79 31 984,73 757,09 This table proposes the different picture. China now occupies the second place from the end, while Australia can be considered as the most economically developed country. In any case, the degree of well-being of its citizens is much higher than the same indicator of Chinese people. The main reason for it is of course the fact that China has the greatest number of citizens in the world. It is simply impossible to reach such degree of GDP per capita for this country at the moment. The same situation is with Brazil. Despite a significant negative influence of the global financial crisis, Spain still occupies the second place, according to this particular indicator. Zimbabwe again occupies the last place, probably, not only in the group of countries under consideration, but in the whole world. It is important to evaluate such indicator as GDP in dynamics. That is why we wre going to present dynamics of GDP growth on the following chart. We believe that there is no great need to talk about leadership of China in this context. In fact, all the countries, apart from Zimbabwe have demonstrated appropriate pace of growth of GDP for the last ten years. Spain has been significantly harmed by the global financial crisis and still overcomes its consequences. Zimbabwe was in a negative area for the last years. However, now it demonstrates very high pace of growth. We believe that the main reason for it is the low basis of the previous years. It is also very important to evaluate such indicators as inflation and unemployment. These indicators also characterize the degree of economic development of a country. Dynamics of inflation rate of the countries under consideration is provided on the following chart. We must point that we have described inflation rate of Zimbabwe on a separate chart, because of the reasons that are going to be explained below. Spain and Australia are characterized with quite moderate rate of inflation. It is typical for such types of market economies. China and Brazil have high pace of growing prices. The reason for it is that these countries use growing prices for the purpose of boosting economic development. It is quite a typical way for the developing countries. The following chart presents dynamics of inflation rate in Zimbabwe. The last years are even not presented in the chart, since the inflations rate were just tremendous. In fact, we have already said that the country has been experiencing deep economic crisis for the last years. One of the main features of this crisis is fantastic pace of inflation. This opinion can be proved by the following words. The inflation rate in Zimbabwe was recorded at 2.76 percent in March of 2013. Inflation Rate in Zimbabwe is reported by the Reserve bank of Zimbabwe. Historically, from 1999 until 2013, Zimbabwe Inflation Rate averaged 1213.14 percent reaching an all time high of 66212 percent in December of 2007 and a record low of -7.70 percent in December of 2009. In Zimbabwe, the inflation rate measures a broad rise or fall in prices that consumers pay for a standard basket of goods. This page includes a chart with historical data for Inflation Rate in Zimbabwe (“Zimbabwe Inflation Rate”). Inflation is toughly related with unemployment rate. In fact, they are considered two main and opposite goals of economic policy. Unemployment rates of all the countries under consideration are provided on the following chart. First of all, we must say that there is no data for unemployment rate for Zimbabwe. The reason for it is low degree of development of statistics in this country. We would like to point your attention on unemployment rate of Spain. It is significant nowadays. It only proves our opinion that the crisis has significantly damaged Spain. Nowadays, the whole European Union is forced to safe this country. Question 3 Talking about governmental expenses, we must mention again about lack of statistics from Zimbabwe. The other countries are presented on the following chart. Also, it is important to mention that government expenses are presented as a percentage of a country’s GDP. The conclusion that can be made from the chart is the following. All the countries are characterized with almost equal share of government expenses in GDP. Second of all, The expenses have been quite stable for the last years. Question 4 The last task of the paper is to define the so-called equilibrium GDP. In our opinion, one of the most appropriate definitions of the term “equilibrium GDP” is the following. Equilibrium GDP is that output level at which the total amount of goods produced, GDP, is just equal to the total amount of goods purchased. In a world with no government or foreign sector, the amount purchased is C + Ig. Additionally, GDP and disposable income (DI) are the same, so that our earlier relationship between consumption and DI holds for GDP as well: C = a + bDI = a +bGDP where a is autonomous consumption and b is the marginal propensity to consume (“Equilibrium GDP Definition”). GDP T YD C I G NX AE UI Y will: $24000 $3000 $32000 $14100 $6000 $6000 $2700 $28800 $1200 $36000 $27000 $4500 $35000 $15600 $8000 $7000 $3200 $33800 $2400 $39000 $30000 $6000 $38000 $17100 $10000 $8000 $3700 $38800 $3600 $42000 $33000 $6500 $41000 $18600 $12000 $9000 $4200 $43800 $4800 $45000 $36000 $8000 $44000 $19100 $14000 $10000 $4700 $47800 $6000 $48000 $39000 $9500 $47000 $20600 $16000 $11000 $5200 $52800 $7200 $51000 $42000 $11000 $50000 $22100 $18000 $12000 $5700 $57800 $8400 $54000 Question 5 Reference List Equilibrium GDP Definition, viewed 12 May 2013, Zimbabwe Inflation Rate, viewed 12 May 2013, Read More
Cite this document
  • APA
  • MLA
  • CHICAGO
(“MAE 102 Global Economic Essay Example | Topics and Well Written Essays - 1500 words”, n.d.)
Retrieved from https://studentshare.org/macro-microeconomics/1477865-mae
(MAE 102 Global Economic Essay Example | Topics and Well Written Essays - 1500 Words)
https://studentshare.org/macro-microeconomics/1477865-mae.
“MAE 102 Global Economic Essay Example | Topics and Well Written Essays - 1500 Words”, n.d. https://studentshare.org/macro-microeconomics/1477865-mae.
  • Cited: 0 times

CHECK THESE SAMPLES OF Macro and Micro Economics of the Country

Micro & Macro Economic Analysis - Electronic Arts

In economics, the relationship between a prospective seller and buyer of a product is known as demand and supply.... The report has been divided into two major sections, analyzing the impacts produced on micro and Macro economy of a company and its market.... A detailed analysis of the micro and Macroeconomic environment of Electronic Arts Inc is conducted below in detail, to explain the subject without obstruction....
8 Pages (2000 words) Coursework

The Current UK Housing Market

According to the largest lender of the country, 5% of the total transaction is for the purchase of new properties while the rest is for purchase of either old or modern property.... Some writers opined that the housing market of the country is correlated with that of the economy while some others opposed it.... macro & micro economics Contents Introduction 3 Current UK housing market 3 macro and micro economic factors 5 Current economic situation and effects on housing market 8 Conclusion 9 Reference 10 Introduction The main participants in the real estate market are owner, renter, developer, renovator and facilitator....
7 Pages (1750 words) Essay

The Macro and Micro-economic Concerns of the High Unemployment

This essay explores detrimental effects of unemployment on both macro and micro-levels of economy.... trategic arguments observe that both macro and micro-economists should examine the present rates of unemployment critically.... Unemployment invites financial disaster and reduces the aggregate purchasing capacity of a country.... micro and macroeconomics activities demand fiscal support and source their rewards by selling their products and services to the population....
4 Pages (1000 words) Essay

Effects of Taxation on Macro & Micro economics

Term paper on Effects of Taxation on Macro & micro economics Abstract The Overall the study of economic environment is divided into two categories, microeconomics and macroeconomics.... This term paper seeks to evaluate the effect of taxation on both the Macro & micro economics.... First, The ability to pay: Here the argument is that citizens of a given country are differently endowed in wealth and earnings.... The micro-economics deals with individual units while the macro-economic deals national or international economy as a whole....
5 Pages (1250 words) Term Paper

Macro and Micro economics research

micro environmental factors are those that affect the non-capacity of the company to serve and produce products to the market.... macro environment ... macro environment factors are also external to the firm and cannot be controlled.... macro environmental factors may include the following: ... macro environment macro environment factors are also external to the firm and cannot be controlled....
4 Pages (1000 words) Essay

Macro & Micro economics

Perhaps this is the reason for which the country is rich in terms of labor resource.... This is the reason for which the country is a capital abundant nation that is rich in terms of technological knowhow.... Macro & micro economics Name of the Student Name of the Professor Course Number Date Macro & micro economics Doll Production Process There are varieties of dolls that are produced in the modern consumer goods market....
6 Pages (1500 words) Essay

Macro Economics - Research a country

% of the GDP of the country.... India has been able to develop progressive technologies that have laid the path of sustainable economic progress of the country.... the country is bounded by both land and sea.... the country has witnessed an average GDP growth rate of 5.... The economic reforms adopted by the country have seen the growth of the services sector in a rapid manner over the last twenty years.... However, the country has GDP per capita of USD$448....
3 Pages (750 words) Essay

Macro and Micro Economic Environment of Australia

Based on the nature of these factors experts have classified them into macro and micro factors.... he central aim of the research is to identify the major macro and microeconomic factors that are capable of influencing a particular organization in Australia.... Two of the most important aspects in the context of this research are strategic marketing and macro and microenvironmental factors.... However, most of these studies fail to provide a proper understanding regarding the effects of these factors in the context of a particular country....
7 Pages (1750 words) Research Paper
sponsored ads
We use cookies to create the best experience for you. Keep on browsing if you are OK with that, or find out how to manage cookies.
Contact Us