StudentShare

Our website is a unique platform where students can share their papers in a matter of giving an example of the work to be done. If you find papers
matching your topic, you may use them only as an example of work. This is 100% legal. You may not submit downloaded papers as your own, that is cheating. Also you
should remember, that this work was alredy submitted once by a student who originally wrote it.
✕
Free
Regression Analysis Technique - Assignment Example
Summary
The "Regression Analysis Technique" paper focuses on the technique which seeks to establish the relationship that exists among variables. Through regression analysis, it is possible to develop a comprehensive understanding of the effects of a specific change in one variable on another…
- Subject: Law
- Type: Assignment
- Level: High School
- Pages: 4 (1000 words)
- Downloads: 0
- Author: citlallirobel
Extract of sample "Regression Analysis Technique"
Regression Analysis Regression is a technique that seeks to establish the relationship that exists among variables. Through regression analysis, it is possible to develop a comprehensive understanding of the effects of a specific change in one variable on another. For instance, through regression analysis it is possible to determine the impact of varying incarceration services on the satisfaction of people with the criminal justice system, sentences and legal services. This is an outlook into the different aspects of regression analysis using incarceration services as the independent variable and satisfaction with criminal justice system, sentences and legal services as dependent variables (Williams, 2009). The analysis culminates into plotting of a line of best fit, which forms the basis for evaluation of parameters such as the slope, y-intercept and correlation strength.
1. Output of the three regression analyses run on the data set is contained in the Ms Excel Attached. The output contains information in which the most pertinent elements are highlighted for easier identification. These include the R-square and the two different coefficients; the y-intercept and the slope.
2. Graphs of the regression analysis
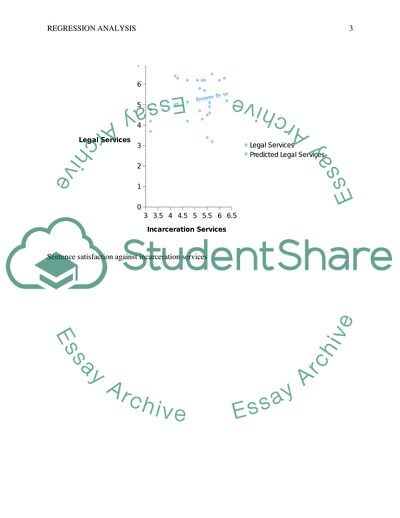
Legal Services against Incarceration services
Sentence satisfaction against incarceration services
Criminal Justice satisfaction against incarceration services
3. Slope
The slope is representative of the ratio of change in the variable on the vertical axis to that on the horizontal. Usually, the slope is the rate of change of the dependent variable with respect to change in independent variable. The slope is calculated as change in Y divided by change in X. However, the regression output provides the value of the slope of the line of best fit as one of coefficients in the ANOVA section. The following are the slopes of the respective graphs as per the results of the regression analysis:
Legal services, Sentence satisfaction, Criminal Justice Satisfaction
4. y-intercept
The y-intercept of a graph is the point at which the trend line cuts the Y-axis. This is the point at which the corresponding value of variable X is 0. The regression analysis output provides the value of the y-intercept under coefficients in the ANOVA section. The following are the respective value of y-intercepts for the three graphs plotted above:
Legal services Sentence satisfaction, Criminal Justice Satisfaction
The slope and y-intercept for the basis for evaluation of least squares regression-line equation
The least square regression line refers to the equation of the line of best fit for the variables under investigation in a regression analysis. The equation exists in the form of, where and are constants, (Y-hat) is the predicted value of the dependent variable, and is a specific value of the independent variable. The constants and represent the y-intercept and the slope of the line respectively (Peck, Olsen & Devore, 2005).
Legal services
And therefore,
Sentence satisfaction
And therefore,
Criminal Justice Satisfaction
And therefore,
5. R-squared values
R squared is an indicator of how useful the results of the regression analysis can be since it involves all the variations from the line of best fit. R-squared is a measure of how correct the regression line is in representing the data under investigation taking into consideration the value of the data point’s vertical variation from the line of best fit (Freund, Wilson & Sa, 2006). The following are the values of R-squared for the three regression analyses.
Legal services, Sentence satisfaction, Criminal Justice Satisfaction
6. Correlation strength
Correlation strength is the measure of closely related the variables are to each. The correlation strength is indicated by the co-efficient of correlation, r. This value can be obtained from the R-square which is a square of the coefficient. Irrespective of the direction of the strength of the relationship, it is possible to compare different correlation strength using the respective values of R-square since they are the squares of the respective coefficients of correlation (Freund, Wilson, & Sa, 2006). Below is an outlook into the correlation strengths of each of the graphs for criminal justice system, legal services satisfaction and sentence satisfaction.
Legal services satisfaction
As indicated by its r –square value and the direction of the graph the two variables have a positive correlation. The line of best fit has a positive value of slope, which indicates a positive direction for the variables. However, the graph has a relatively small value of R2, which implies that the corresponding value of r is small. Therefore, it is evident that there exists a weak positive relationship between legal services satisfaction and the incarceration services.
Sentence satisfaction
The direction of the graph depicts that there exists a positive linear relationship between incarceration services and sentence satisfaction. The graph has a positive slope which is indicative of a positive correlation value for the relationship. However, looking at the value of the graphs R-Square, it is small and thus a small value of the correlation coefficient. The square root of the R-square is less than 0.5 thus a weak relationship. Therefore, there exists a weak positive correlation between the variables.
Criminal Justice
The criminal justice regression line illustrates a positive relationship between the satisfaction in criminal justice and incarceration services. This is evidenced by the positive value of the slope, which is an indicator of the direction of the strength of their relationship. However, the value of R-square implies that correlation r is below 0.5, which represents a weak relationship. Therefore, there exists a weak positive strength between the satisfaction in criminal justice and incarceration services.
7. Graph with the strongest correlation coefficient
The graph with the strongest correlation coefficient is that of Criminal justice against incarceration services. The graph has an R-square value of 0.0486, which is higher than 0.0355 and 0.0295 for legal services and sentence satisfaction respectively. This implies that it has a higher value of correlation coefficient, which is obtained as the square root of the R-square.
References
Freund, R. J., Wilson, W., & Sa, P. (2006). Regression Analysis. Burlington: Elsevier.
Peck, R., Olsen, C., & Devore, J. L. (2005). Introduction to statistics and data analysis. Belmont, CA: Thomson Brooks/Cole.
Williams, F. P. (2009). Statistical Concepts for Criminal Justice and Criminology.
NJ: Upper Saddle River, Pearson Prentice Hall.
Read
More
sponsored ads
Save Your Time for More Important Things
Let us write or edit the assignment on your topic
"Regression Analysis Technique"
with a personal 20% discount.
GRAB THE BEST PAPER
