StudentShare
Contact Us
Sign In / Sign Up for FREE
Search
Go to advanced search...
Free

Business Modelling and Linear Regression Analysis - Essay Example

Cite this document
Summary
The paper "Business Modelling and Linear Regression Analysis" states that business modeling has been used for so long to solve business problems and develop strategies for the success of these businesses. There are so many models that can be used for this purpose. …
Download full paper File format: .doc, available for editing
GRAB THE BEST PAPER93.1% of users find it useful
Business Modelling and Linear Regression Analysis
Read Text Preview

Extract of sample "Business Modelling and Linear Regression Analysis"

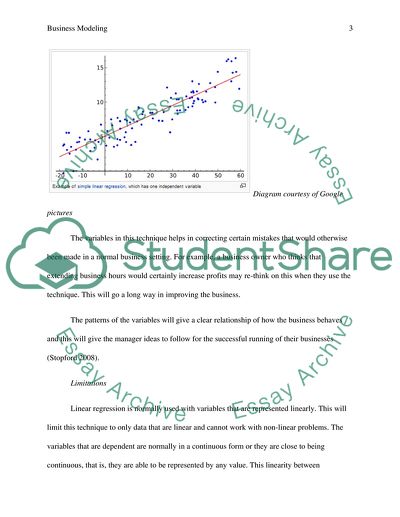
Business Modelling By Key words: Principles, Simulation Introduction Business modeling has been used for so long to solve business problems and develop strategies for the success of these businesses. There are so many models that can be used for this purpose. This paper will look at some of these models and their strengths and limitations. Linear Regression Analysis Strengths This is a technique of statistical analysis that helps business managers, economists and even business researchers forecast on the trends of their businesses in the coming future. Regression analysis will give the trends of the variables and this relationship will give a clear picture on what to expect in the future (Curwin, Slater and Eadson 2013). It also helps in reducing clustered and excessive data in a given setting to a manageable amount. It helps one to select on the precise variables that can be used in the study of managing a business. Therefore, it will help in making decisions of the business (Yao and Li 2013). Diagram courtesy of Google pictures The variables in this technique helps in correcting certain mistakes that would otherwise been made in a normal business setting. For example, a business owner who thinks that extending business hours would certainly increase profits may re-think on this when they use the technique. This will go a long way in improving the business. The patterns of the variables will give a clear relationship of how the business behaves and this will give the manager ideas to follow for the successful running of their businesses (Stopford 2008). Limitations Linear regression is normally used with variables that are represented linearly. This will limit this technique to only data that are linear and cannot work with non-linear problems. The variables that are dependent are normally in a continuous form or they are close to being continuous, that is, they are able to be represented by any value. This linearity between dependent and independent variables will not always be true since some relationships have a curved kind of representation. For example, the relationship between age and income is not linear, but curved. Income increases during early years of a person and slows down as the age of the person proceeds (Fearn 2011). Linear regression analyses the average in the relationship between independent and dependent variables. For example, when representing the relationship between the eating behavior of people and increase in their weight, this technique will represent the average weight of the food eaten with the change in their weight over time. This will not give a complete and clear description of the exact data that there is in a given situation hence there may be a misrepresentation of the data (Huang 2013). Linear regression is normally affected with variables that are on the extreme. These variables are known as outliers. They are normally high or very low variable that are scarce. For example a 120 year old making 20 million dollars or 16 year old making 200 thousand dollars are very few in a normal business setting. Therefore, these outliers when represented in in a linear regression will alter the representation thus giving false conclusion (Yao and Li 2013). Linear regression will normally be limited to numerical variables only Linear programming Disadvantages Linear programming will normally represent its data in a linear manner. This will therefore limit its usage in transportation or supply chain type of organization (Evans 2010). For example, if a supply chain manner wants to order two different types of materials for the manufacture of a given product, they might find it cheaper to order the materials from two different companies, each material from each company (Agbadudu 2006).This kind of representation, in the linear programming technique, will not be explicit as it is not linear. The purchase of material in the first company might be lower than in the second company while it may also not be constant. For a logistic company investigating the effects of increasing their fleets and how this increases their profit, using linear programming may be misleading as the increase in fleet will not always be linearly related to increase in profit. The profit may increase slightly when the fleets are bought and then level of with time. This will be a curved kind of representation. This aspect of non-linearity will not be represented in linear programming hence the model will fail in these companies (Taylor 2013). This model of linear programming will represent outputs and inputs that are in fractional forms. This representation will not always be adequate in the logistic transportation or supply chain businesses. A transportation company that wants to order for new fleets of trucks from a given truck manufacture cannot represent these fleets as fractions hence using this model will become a problem. A supply chain manager who wants to hire more people to work as distributors in the business during peak hours may find it difficult to use the linear programming method as the people cannot be represented as fractions. The number of people and trucks are always whole numbers in the real life situations. Representing them as fractions will lead to them losing their meaning (Pazmandy, 1999). Therefore, if these situations are represented in linear programming as they are, they will not sufficiently represent the data needed for the company. This shows how linear programming fails completely in representing data that are cannot be represented as fractions (Oakshott 2012). Linear programming normally limits it data representation to a given point. These limitations will drastically reduce the accuracy of its representation since it will leave out details that need to be represented in the model. For example, a business manager in a supply chain company trying to find out the best market prices for two of their product may use a linear programming. To represent this, they have to factor in so many details like the target market, their location and accessibility to the location and the capability of the target market to purchase these products. All these factors will have to be present in this research for the manager to acquire a precise picture of the best market price of their product. Linear programming, having a limitation of how far it can represent the variables, may fail to give a clear picture of these variables (Helber, Schimmelpfeng and Stolletz 2011). Monte Carlo Simulation This simulation is a technique on a daily basis in organizations where decisions for the future planning have to be made. The Monte Carlo was developed by scientists who first designed an atomic bomb. This simulation helps mangers and planners in organization look at all possible outcomes of a given decision or process that will affect the future trends of the business. With all the outcomes in display, the planner will have to choose on the best process that highly increase and at the same time reduce the costs to a minimum (Léon and Reveiz 2012). Monte Carlo simulation can be used in planning as it performs the analysis of risks that can be faced when a decision is made. This is done by building the possible models and the expected results. This will be achieved by alternating the value range for all the factors that are not certain in the given setting. For example, for a logistics planner who wants to find the best time of the year to import goods into the country will have to vary the importation trends and the demand of the good in the financial calendar. These results will then be calculated many times by the simulation using different sets of values randomly picked from the factor that are not certainly achieved. These factors make up the probability functions (Barreto and Howland 2006). These calculations may range from thousands to hundreds of thousands depending on the numbers and range of these probability functions. These Calculations will give the outcomes that can be achieved with these probability functions. The planner will then be able to choose, depending on the target of the organization, the best outcome possible. This is the best way to analyze the possible risks that can face the company and action is taken to minimize these risks during planning (Alamar 2002). In the transportation industry, Monte Carlo simulation may be used to plan for the number of fleet of vehicles needed in a given financial year. To acquire a given number of vehicles that need to be purchased in the company, the planner will enter random numbers to represent the unknown number of vehicles. The simulation will calculate the desired outcome for every number entered into the system (Schueller, Spanos and Shinozuka, 2001). With several outcomes in hand, the planner will have to choose the best number that will maximally serve all the transportation without being excess. This will help the company use its resources efficiently without spending more and in the process have the highest returns (Léon and Reveiz 2012). In the chain supply companies, this model can be used to determine the best time and worst time to order for a given raw material or supply a given product. The best time to order a material will reduce the time wasted in waiting for the product to arrive. If the raw materials arrive in the right time, production of the required products will take place adequately and the right time. This will go a long way in cutting costs associated with this delay. The products produced also have to be supplied at the right time. This will improve customer relationship since the company will deliver products at the right time. The Monte Carlo simulation plays a big part in planning and implementation of decisions that affects the company (Yoder and Kurz 2014). Unlike linear programming and linear regression, Monte Carlo can work with data that are complex in nature and are not linear. Since this simulation is software based and the calculations are worked by a computer, this way is a first and reliable way to work out decisions that will improve company production. It does not require for a person to know how its programming works. As long as one inputs data, it will give an outcome. This makes Monte Carlo simulation easy to use. This gives it an upper hand in planning for the future problems of a given institution and gives the best solutions for these problems hence minimize cost and increase profits (Scholz-Reiter and Stickel, 1996). Disadvantages of using Microsoft Excel for performing Monte Carlo simulation Microsoft Excel is normally used in the calculations of the outcomes but its usage has some limitations. Microsoft Excel has been found to produce unreliable statistical functionality in the calculation of the probability functionality (A, 2007). This always gives an outcome that does not accurately represent the expected measure of the data that was inputted. It can therefore be misguiding. These problems have been present in the different forms of Microsoft excel. The Microsoft Company has tried to resolve these problems but they still exist in the newer versions of Excel. Its programming design is normally complicated and difficult to understand. Thus problems generated can easily be ignored because it will not be easily found. This will increase the chances of producing an unreliable outcome which will affect the decisions made by planners in companies thus affect the companies’ finances  (Tennent and Friend, 2005). Since Monte Carlo simulation uses several inputs of the probability functions, inputting this in excel would be a tedious process hence will take time to implement. The calculations of the inputted variable may also be slow depending on the complexity of the given data. When data takes time to process the process of inputting a range of data will consume more time and in the process lead to increase in cost (Yoder and Kurz 2014). Monte Carlo simulation does base its calculations on historical data. With this in mind calculations done using Microsoft Excel may produce outcome that do not agree with the historical data that were produced before. This will lead to clashing of information and confusion in making decisions. The process of using Microsoft Excel must therefore be re-checked after the results have been produced to be certain of the kind of outcome that is needed. This re-checking will also consume time and increase the cost of carrying out these simulations. An expert in this field will also be needed to carry out these calculations to reduce errors in the process. In Excel, careful consideration should be taken in inputting data so that one will confuse the columns and rows (Dawande, Chandrashekaran and Kalagnanam, n.d). References A. 2007. Determination of the Optimal Manpower Size Using Linear Programming Model. Research Journal of Business Management, 11, pp.30-36. Agbadudu, A., Ogunrin, G. and Ighomereho, O. 2006. Strategic planning with input-output table: a linear programming approach. Nigeria Journal of Business Administration, 61. Alamar, B. 2002. Monte Carlo Simulation in the Valuation of High Risk Businesses. Business Valuation Review, 214, pp.186-189. Barreto, H. and Howland, F. M. 2006 Introductory Econometrics: Using Monte Carlo Simulation with Microsoft Excel, New York, Cambridge University Press  Curwin, J., Slater, R. and Eadson, D. 2013 Quantitative Methods for Business Decisions Seventh Edition, Andover, Cengage.  Dawande, M., Chandrashekaran, R. and Kalagnanam, J. n.d.. Using Linear Programming in a Business-to-business Auction Mechanism. SSRN Journal. Evans, J. R. 2010 Statistics, Data Analysis, and Decision Modelling Fourth Eidtion, Upper Saddle River, Pearson.  Fearn, T. 2011. Partial least squares regression versus multiple linear regression. NIR news, 224, p.15. Helber, S., Schimmelpfeng, K. and Stolletz, R. 2011. Setting Inventory Levels of CONWIP Flow Lines via Linear Programming. Bus Res, 41, pp.98-115. Huang, Y. 2013. Fast Censored Linear Regression. Scand J Statist, 404, pp.789-806. Léon, C. and Reveiz, A. 2012. Monte Carlo Simulation of Long-Term Dependent Processes: A Primer. Wilmott, 201260, pp.48-57. Oakshott, L. 2012 Essential Quantitative Methods for Business, Management and Finance Fifth Edition, Basingstoke, Palgrave Macmillan.  Pazmandy, G. (1999). Business Modelling. Sydney: Tekniks Publications. Scholz-Reiter, B. and Stickel, E. (1996). Business process modelling. Berlin: Springer. Schuëller, G., Spanos, P. and Shinozuka, M. (2001). Monte Carlo simulation. Lisse: A.A. Balkema. Stopford, M, 2008 Maritime Economics Third Edition, Abingdon, Routledge.  Taylor, B. W. 2013 Introduction to Management Science Eleventh Edition, Upper Saddle River, Pearson. Tennent, J. and Friend, G. (2005). Guide to business modelling. London: Profile. Yao, W. and Li, L. 2013. A New Regression Model: Modal Linear Regression. Scand J Statist, 413, pp.656-671. Yoder, S. and Kurz, M. 2014. Linear Programming Across the Curriculum. Journal of Education for Business, pp.1-6. Read More
Cite this document
  • APA
  • MLA
  • CHICAGO
(“Business modelling Essay Example | Topics and Well Written Essays - 2000 words - 1”, n.d.)
Retrieved from https://studentshare.org/information-technology/1669352-business-modelling
(Business Modelling Essay Example | Topics and Well Written Essays - 2000 Words - 1)
https://studentshare.org/information-technology/1669352-business-modelling.
“Business Modelling Essay Example | Topics and Well Written Essays - 2000 Words - 1”, n.d. https://studentshare.org/information-technology/1669352-business-modelling.
  • Cited: 0 times
sponsored ads
We use cookies to create the best experience for you. Keep on browsing if you are OK with that, or find out how to manage cookies.
Contact Us