StudentShare

Our website is a unique platform where students can share their papers in a matter of giving an example of the work to be done. If you find papers
matching your topic, you may use them only as an example of work. This is 100% legal. You may not submit downloaded papers as your own, that is cheating. Also you
should remember, that this work was alredy submitted once by a student who originally wrote it.
✕
Free
2D:4D Digit Ratio as Predictor of Self-Esteem - Case Study Example
Summary
The study " 2D:4D Digit Ratio as Predictor of Self-Esteem" explores the hypothesis of earlier findings whether the 2D:4D ratios are more in females and whether there is a correlation between the 2D:4D ratio to the attribute of self-esteem in males and females as reflected in earlier hypotheses…
- Subject: Health Sciences & Medicine
- Type: Case Study
- Level: Undergraduate
- Pages: 5 (1250 words)
- Downloads: 0
- Author: erich15
Extract of sample "2D:4D Digit Ratio as Predictor of Self-Esteem"
Relation of 2D:4D ratio as predictor of Self Esteem Background The ratio of length of one’s second finger to the length of the fourth finger (commonly referred to as 2D:4D ratio) has become an area of active importance. The ratio has a predictive power for hormonal exposure (testosterone) of a child in utero and the subsequent effects on the psychological and psychosocial trait of an individual (Williams et al, 2000). The androgen exposure is the most commonly implicated hormonal difference pertaining to the sexual dimorphism of the 2D:4D ratio, causing men to have a lower ratio than females on an average (George, 1930). The digit ratio becomes stabilized by fourteenth week of prenatal development and remains constant throughout the life span of an individual (Garn et al, 1975).
The 2D:4D ratio has been shown to be related with a wide variety of physical and psychological parameters of an individual. Endurance running has been negatively predicted by a smaller 2D:4D ratio (Manning, 2007). The smaller ratio was also predictive of success and longevity in financial traders where high stakes were involved (Coates et al, 2009). Health features like autism, breast cancer, dyslexia and myocardial infarction has been shown to be related with 2D:4D ratios (Manning et al, 2000).
Females with higher 2D:4D ratios tend to rate themselves as being more attractive and rate themselves as having more self esteem than the females who had a lower ratio (Wade et al, 2004). When the prenatal androgen exposure is high males tend to become more likely to be homosexuals (Robinson and Manning, 2000).
Aims and Objectives
The present study aimed at exploring the hypothesis of earlier findings whether the 2D:4D ratios are more in females and whether there is a correlation between the 2D:4D ratio to the attribute of self esteem in males and females as reflected in earlier hypotheses.
Methodology
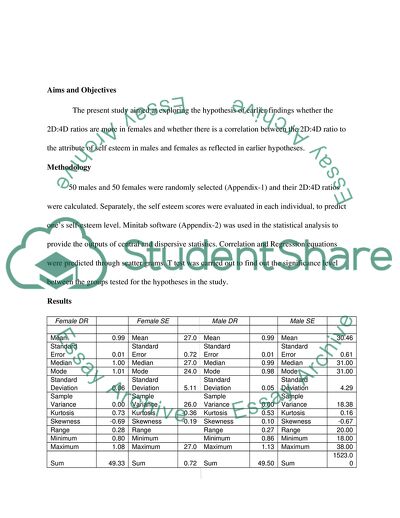
50 males and 50 females were randomly selected (Appendix-1) and their 2D:4D ratios were calculated. Separately, the self esteem scores were evaluated in each individual, to predict one’s self-esteem level. Minitab software (Appendix-2) was used in the statistical analysis to provide the outputs of central and dispersive statistics. Correlation and Regression equations were predicted through scatter grams. T test was carried out to find out the significance level between the groups tested for the hypotheses in the study.
Results
Female DR
Female SE
Male DR
Male SE
Mean
0.99
Mean
27.0
Mean
0.99
Mean
30.46
Standard Error
0.01
Standard Error
0.72
Standard Error
0.01
Standard Error
0.61
Median
1.00
Median
27.0
Median
0.99
Median
31.00
Mode
1.01
Mode
24.0
Mode
0.98
Mode
31.00
Standard Deviation
0.06
Standard Deviation
5.11
Standard Deviation
0.05
Standard Deviation
4.29
Sample Variance
0.00
Sample Variance
26.0
Sample Variance
0.00
Sample Variance
18.38
Kurtosis
0.73
Kurtosis
-0.36
Kurtosis
0.53
Kurtosis
0.16
Skewness
-0.69
Skewness
-0.19
Skewness
0.10
Skewness
-0.67
Range
0.28
Range
Range
0.27
Range
20.00
Minimum
0.80
Minimum
Minimum
0.86
Minimum
18.00
Maximum
1.08
Maximum
27.0
Maximum
1.13
Maximum
38.00
Sum
49.33
Sum
0.72
Sum
49.50
Sum
1523.00
Count
50.00
Count
27.00
Count
50.00
Count
50.00
Table 1: Represents the statistics of both the samples (DR= Digit ratio and SE= self esteem scores)
Fig 1: Represents the difference in mean 2D:4D ratio between males and females and it reflects there is no significant difference between the digit ratios between the samples evaluated in the study.
Fig 2: Represents the difference in mean self esteem scores between males and females and it reflects there is significant difference between the self esteem scores between the samples evaluated in the study. The males have a higher self esteem scores than females.
F-Test Two-Sample for Variances
F-Test Two-Sample for Variances
Female DR
Male DR
Female SE
Male SE
Mean
0.99
0.99
Mean
27.00
30.46
Variance
0.00
0.00
Variance
26.08
18.38
Observations
50.00
50.00
Observations
50.00
50.00
df
49.00
49.00
df
49.00
49.00
F
1.30
F
1.42
P(F
Read
More
sponsored ads
Save Your Time for More Important Things
Let us write or edit the case study on your topic
"2D:4D Digit Ratio as Predictor of Self-Esteem"
with a personal 20% discount.
GRAB THE BEST PAPER
