StudentShare
Contact Us
Sign In / Sign Up for FREE
Search
Go to advanced search...
Free

Business Time Series and Forecasting and Feasibility Study - Assignment Example

Cite this document
Summary
"Business Time Series and Forecasting and Feasibility Study" paper draws an appropriate graph that displays Years in Quarters against Profit (£000) for the period (2009- 2014), calculates the expected profit for all possible outcomes, and completes the critical path analysis for Telco’s new project…
Download full paper File format: .doc, available for editing
GRAB THE BEST PAPER96.5% of users find it useful
Business Time Series and Forecasting and Feasibility Study
Read Text Preview

Extract of sample "Business Time Series and Forecasting and Feasibility Study"

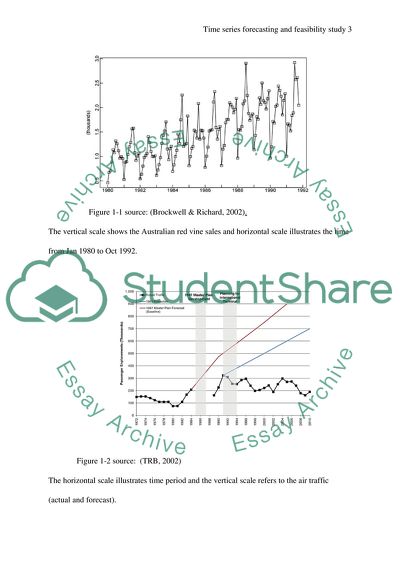
Business Time Series and Forecasting and Feasibility Study 1 What do you understand by time series forecasting? Give an example. You should not use the examples given in the PPT slides/hand-outs. You should also indicate at least two sources very clearly. A method of estimation that uses time oriented past observations to forecast the future aspects of a business to manage the future uncertainties is time series forecasting. Forecasting is said to be the essence of business. It is the basis for sales forecasting, financial forecasting and all other business-forecasting elements. Profits can be made by the businesses by only the right forecasts. Forecasting techniques covers two classes of data: quantitative technique which is an objective approach and qualitative technique that is a subjective approach. Time series forecasting is a quantitative forecasting method, which is based on the analyses of the timely sequenced data from the past to estimate the future data points. The data collected can be taken on hourly, daily, weekly, monthly, or yearly basis. Problems in forecasting the variable of interest are classified as short term, medium term, and long term. Forecasting of the events of a few time periods, such as days, weeks, or months into the future refers to the short time forecasting problems. Medium term forecasting and long term forecasting problems extend from one or two years and by many years, respectively (Box et al., July 2008). One of the examples of time series forecasting is the sales by quarter of the Apple Inc. Examples: Figure 1-1 source: (Brockwell & Richard, 2002). The vertical scale shows the Australian red vine sales and horizontal scale illustrates the time from Jan 1980 to Oct 1992. Figure 1-2 source: (TRB, 2002) The horizontal scale illustrates time period and the vertical scale refers to the air traffic (actual and forecast). 1.2. Draw an appropriate graph that displays Years in Quarters against Profit (£000) for the period (2009Q1- 2014Q4) given in the file “clothes.xlsx”. Comments: The graph illustrated the increasing trend in the profits of the company from the year 2009 to 2014 quarterly data. Clear seasonal effect can be observed from the graph. Graphical presentation shows that the sales of the company are at its peak in the fourth quarter of every year. Also, it shows the increase in the sales throughout the years. 1.3. Telco would like to forecast its future profit before making the decision to expand. To support the decision process, you are required to show: (a.) the forecasted quarterly profit for the 2015Q1 to 2015Q4 using a multiplicative method. Graphical demonstration of the Sales of Telco Ltd. for the year 2015: Comments: The representation of Telco sales profit above demonstrates continuous increase in the profit of the company from the second quarter of the year. (b.) the profit for 2015 total forecasted. Here, deseasonalize (Y) column and t (X) column are used in regression to calculate intercept and slope for the trend component. So, by using the historical forecast the profit for 2015 is forecasted: Conclusion: After estimating the Moving average (MA), Centered moving average (CMA), seasonal (St), Irregular (It), and Trend (Tt) components for the previous given data the forecast of one year ahead is projected. The total profit forecasted for 2015 is £696.83k. The highest estimated sales are in the fourth quarter of the year which is £207.71k and the lowest sales will be observed in the third quarter that is £173.15k. (c.) a graph that displays the original and forecasted profit (2009Q1 to 2015Q4). 1.4. Show the formulae you used in Excel. TELCO Ltd. A B C D E F G H I J K   t (X) Yt     Yt / CMA Seasonality Yt / St Intercept+Slope*t   Year Quarter Quarter N° Profit (£000) MA(4) CMA(4) St , It St Deseasonalize (Y) Tt (Trend) Forecast 2009 Q1 1 85       1.04 =D6/H6 =$X$28+$X$29*C6 =H6*J6   Q2 2 92       0.81 =D7/H7 =$X$28+$X$29*C7 =H7*J7   Q3 3 114 =AVERAGE(D6:D9) =AVERAGE(E8:E9) =D8/F8 0.99 =D8/H8 =$X$28+$X$29*C8 =H8*J8   Q4 4 138 =AVERAGE(D7:D10) =AVERAGE(E9:E10) =D9/F9 1.17 =D9/H9 =$X$28+$X$29*C9 =H9*J9 2010 Q1 5 126 =AVERAGE(D8:D11) =AVERAGE(E10:E11) =D10/F10 1.04 =D10/H10 =$X$28+$X$29*C10 =H10*J10   Q2 6 103 =AVERAGE(D9:D12) =AVERAGE(E11:E12) =D11/F11 0.81 =D11/H11 =$X$28+$X$29*C11 =H11*J11   Q3 7 124 =AVERAGE(D10:D13) =AVERAGE(E12:E13) =D12/F12 0.99 =D12/H12 =$X$28+$X$29*C12 =H12*J12   Q4 8 144 =AVERAGE(D11:D14) =AVERAGE(E13:E14) =D13/F13 1.17 =D13/H13 =$X$28+$X$29*C13 =H13*J13 2011 Q1 9 132 =AVERAGE(D12:D15) =AVERAGE(E14:E15) =D14/F14 1.04 =D14/H14 =$X$28+$X$29*C14 =H14*J14   Q2 10 105 =AVERAGE(D13:D16) =AVERAGE(E15:E16) =D15/F15 0.81 =D15/H15 =$X$28+$X$29*C15 =H15*J15   Q3 11 133 =AVERAGE(D14:D17) =AVERAGE(E16:E17) =D16/F16 0.99 =D16/H16 =$X$28+$X$29*C16 =H16*J16   Q4 12 165 =AVERAGE(D15:D18) =AVERAGE(E17:E18) =D17/F17 1.17 =D17/H17 =$X$28+$X$29*C17 =H17*J17 2012 Q1 13 143 =AVERAGE(D16:D19) =AVERAGE(E18:E19) =D18/F18 1.04 =D18/H18 =$X$28+$X$29*C18 =H18*J18   Q2 14 111 =AVERAGE(D17:D20) =AVERAGE(E19:E20) =D19/F19 0.81 =D19/H19 =$X$28+$X$29*C19 =H19*J19   Q3 15 143 =AVERAGE(D18:D21) =AVERAGE(E20:E21) =D20/F20 0.99 =D20/H20 =$X$28+$X$29*C20 =H20*J20   Q4 16 174 =AVERAGE(D19:D22) =AVERAGE(E21:E22) =D21/F21 1.17 =D21/H21 =$X$28+$X$29*C21 =H21*J21 2013 Q1 17 161 =AVERAGE(D20:D23) =AVERAGE(E22:E23) =D22/F22 1.04 =D22/H22 =$X$28+$X$29*C22 =H22*J22   Q2 18 124 =AVERAGE(D21:D24) =AVERAGE(E23:E24) =D23/F23 0.81 =D23/H23 =$X$28+$X$29*C23 =H23*J23   Q3 19 151 =AVERAGE(D22:D25) =AVERAGE(E24:E25) =D24/F24 0.99 =D24/H24 =$X$28+$X$29*C24 =H24*J24   Q4 20 184 =AVERAGE(D23:D26) =AVERAGE(E25:E26) =D25/F25 1.17 =D25/H25 =$X$28+$X$29*C25 =H25*J25 2014 Q1 21 165 =AVERAGE(D24:D27) =AVERAGE(E26:E27) =D26/F26 1.04 =D26/H26 =$X$28+$X$29*C26 =H26*J26   Q2 22 130 =AVERAGE(D25:D28) =AVERAGE(E27:E28) =D27/F27 0.81 =D27/H27 =$X$28+$X$29*C27 =H27*J27   Q3 23 157 =AVERAGE(D26:D29)     0.99 =D28/H28 =$X$28+$X$29*C28 =H28*J28   Q4 24 190       1.17 =D29/H29 =$X$28+$X$29*C29 =H29*J29 2015 Q1 25         1.04   =$X$28+$X$29*C30 =H30*J30   Q2 26         0.81   =$X$28+$X$29*C31 =H31*J31   Q3 27         0.99   =$X$28+$X$29*C32 =H32*J32   Q4 28         1.17   =$X$28+$X$29*C33 =H33*J33 Seasonal Component: Quarter St 1 1.04 2 0.81 3 0.99 4 1.17 Here, S1 is calculated by averaging 2009Q1, 2010Q1, 2011Q1, 2012Q1, 2013Q1, and 2014Q1. Similarly, the other 3 values for St column. Trend Component: Intercept+Slope*t Intercept= 103.8997 Slope= 2.6296 Forecast: Yt= St*Tt St: Seasonal Component Tt: Trend Component 1.5. Write a report of no more than 500 words. Your report must include seasonal movements of quarterly profit, expected quarterly average profit, annual profit and the forecasted quarterly profit for 2015. The profit of the company shows the similar pattern of behavior at the particular time of every year. From the year 2009 to the last quarter of 2014, the information depicts the firm increase in the profit. This steady increase in the sales of the product shows the positive performance of the company in the market. The graphical representation illustrates that the profit from the products of the company are in similar behavior in the specific time interval in each year. The most sales could be observed clearly in the winter season of every year. The variation in the profit of the company is in systematic pattern over all the years. Sales start to increase steadily from the second quarter and reach at its peak in the fourth quarter of the year and after the last quarter of the year the sales starts to plunge. This pattern is followed throughout the years and from this data the forecast for the future years can be evaluated. Existing nature of the profit can be followed in the future. The business cycle of the Telco Ltd. represents a seasonal model because periodicity is fixed. The sales of the company experience the regular changes, which are predictable and happen every year in the graph which covers sales from 2009 to 2014. The same pattern of profit can be forecasted, for any company who sales winter products, to jump up in the winters and drop in the summers. Companies that experiences seasonality often make the decisions in the correspondence of the seasonality for better business. In forecasting the profit for the year 2015, it is estimated that the total profit at the end of the year would be £696.83k. The sales would be increase varying till the last quarter of the year and the highest profit is estimated to be £207.71k in the fourth quarter of the year. The values are forecasted with the help of historic data and also represent the seasonal pattern illustrated from the year 2009 to 2014. The graph represents the same pattern as in preceding years. The sales started to fall in the summer season and after that it resumes the constant increase till the end of the year. Seasonal patterns of the sales and profits make it easy for the business to make decisions to give a company firm position in the market by already foreseeing the future pattern of business. Part 2: 2.1. Calculate the expected profit for all possible outcomes. Big Expansion (thousands) Small Expansion (thousands) No Expansion (thousands) 2.2. Draw a decision tree for all possible outcomes. 2.3 Advice the business (write a brief memo of no more than 200 words). The memo should be addressed to Silvia Laurence. Miss Silvia, by forecasting profit for the company for the year 2015 in regard to all possible aspects, such as profit in the face of the decision of any kind of expansion and in no expansion of the business. As it can be seen that if the company decided to make any greater expansion in business then the revenue generation will be £1245k and the cost company will be facing is £300k. After deducting the cost, the profit will be £ 825k. Simultaneously, if the company made the smaller expansion the profit would reach up to £925k that is same as resulting in any large expansions but cost faced by the company in lower. Though company would make profit in whatever decision the company make including no expansion in the business in 2015 it would be wiser to make the big expansion to make the more profit as compared to not making any kind of expansion. Part 3: Draw and complete the critical path analysis for Telco’s new project. Clearly state the ES, EF, LS, LF, the critical path and total duration of the project. Eight activities planned to complete the project of the Telco Ltd. are A, B, C, D, E. F, G, and H. The starting activity is A. In this above network four paths are drawn: First path: A B G H Second path: A B E F H Third path: A C E F H Fourth path: A D F+ H First network of activities will be taking 10+6+8+2=26 weeks to complete, second network or path would take 10+6+7+5+2= 30 weeks to complete, third path would finish in 10+4+7+5+2= 28 weeks, and fourth in 10+12+5+2= 29 weeks. In first path, task B cannot be started before completing A. Similarly in other paths the next activity is dependent on the preceding activity. Activity is something that takes some time to get done. Activities are mentioned, in the diagram, as arrows between the boxes and the letter inside the box, such as: A, B, C, D, C, G, and H is representing the activity itself. In the rectangular boxes, the upper right section indicates early finish (EF) and the bottom right is for late finish (LF). Middle upper is for early start (ES) and the middle bottom section of the box refers to late start (LS). The upper left shows the activity and the lower left is time taken by that activity to complete. The number shown at the bottom of the box is the time an activity could take to delay (Riley, 2015). (Delay Time) Critical path is the one that takes longest time duration to complete and here the critical path is second path A B E F H taking 30 weeks to end. Thus, float (slack) for tasks on Critical Path = LF – EF = 0, which means there is no choice for delaying any task on the critical path. The shortest time taking path is A B G H, which is made prominent by red arrows in the diagram. It shows activity G can be delayed for 4 weeks without disturbing the total time of the project. In addition, this path can be finish early to use the resources in completing the other activities in the project. The critical path analyses the company’s new project indicating that it will take the duration of 30 weeks for the new project to be completed. Write a memo of no more than 300 words - addressed to Silvia Laurence. Your report should include: a. the critical activities on the critical path and explain what they represent. b. The activities that can be delayed in the context of the Telco’s new project. c. As part of your conclusion – explain the usefulness of critical path analysis. (a) The critical path drawn describes the activities and the time period that would be consumed by that project to be completed. To complete the project eight steps are to be followed each of which is followed by the next activity. In reaching the goal the longest time taking activity would be A and D with 10 weeks and 12 weeks respectively while the whole project is to take 30 weeks to come to an end. (b) There is the possibility of delay in the tasks for completing the project. To identify any delay in the process the earliest and the current finish time, taken by the critical activity, should be subtracted. By subtracting the time it is observed that delay is in the following in three critical activities: i. C (2 weeks) ii. D (1 week) iii. G (4 weeks) (c) In any business plan the critical path analyses serves as an important tool for the project managers. It gives the company an advantage of properly managing the project and also helps in assessing any delays. This method ensures improvement ant efficiency of the plan. The critical path method is a project management tool that gives the manager an advantage of the knowledge of the resources needed in any particular area also the total time needed to complete the project with remaining on budget, which surly improves the productivity of the project. Conclusion: A time series forecast was used to determine the profits for one year ahead. The forecast showed Telco’s steady boost in sales in winter, such positive results only welcomed the idea of expansion. After analysis, the results indicated the company towards a large expansion in the business as the best option of the company to gain as much profit as forecasted for future, with the use of a critical path it is known that the expansion project is calculated to take 30 weeks. By projecting a big expansion in the company, the business will gain more profit and climb higher in the market. List of References Box, G.E., Jenkins, G.M. & Reinsel, G.C. (2008). Time Series Analysis: Forecasting & Control. 4th ed. Indianapolis: John Wiley and Sons. Brockwell, P.J. & Richard, D.A. (2002). Introduction to Time Series and Forecasting. 2nd ed. New York: Springer. Riley, J. (2015). Critical Path Analysis. [Online] Available at: http://beta.tutor2u.net/business/reference/critical-path-analysis [Accessed 21 May 2015]. TRB (2002). Addressing Uncertainty about Future Airport Activity Levels in Airport. Washington: Transportation Research Board. Read More
Cite this document
  • APA
  • MLA
  • CHICAGO
(Business Time Series and Forecasting and Feasibility Study Assignment Example | Topics and Well Written Essays - 1500 words, n.d.)
Business Time Series and Forecasting and Feasibility Study Assignment Example | Topics and Well Written Essays - 1500 words. https://studentshare.org/finance-accounting/1877132-time-series-forecasting-and-a-feasibility-study
(Business Time Series and Forecasting and Feasibility Study Assignment Example | Topics and Well Written Essays - 1500 Words)
Business Time Series and Forecasting and Feasibility Study Assignment Example | Topics and Well Written Essays - 1500 Words. https://studentshare.org/finance-accounting/1877132-time-series-forecasting-and-a-feasibility-study.
“Business Time Series and Forecasting and Feasibility Study Assignment Example | Topics and Well Written Essays - 1500 Words”. https://studentshare.org/finance-accounting/1877132-time-series-forecasting-and-a-feasibility-study.
  • Cited: 0 times

CHECK THESE SAMPLES OF Business Time Series and Forecasting and Feasibility Study

Use of Real Options Theory in Financial Management/Modeling

From my previous knowledge in finance and economics, I thought the best methods of forecasting and analyzing the cost of capital were the traditional methods like Net Present Value, Internal Rate of Return amongst others.... This suggests to me that the traditional discounting and forecasting tools and techniques of finance do not take into consideration, important elements of the business environment before they are invoked.... In so doing, there is the need for certain forecasting activities to be undertaken to ascertain the future worth of projects and the returns they would yield....
8 Pages (2000 words) Term Paper

Business Operations in Your Organization: Strategies for Achieving Competitive Advantage

Finally, the paper will consider the feasibility of business process integration and make recommendations on what can be applied to other... Their demand management and demand forecasting as pertains to their supply chain will be discussed with additional information from the interviews.... business Operations at Aramex: Strategies for Achieving Competitive Advantage Name: Institution: business OPERATIONS AT ARAMEX: STRATEGIES FOR ACHIEVING COMPETITIVE ADVANTAGE Company Overview Established in 1982, in addition to, providing one of the leading logistics and transportation solutions; Aramex evolved from an express operator to a globally recognized brand....
8 Pages (2000 words) Assignment

The methods and principles of accounting

The Balance Sheet shows the financial status of a business at a given point of time.... The income statement on the other hand reflects the performance of the entry over a period of time and hence it is headed as "Income Statement of Xxx Company for the year ended 31st March, 20xx.... ccounting is best known as the language of business and communicates the results of the business.... The balance sheet shows the amount of funds the owner has in the business....
5 Pages (1250 words) Essay

The Process of Event Evaluation for Event Managers

Therefore we have to consider dimensions like the social aspect of the event, the environment aspect of the event if it is a business event we have to asses the business leveraging, and also we have to evaluate the branding of the event and the impact that it has created....
11 Pages (2750 words) Coursework

Base Realignment and Closure transfers

The study will assist in the development of strategies which shall "anticipate and mitigate adverse impacts on transportation and other infrastructure".... The intent of this article is to assess the economic and transportation impacts of the Base Realignment and Closure transfers on Huntsville....
7 Pages (1750 words) Essay

A Consulting Opportunity in Any Area of Commercial

This is a time series methodology of establishing a sales' projection according to a manifesting pattern from the earlier period sales.... This research will begin with the statement that one of the most feasible consultancy projects pertain to sales forecasting.... In sales forecasting, consultancy would achieve a different route since it relies on accurate data.... It also aims at heralding sales forecasting as a less cryptic endeavor....
8 Pages (2000 words) Essay

Forecasting and business analysis

Stock market The feasibility study concludes that Tribeco would benefit by expanding to Adelaide market.... Tribeco needs to get feasibility study of Adelaide market to assure them of profitability if they invest.... As the name suggests, a feasibility study is an investigation of the practicality of an initiative.... The feasibility study concentrates on assisting answer the essential query of whether a corporation should proceed with the planned project idea....
4 Pages (1000 words) Assignment

The Current System Utilized by Tracksuits-N-Sportswear Company Limited

The module is expected to offer a solution to replenishing inventory challenge, by utilizing Materials Requirements Planning (MRP), which attempts to decrease inventory levels by advancing the precision of forecasting techniques so as to schedule production and purchasing considering the forecasted level... The system to be implemented should be an Enterprise wide system that facilitates integrated and real-time planning, production and customer response Olson, & Desheng (2008)....
11 Pages (2750 words) Case Study
sponsored ads
We use cookies to create the best experience for you. Keep on browsing if you are OK with that, or find out how to manage cookies.
Contact Us