StudentShare
Contact Us
Sign In / Sign Up for FREE
Search
Go to advanced search...
Free

Qantas Airline Annual Report Performance - Case Study Example

Cite this document
Summary
The liquidity ratios are not so high showing that the company is at a risk of liquidation (Vogel, 2007). The gearing of the company is low revealing that the debt level of the company to be…
Download full paper File format: .doc, available for editing
GRAB THE BEST PAPER95% of users find it useful
Qantas Airline Annual Report Performance
Read Text Preview

Extract of sample "Qantas Airline Annual Report Performance"

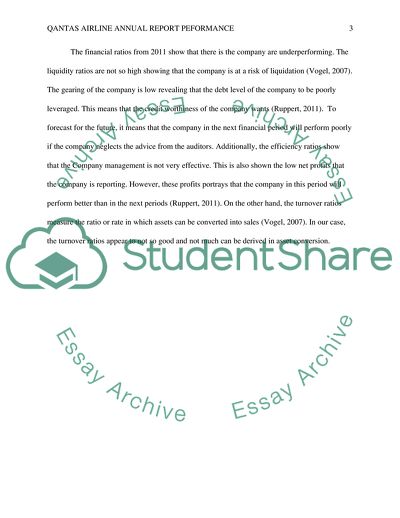
QANTAS AIRLINE ANNUAL REPORT PEFORMANCE [Insert al Affiliation] Analysis of individual years starting Year Ratio Formulae of ratio Leverage ratios/ Gearing ratio Debt ratio Total liabilities/Total Assets 14707/20858=0.7051 Debt Equity Ratio Long-term Debt/Equity or total liabilities/Equity 14707/6151=2.3910 Times Interest Cover EBITD/Interest charged 3939/261=15.092 Liquidity Ratios Current Ratio Current Assets/Current liabilities 5641/6235=0.9047 Acid Test/Quick Test C.A less Stock/C.L [5641_372]/6235=0.8451 Profitability ratios ROCE Profit before interest and tax/ Total Capital Employed 323/21452=0.0151 Operating Expense Ratio Operating Expenses*100%/Sales{Revenue} 3430*100%/12884=26.622 Gross Profit Margin Gross Profit*100/Sales 3939*100%/12884=30.573 Net Profit Margin Net Profit*100%/Sales 250*100%/12884=1.1904 Operating Profit Ratio Profit before $ Tax*100/Sales 509*100%/12884=3.9506 ROE Net Profit after Tax *100/Capital Employed 250*100%/21452=0.0117 Return on Equity Earnings Attributable to Equity Shareholders*100/Equity 250*100%/21452=0.0117 Efficiency Ratio/Activity ratios Debtor’s Turnover Credit sales/Average Debtors 547/1027=0.5326 Stock Turnover Cost of Sales/Average Stock 10674/372=28.694 Stock Conversion Period Average Stock*365/Cost of Sales 365*372/10674=12.721 Operating/Cash Turnover 365/Working Capital Cycle 365/_594=_0.6145 Fixed Asset Turnover Sales/Total Fixed Assets 14613/15217=0.9603 Market/Equity/Investment Ratios EPS Earnings attributable to shareholders/ No. of Ordinary Shares 250/2366=0.1057 Dividend per Share Total Ordinary Share Dividends/No. of Ordinary Shares 250/2366=0.1057 Dividend Retention Ratio DPS/EPS 0.1057/0.1057=1 Dividend Cover EPS/DPS 0.1057/0.1057=1 Earning yield EPS*100%/Market Price per Share 1*100%/2.6=38.462 Price Earnings Ratio Market Price per Share/Earning per Share 1*100%/2.6=38.462 The financial ratios from 2011 show that there is the company are underperforming. The liquidity ratios are not so high showing that the company is at a risk of liquidation (Vogel, 2007). The gearing of the company is low revealing that the debt level of the company to be poorly leveraged. This means that the credit worthiness of the company wants (Ruppert, 2011). To forecast for the future, it means that the company in the next financial period will perform poorly if the company neglects the advice from the auditors. Additionally, the efficiency ratios show that the Company management is not very effective. This is also shown the low net profits that the company is reporting. However, these profits portrays that the company in this period will perform better than in the next periods (Ruppert, 2011). On the other hand, the turnover ratios measure the ratio or rate in which assets can be converted into sales (Vogel, 2007). In our case, the turnover ratios appear to not so good and not much can be derived in asset conversion. Year 2012 Ratio Formulae of ratio Leverage ratios/ Gearing ratio Debt ratio Total liabilities/Total Assets 15289/21178=0.7219 Debt Equity Ratio Long-term Debt/Equity or total liabilities/Equity 15289/5889=2.5962 Times Interest Cover EBITD/Interest charged 4181/331=12.631 Liquidity Ratios Current Ratio Current Assets/Current liabilities 5460/7118=0.7671 Acid Test/Quick Test C.A less Stock/C.L [5460-376]/7118=0.7142 Profitability ratios ROCE Profit before interest and tax/ Total Capital Employed -349/22836=0.0153 Operating Expense Ratio Operating Expenses*100%/Sales{Revenue} 3975*100/14528=27.361 Gross Profit Margin Gross Profit*100/Sales 4181*100/14528=28.779 Net Profit Margin Net Profit*100%/Sales -245*100%/14528=-1.6864 Operating Profit Ratio Profit before $ Tax*100/Sales 206*100%/14528=1.4180 ROE Net Profit after Tax *100/Capital Employed -245*100%/22836=-0.0107 Return on Equity Earnings Attributable to Equity Shareholders*100/Equity -245*100%/22836=-0.0107 Efficiency Ratio/Activity ratios Debtor’s Turnover Credit sales/Average Debtors 645/1111=0.5806 Stock Turnover Cost of Sales/Average Stock 11543/376=30.699 Stock Conversion Period Average Stock*365/Cost of Sales 365*376/11543=11889 Operating/Cash Turnover 365/Working Capital Cycle 365/-1658=-0.2201 Fixed Asset Turnover Sales/Total Fixed Assets 15724/20618=O.7626 Market/Equity/Investment Ratios EPS Earnings attributable to shareholders/ No. of Ordinary Shares -245/2265=-0.1082 Dividend per Share Total Ordinary Share Dividends/No. of Ordinary Shares -245/2265=-0.1082 Dividend Retention Ratio DPS/EPS 0.1082/0.1082=1 Dividend Cover EPS/DPS 0.1082/0.1082=1 Earning yield EPS*100%/Market Price per Share 1*100%/2.6=38.462 Price Earnings Ratio Market Price per Share/Earning per Share 1*100%/2.6=38.462 Financial ratios prove to be deteriorating and they are decreasing in comparison to the previous year. Additionally, the company has reported lower profit in comparison to the previous year. The gearing of the company has reduced as portrayed in the financial analysis (Ruppert, 2011). Conversely, the profitability ratios are reducing compared to 2011 and this means that the company is posting reduced incomes and predicts further dismay. Additionally, the efficiency of the firm has reduced as portrayed in our computations and this proves the efficiency in relation to shareholders wealth maximization is declining. Lower profits have also been reported in this analysis. Furthermore, the turnover ratios are reducing meaning that the ability of the assets in being converted into sales is decreasing. Year 2013 Ratio Formulae of ratio Leverage ratios/ Gearing ratio Debt ratio Total liabilities/Total Assets 14192/20032=0.7085 Debt Equity Ratio Long-term Debt/Equity or total liabilities/Equity 14192/5840=2.4301 Times Interest Cover EBITD/Interest charged 4165/265=15.717 Liquidity Ratios Current Ratio Current Assets/Current liabilities 4961/6647=0.7464 Acid Test/Quick Test C.A less Stock/C.L [4961_364]/6647=0.6916 Profitability ratios ROCE Profit before interest and tax/ Total Capital Employed 11/21718=0.00056 Operating Expense Ratio Operating Expenses*100%/Sales{Revenue} 3897*100%/14608=26.677 Gross Profit Margin Gross Profit*100/Sales 4168*100%/14608=28.538 Net Profit Margin Net Profit*100%/Sales 272*100%/14608=1.8620 Operating Profit Ratio Profit before $ Tax*100/Sales 1*100%/14608=0.0069 ROE Net Profit after Tax *100/Capital Employed 1/21718=0.000046 Return on Equity Earnings Attributable to Equity Shareholders*100/Equity 1/21718=0.000046 Efficiency Ratio/Activity ratios Debtor’s Turnover Credit sales/Average Debtors 640/1436=0.4457 Stock Turnover Cost of Sales/Average Stock 11608/364=31.89 Stock Conversion Period Average Stock*365/Cost of Sales 365*364/11608=11.446 Operating/Cash Turnover 365/Working Capital Cycle -365/2265=-0.1611 Fixed Asset Turnover Sales/Total Fixed Assets 15777/15071=1.0468 Market/Equity/Investment Ratios EPS Earnings attributable to shareholders/ No. of Ordinary Shares 1/2246=0.00045 Dividend per Share Total Ordinary Share Dividends/No. of Ordinary Shares 1/2246=0.00045 Dividend Retention Ratio DPS/EPS 0.00045/0.00045=1 Dividend Cover EPS/DPS 0.00045/1=0.000045 Earning yield EPS*100%/Market Price per Share 0.00045*100%/2.6=0.0.173% Price Earnings Ratio Market Price per Share/Earning per Share 2.6/0.00045=5777.78 The financial ratios in this year are adverse and portrays that the financial position of the company to be underperforming. Additionally, the company has operated at loss meaning that the business is exposed to a greater risk of liquation than in previous (Ruppert, 2011). The efficiency ratios in our analysis are negative proving that the management is not effective and therefore, the optimality of shareholders wealth maximization among other goals of a firm is questionable. The turnovers in this year show that the company is incapable of converting assets into sales as shown their ratios. This means that the assets have deteriorated to great extent hence business underperformance (Ruppert, 2011). Year 2014 Ratio Formulae of ratio Leverage ratios/ Gearing ratio Debt ratio Total liabilities/Total Assets 14452/17318=0.8345 Debt Equity Ratio Long-term Debt/Equity or total liabilities/Equity 14452/2886=5.0076 Times Interest Cover EBITD/Interest charged 3424/246=13.919 Liquidity Ratios Current Ratio Current Assets/Current liabilities 4932/7525=0.6554 Acid Test/Quick Test C.A less Stock/C.L [4932-317]/7525=0.6133 Profitability ratios ROCE Profit before interest and tax/ Total Capital Employed -3976/19911=0.1997 Operating Expense Ratio Operating Expenses*100%/Sales{Revenue} 3902*100%/14197=27.485 Gross Profit Margin Gross Profit*100/Sales 3424*100%/14197=24.118 Net Profit Margin Net Profit*100%/Sales -478*100%/14197=3.3669 Operating Profit Ratio Profit before $ Tax*100/Sales -2843*100%/14197=-20.025 ROE Net Profit after Tax *100/Capital Employed -2843/19911=-0.1428 Return on Equity Earnings Attributable to Equity Shareholders*100/Equity -2843/19911=-0.1428 Efficiency Ratio/Activity ratios Debtor’s Turnover Credit sales/Average Debtors 613/1196=0.5125 Stock Turnover Cost of Sales/Average Stock 11928/317=37.638 Stock Conversion Period Average Stock*365/Cost of Sales 317*365/11928=9.7003 Operating/Cash Turnover 365/Working Capital Cycle 365/-2593=-0.1408 Fixed Asset Turnover Sales/Total Fixed Assets 15352/12386=1.2395 Market/Equity/Investment Ratios EPS Earnings attributable to shareholders/ No. of Ordinary Shares -2843/1110=-2.5613 Dividend per Share Total Ordinary Share Dividends/No. of Ordinary Shares -2843/1110=-2.5613 Dividend Retention Ratio DPS/EPS -2.5613/-2.5613=1 Dividend Cover EPS/DPS -2.5613/1=-2.5613 Earning yield EPS*100%/Market Price per Share -2.5613*100%/2.6=-98.5112 Price Earnings Ratio Market Price per Share/Earning per Share 2,6/-2.5613=-1.0151 The financial ratio in 2014 have greatly deteriorated showing that the company is a threat of being kicked out of the market by competitors. Additionally, this portrays the overreliance of debt financing as shown in the leverage ratios that are totally insignificant and in some case negative. Furthermore, the profitability ratios in this period are negative and therefore the stockholders cannot be paid their dividends (Ruppert, 2011). Additionally, no retained earnings can be kept by the business and therefore the company will be under taxed. It is therefore not economical to operate this firm if necessary remedies are not put into place. The gearing ratio of this company at this period shows that are very poor and the credit worthiness is thereby proven to be very low (Gowthorpe, 2007). Furthermore, the efficiency of the company at this financial period is very low as proved in the market ratios. The rationale, behind this is about how well the management is focusing on the fundamental goals of a firm. To conclude, the management needs to be put strategies that will work best for the interest of shareholders (Gowthorpe, 2007). Combined Ratio Analysis for Qantas Airline 2011-2014 Ratio Formulae of ratio 2011 2012 2013 2014 Leverage ratios/ Gearing ratio Debt ratio Total liabilities/Total Assets 14707/20858=0.7051 15289/21178=0.7219 14192/20032=0.7085 14452/17318=0.8345 Debt Equity Ratio Long-term Debt/Equity or total liabilities/Equity 14707/6151=2.3910 15289/5889=2.5962 14192/5840=2.4301 14452/2886=5.0076 Times Interest Cover EBITD/Interest charged 3939/261=15.092 4181/331=12.631 4165/265=15.717 3424/246=13.919 Liquidity Ratios Current Ratio Current Assets/Current liabilities 5641/6235=0.9047 5460/7118=0.7671 4961/6647=0.7464 4932/7525=0.6554 Acid Test/Quick Test C.A less Stock/C.L [5641-372]/6235=0.8451 [5460-376]/7118=0.7142 [4961_364]/6647=0.6916 [4932-317]/7525=0.6133 Profitability ratios ROCE Profit before interest and tax/ Total Capital Employed 323/21452=0.0151 -349/22836=0.0153 11/21718=0.00056 -3976/19911=0.1997 Operating Expense Ratio Operating Expenses*100%/Sales{Revenue} 3430*100%/12884=26.622 3975*100/14528=27.361 3897*100%/14608=26.677 3902*100%/14197=27.485 Gross Profit Margin Gross Profit*100/Sales 3939*100%/12884=30.573 4181*100/14528=28.779 4168*100%/14608=28.538 3424*100%/14197=24.118 Net Profit Margin Net Profit*100%/Sales 250*100%/12884=1.1904 -245*100%/14528=-1.6864 272*100%/14608=1.8620 -478*100%/14197=3.3669 Operating Profit Ratio Profit before $ Tax*100/Sales 509*100%/12884=3.9506 206*100%/14528=1.4180 1*100%/14608=0.0069 -2843*100%/14197=-20.025 ROE Net Profit after Tax *100/Capital Employed 250*100%/21452=0.0117 -245*100%/22836=-0.0107 1/21718=0.000046 -2843/19911=-0.1428 Return on Equity Earnings Attributable to Equity Shareholders*100/Equity 250*100%/21452=0.0117 -245*100%/22836=-0.0107 1/21718=0.000046 -2843/19911=-0.1428 Efficiency Ratio/Activity ratios Debtor’s Turnover Credit sales/Average Debtors 547/1027=0.5326 645/1111=0.5806 640/1436=0.4457 613/1196=0.5125 Stock Turnover Cost of Sales/Average Stock 10674/372=28.694 11543/376=30.699 11608/364=31.89 11928/317=37.638 Stock Conversion Period Average Stock*365/Cost of Sales 365*372/10674=12.721 365*376/11543=11889 365*364/11608=11.446 317*365/11928=9.7003 Operating/Cash Turnover 365/Working Capital Cycle 365/-594=-0.6145 365/-1658=-0.2201 -365/2265=-0.1611 365/-2593=-0.1408 Fixed Asset Turnover Sales/Total Fixed Assets 14613/15217=0.9603 15724/20618=O.7626 15777/15071=1.0468 15352/12386=1.2395 Market/Equity/Investment Ratios EPS Earnings attributable to shareholders/ No. of Ordinary Shares 250/2366=0.1057 -245/2265=-0.1082 1/2246=0.00045 -2843/1110=-2.5613 Dividend per Share Total Ordinary Share Dividends/No. of Ordinary Shares 250/2366=0.1057 -245/2265=-0.1082 1/2246=0.00045 -2843/1110=-2.5613 Dividend Retention Ratio DPS/EPS 0.1057/0.1057=1 0.1082/0.1082=1 0.00045/0.00045=1 -2.5613/-2.5613=1 Dividend Cover EPS/DPS 0.1057/0.1057=1 0.1082/0.1082=1 0.00045/1=0.000045 -2.5613/1=-2.5613 Earning yield EPS*100%/Market Price per Share 1*100%/2.6=38.462 1*100%/2.6=38.462 0.00045*100%/2.6=0.0.173% (2.561*100%)/2.6=-98.5112 Price Earnings Ratio Market Price per Share/Earning per Share 1*100%/2.6=38.462 1*100%/2.6=38.462 2.6/0.00045=5777.78 2.6/-2.5613=-1.0151 For a firm to prove its status and whether it is either underperforming or performing favorably it must conduct financial through use of ratios which usually establishes relationship between various economic values and aid in ascertainment of the financial status of accompany (Dunn, 2010). Moreover, the analysis of the financial statements and income statements is conducted through these ratios analyzes that compares and quantifies relationship existing in those variables in the statement of affairs and balance sheet. Additionally, reports of ratio analysis are useful because they give a fair and true account in the financial status, regarding inventory turnover and the capability to meeting both long-term and short-term liquidity issues (Gowthorpe, 2007). However, the principal shortcoming is that they are limited in the scope of coverage and covers the economic aspects of performance. Additionally it is helpful in the determination of the existing relationship between the financial, economic values and can aid in the ascertainment of the economic status of an entity. Furthermore, this analysis in the industrial analysis provides a precise and frank and truthful financial and economic account on the present position of the company, regarding turnovers and capabilities in meeting both long-run and short-run liabilities. For instance, users such as company management, customers, stockholders, creditors among others usually have an interest in financial reporting and analysis (Dunn, 2010). A good example is where the management uses the information from the ratio analysis determines the liquidity position of a corporate and the level of struggling in meeting working capital and finance for example, short-term loan, overdraft among others to overcome the shortcoming. However, the primary drawbacks of ratio analysis are that they give only pure financial focus of the current and previous business performance and, therefore, fail to provide qualitative information about the performance (Gowthorpe, 2007). Apparently, this may, therefore, reflect defective ratio but useful in forecasting and trend analysis such as when the leverage of a company is improving or declining. There are many users who are interested in knowing the performance of the enterprise through analysis of the financial reports and statements (Dunn, 2010). Additionally, creditors, shareholders, staff, and the government among others are usually investigating the state of affairs of the company to assess the leverage, profitability, efficiency and the liquidity position of an enterprise (Vogel, 2007). Firstly, the Liquidity ratios measure the ability of a business in meeting its short run maturity obligations and assess its credit position and the level it can use debt capital as a source of finance. The lower ratio portrays that the company is at greater liquidity risk. In this case, this company is operating in dismay, and it is on its way to liquidation if its current status does not improve (Dunn, 2010). The trend analysis shows that the liquidity ratio in the year 2011 was higher, and it went on reducing up uniformly to 2014 when it deteriorated. This shows that the company was previously performing better. Secondly, the gearing (leverage) ratio usually measures the optimality to which an entity uses the assets financed by debt. Like liquidity ratio, they measure the degree of entity’s financial risk. The higher rate will portray a greater risk. Gearing is, therefore, the relationship between equity capitals: debt capitals (Dunn, 2010). For instance, the gearing of this company was decreasingly constantly from 2011-14, showing that the company was at a higher debt risk in 2014 than in the previous years. Additionally, the company in 2013 and 2014 was operating at a loss. It is in 2014 that Qantas Airline made the greatest net loss of above $3000 M. Thirdly, the activity ratios (turnovers) measure the degree of how effectively and efficiently the firm is using its assets in the generation of revenue or income. This means that the company’s management was more efficient in 2011, and this went on reducing as years went by. The turnovers were highest in the year 2011 and lowest in 2014. The management should, therefore, be questionable about the operations of the company (Dunn, 2010). Additionally, this shows how effective and efficient the company is using its income generating assets. Also, they can give an indication of the ratio of conversion of property into sales (Ruppert, 2011). It can, therefore, be forecasted that the company’s continuity is compromised and at a risk if nothing is done for its betterment considering the welfare of shareholders wealth maximization (Bull, 2008). Fourthly, the profitability ratios usually measure the efficiency and effectiveness of the management in the maximization of shareholders wealth, profit maximization among other goals of a firm (Dunn, 2010). Apparently, they show how well and successful the management has been utilizing their potentials in the generation of profits and welfare of shareholders wealth maximization. Moreover, the profitability of this company is declining as proven in its liquidity ratios (Gowthorpe, 2007). Additionally, the business has been making losses for two years that are 2013 and 2014. The worst condition was in 2014 when its liquidity ratios were negative. Qantas Airline is thereby in the process of being kicked out of the market (Bull, 2008). Moreover, an investigation needs to be carried to access the situation, and necessary remedies need to be implemented (Bragg, 2000). Additionally, the competitiveness of the company is seen to be deteriorating continuously over the four years (Dunn, 2010). This means that, Qantas is, for instance, facing unfavorable completion in the market. Lastly, the equity or ratios on investments usually evaluates the company’s performance through determination of the firm’s policies on dividends, both the theoretical and market value of the firm’s securities and in forecasting of the bonus and right issue of equities (Bull, 2008). In conclusion, ratios prove to be efficient and effective in the financial analysis of the financial reports of a firm. However, they have various limitations that make them be complicated and sometimes partially irrelevant. For example, they are too subjective, ambiguous and in case a firm is a monopoly it is hard to analyze the entity’s performance and compare it with similar companies that are in competition in the same market. Reference List Bragg, S. M. (2000). Financial analysis: A controllers guide. New York: Wiley. Bull, R. (2008). Financial ratios: How to use financial ratios to maximise value and success for your business. Oxford: CIMA. Dunn, J. (2010). Financial reporting and analysis. Hoboken, NJ: Wiley. Gowthorpe, C. (2007). Financial Analysis. Burlington: Elsevier Science & Technology. Ruppert, D. (2011). Statistics and data analysis for financial engineering. New York: Springer. Vogel, H. L. (2007). Entertainment industry economics: A guide for financial analysis. Cambridge: Cambridge University Press. APPENDIX Appendix 1 Appendix 2 Read More
Cite this document
  • APA
  • MLA
  • CHICAGO
(Qantas Airline Annual Report Peformance Essay Example | Topics and Well Written Essays - 3000 words, n.d.)
Qantas Airline Annual Report Peformance Essay Example | Topics and Well Written Essays - 3000 words. https://studentshare.org/finance-accounting/1876384-qantas-airline-annual-report-peformance
(Qantas Airline Annual Report Peformance Essay Example | Topics and Well Written Essays - 3000 Words)
Qantas Airline Annual Report Peformance Essay Example | Topics and Well Written Essays - 3000 Words. https://studentshare.org/finance-accounting/1876384-qantas-airline-annual-report-peformance.
“Qantas Airline Annual Report Peformance Essay Example | Topics and Well Written Essays - 3000 Words”. https://studentshare.org/finance-accounting/1876384-qantas-airline-annual-report-peformance.
  • Cited: 0 times
sponsored ads
We use cookies to create the best experience for you. Keep on browsing if you are OK with that, or find out how to manage cookies.
Contact Us