StudentShare
Contact Us
Sign In / Sign Up for FREE
Search
Go to advanced search...
Free

Ratio Analysis & Theoretical Framework - Minimax Plc - Case Study Example

Cite this document
Summary
The paper delves into the financial report of Minimax_Plc during the 2012 as well as 2013 accounting periods. The paper shows the company generated revenues, gross profits, and net…
Download full paper File format: .doc, available for editing
GRAB THE BEST PAPER91.5% of users find it useful
Ratio Analysis & Theoretical Framework - Minimax Plc
Read Text Preview

Extract of sample "Ratio Analysis & Theoretical Framework - Minimax Plc"

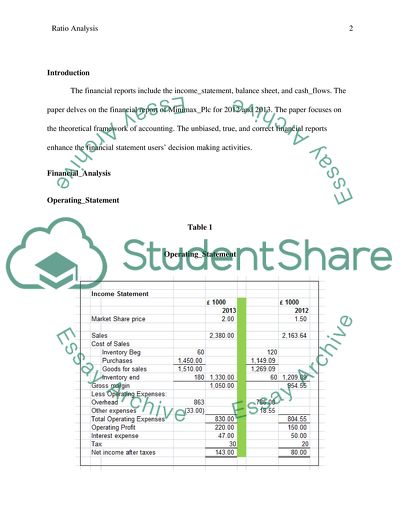
March 26, Ratio_Analysis Summary The financial reports normally include the income_ ment, balance sheet, as well as cash_flows. The paper delves into the financial report of Minimax_Plc during the 2012 as well as 2013 accounting periods. The paper shows the company generated revenues, gross profits, and net profits during the 2012 and 2013 accounting periods. Using the two year actual financial performance, it is highly recommended that the company set up new outlets in new market segments or locations. The theoretical framework of accounting requires that the financial reports must be objective, true, and correct. The financial reports must comply with the provisions of the promulgated international_accounting standards. The rules-based financial reports ensure better understanding of the unbiased financial reports accounts. The exercise of the rights ensures the shareholders retain their original stock percentage of the company’s outstanding stocks. Evidently, the unbiased, true, correct, valid, relevant, and time financial reports enhance the financial statement users’ decision making activities. Introduction The financial reports include the income_statement, balance sheet, and cash_flows. The paper delves on the financial report of Minimax_Plc for 2012 and 2013. The paper focuses on the theoretical framework of accounting. The unbiased, true, and correct financial reports enhance the financial statement users’ decision making activities. Financial_Analysis Operating_Statement Table 1 Operating_Statement The above table 1 shows the operating statement of Minimax_Plc. For 2013, the sales_ output is favourably higher than the 2012 sales output (Weygand et al, 2013, p. 22). Similarly, the 2013 gross_margin is favourably better than the 2012 gross_margin. Further, the 2013 operating_profit is favourably better than the 2012 offering_profit. Furthermore, the company’s 2013 net_income after_tax ratio is favourably higher than the 2012 net_income after_tax ratio. As expected, the increase in the operating performance of the company during 2013 over the prior 2012 accounting period contributed to the rise in the company’s stock_market share_price. The 2013 stock_market share_price is favourably higher than the 2012 stock_market share_price. Comparing the overall operating statement performance of the company for the two consecutive years, 2012 and 2013, there is an increasing trend in the company’s future operating performance. The increasing trend means that the sales_figure for 2014 will be higher than the sales_figure for 2013. The increasing trend similarly means that the gross_margin for 2014 will be better than the gross_margin for 2013. The increasing trend likewise indicates that the operating_profit for 2014 will be significantly higher than the operating_profit for 2013. The increasing trend shows that the net_income_after taxes output for 2014 will be higher than the net_income_after taxes output for 2013. Balance_sheet Table 2 Balance_Sheet The above table 2 shows the balance sheet performance of Minimax_Plc (Kiesoet al., 2012, p.16). The balance sheet indicates that the 2013 noncurrent_assets are favourably higher than the 2012 noncurrent_assets amount. Further, the same balance sheet affirms that the 2013 current_assets are favourably better than the 2012 current_assets amount. Furthermore, the same balance sheet shows that the 2013 shareholders’_equity figure is favourably higher than the 2012 shareholders’_equity figure. Similarly, the balance sheet indicates that the 2013 total_liabilities figure is favourably better than the 2012 total_liabilities figure. In addition, the balance sheet shows that the £ 30 per share 2013 dividends figure given to the shareholders on_record during the distribution of the declared and distributed cash_dividends during 2013 is favourably higher than the dividends figure given to the shareholders on_record during the distribution of the declared and distributed cash_dividends during the 2012 accounting period, £ 20 per share. Financial_Statement Analysis Financial_Current_ Ratio Table 3 Financial_ Current_ Ratio The above table 4 shows the financial_current ratio performance of Minimax_Plc during 2013 and 2012. The above table indicates that the 2013 current_ratio is 0.46. This is unfavourably lower than the 2012 current_ratio performance, 0.70. The ratio for the two year period indicates the company has more current assets available to pay for the currently maturing current_debts during the 2012 accounting period than the 2013 accounting period. In order to increase the company’s current_ratio performance during 2014, the company can increase its current_assets figure 2014 or decrease its current_liabilities during 2014 (Elliott, 2011, p. 305). Financial_Gross_Profit Ratio Table 4 Finanncial_Gross_ Profit Ratio The above table shows the financial_gross_margin performance of Minimax_Plc during 2013 and 2012 (Jain, 2010, p. 18). The above table indicates that the 2013 gross_profit margin_performnace ratio is 44.1 percent. This is the same as the 2012 financial_gross profit_margin ratio performance, 44.1 percent. The ratio for the two year period affirms the company is able to generate a profitable business operation during both 2012 and 2013 accounting periods. In order to increase the company’s current_ratio performance during 2014, the company can increase its gross_profit margin 2014 by increasing its gross_profit figure during 2014. Financial_Profit_ ratio Table 5 Financial_Profit_ ratio The above table 5 indicates the financial_profit performance of Minimax_Plc during 2013 and 2012, the company’s profitability output. The 2013 profit_margin_performnace ratio is 6 percent. The 2013 output is financially higher than the 2012 financial_ margin ratio_performance, 3.7 percent. The ratio for the two year period affirms the company was able generate higher profit_margin during both 2013 than the company’s generating of its 2012 profit_marging ratio_performance during 2012. In order to increase the company’s current_ratio performance during 2014, the company can increase its net_profit margin 2014 by increasing its net_profit figure during 2014 (Jain, 2010, p. 18). Financial_Inventory_turnover _ratio Table 6 Financial_Inventory_turnover _ratio The above table6 indicates the financial_inventory turnover_ratio performance of Minimax_Plc during 2013 and 2012. The 2013 financial_inventory turnover_ratio performance is 1108.3 times. The 2012 output is financially higher than the 2013 financial_ inventory turnover_ratio_performance, 2015.2 times. The ratio for the two year period affirms the company is better able to convert its inventories to receivables and consequently cash during 2012 than during 2013. In order to increase the company’s financial_inventory turnover_ratio performance during 2014, the company can increase the sales of the store inventory items during 2014 (Jain, 2010, p. 26). Financial_Accounts_receivable Turnover_ ratio Table 7 Financial_Accts_receivable Turnover_ ratio The above table7 indicates the financial_accts_receivable turnover_ ratio performance of Minimax_Plc during 2013 and 2012. The 2013 financial_accts_receivable turnover_ ratio performance is 1161 percent (Jain, 2010, p. 52). The 2013 output is favourably higher than the 2012 financial_accts_receivable turnover_ ratio performance, 1030.3 percent. The ratio for the two year period affirms the company is able to convert its receivables into cash better during 2013 than during the prior 2012 accounting period. The ratio shows how the company is able to manage its credit sales transactions, in terms of collection. In order to increase the company’s financial_accts_receivable turnover_ ratio performance e during 2014, the company can increase the credit_sales output and reduce its outstanding_receivables amounts during 2014 than the prior 2013 accounting period. Financial_days_to_collect_receivables ratio Table 8 Financial_days_to_collect_receivables ratio The above table 8 indicates the financial_days_to_collect_receivables ratio performance of Minimax_Plc during 2013 and 2012 (Jain, 2010, p. 47). The 2013 financial_days_to_collect_receivables ratio performance is 31.4 days. The 2013 output is favourably lesser than the 2012 financial_days_to_collect_receivables ratio performance, 35.4 days. The ratio for the two year period shows the company is able collect to convert its receivables into cash better during 2013 than during the prior 2012 accounting period. In order to increase the company’s financial_days_to_collect_receivables ratio performance during 2014, the company can reduce the number of days collecting the outstanding receivables amounts during 2014 than the prior 2013 accounting period. Financial_return on_assets_ratio Table 9 Financial_return on_assets_ratio The above table 9 indicates the financial_return on_assets_ratio performance of Minimax_Plc during 2013 and 2012 (Jain, 2010, p. 45). The 2013 financial_return on_assets_ratio performance is 4.2 percent. The 2013 output is favourably higher than the 2012 financial_return on_assets_ratio performance, 2.7 percent. The ratio for the two year period affirms the company is better able to maximize the use of the company’s total assets to generate the net profit amounts during 2013 than 2012 accounting period. In order to increase the company’s financial_return on_assets_ratio performance during 2014, the company must increase its net_profit after_tax outputs during 2014 than the prior 2013 accounting period. Financial_debt_ratio Table 10 Financial_debt_ratio The above table 10 shows the financial_debt ratio_performance of Minimax_Plc during 2013 and 2012 (Jain, 2010, p. 15). The 2013 financial_debt ratio_performance is 31 percent. The ratio indicates how much of the total assets came from liabilities. The 2013 output is unfavourably lower than the 2012 financial_debt ratio_performance, 32.2 percent. The ratio for both 2012 and 2013 affirms the company should increase the liabilities amount 2013 in order to improve the same year’s financial_debt ratio_performance. In order to increase the company’s financial_debt ratio_performance during 2014, the company must increase its total_liabilities amounts during 2014 than the prior 2013 accounting period. Financial_Times Interest_earned_ratio Table 11 Financial_Times Interest_earned_ratio The above table 11 indicates the financial_times interest_earned_ratio performance of Minimax_Plc during 2013 and 2012 (Jain, 2010, p. 35). The 2013 financial_times interest_earned_ratio performance is 468.1 percent. The 2013 performance is favourably higher than the 2012 financial_times interest_earned_ratio performance, 300 percent. The financial ratio for the two year period indicates the company is better able to maximize the interest payments to generate the operating_income during 2013 accounting compared to the prior 2012 accounting period. In order to increase the company’s financial_times interest_earned_ratio performance during 2014, the company must increase its operating_ or reduce its interest expense amount during 2014 than the prior 2013 accounting period. Financial_debto to_equity_ratio Table 12 Financial_debto to_equity_ratio The above table 12 indicates the financial_debto to_equity_ratio performance of Minimax_Plc during 2013 and 2012 (Jain, 2010, p. 13). The 2013 financial_debto to_equity_ratio performance is 44.8 percent. The 2013 performance is unfavourably lower than the 2012 financial_debto to_equity_ratio performance, 47.5 percent. The financial ratio for 2012 and 2013 period indicates the company used a better leverage capital structure during 2013 accounting period compared to 2012 accounting period. In order to increase the company’s financial_debto to_equity_ratio performance during 2014, the company must increase total_liabilities or reduce its shareholders_equity amount during 2014 than the prior 2013 accounting period. Financial_Quick_ratio Table 13 Financial_Quick_ratio The above table 13 indicates the financial_quick ratio_performance of Minimax_Plc during 2013 and 2012 (Jain, 2010, p. 44). Ratio shows the amount of liquid_assets used to pay for the currently maturing debts. The liquid assets are cash, accts receivable, & marketable securities. The 2013 financial_quick ratio_performance is 24.4 percent. The 2013 financial_quick ratio_performance is unfavourably lower than the 2012 financial_quick ratio_performance, 58 percent. The financial ratio for both 2012 and 2013 period shows the company lower 2013 quick_assets amount allocated to pay the currently maturing debts compared to 2012 accounting period. In order to increase the company’s financial_quick ratio_performance during 2014, the company must increase cash, accts receivable, or marketable_securities amount during 2014 than the prior 2013 accounting period. The company can also reduce its current liabilities during 2014 from the original 2013 amount, £ 820,000. Part II ( c ) Shareholders’_rights issue. Shareholders’ rights allow the current shareholders the right to acquire a proportionate amount of the company’s offered new shares of stocks (Bender, 2013, p. 137). For example, shareholder A hold 10 percent of the number of outstanding common shares. The company offers 1,000 shares to its shares on record. Consequently, Shareholder A has the right to acquire 10 percent of the 1,000 offers shares, 100 shares. The rights allow the current shareholder the right to main their current shareholder percentage. If Shareholder A does not exercise his right to acquire the allotted 100 shares, the company may offer the 100 shares to new investors in the company or to the other current shareholders. Double Entry exercise of Rights: Debit Credit Cash xxx Shareholder Capital xxx To record exercise of rights The above journal entry shows the company will record a cash debit for the amount paid for exercised stocks. The credit to shareholder capital means that Shareholder A owns an additional number of stocks. Further, there are ramifications in the stock rights issue. First, the shareholder must find funds needed to acquire the allocated number of stocks within a limited time period. If the shareholder cannot find the funds needed to acquire the allocated shares of stocks, the shareholder will forfeit the right to acquire the allocated stocks in the future. Likewise, the non-exercise of the stock rights will reduce the shareholders’ number of stock ownership percentage, reducing Shareholder A’s percentage to lower than the current 10 percent of the total outstanding shares of stocks (Bonham, 2012, p.81). (d ) Comment. Using the financial analysis above, part b, and trend analysis to predict the financial performance for 2014, it is viable to invest additional funds in Minimax_Plc. Investing in the company will generate higher revenues, gross profits, net profits, and other favourable financial_ratio outcomes. Consequently, the shareholders or investors are assured they will receive their cash dividends on time and returns on their investments. The analysis shows management will be able to increase its revenues and profits during 2014 and future years (Maynard, 2013, p. 147). (e ) Questions for Minimax_Plc Financial_Director (1 ) What steps must be done to improve the unfavourable 2013 current ratio performance, 0.46? The requisite is the 2012 performance is better than the 2013 performance. (2 ) What steps must be done to improve the unfavourable 2013 inventory_turnover ratio? The requisite is 2012 performance is better than the 2013 performance. (3) What steps must be done to improve the unfavourable 2013 debt_to equity_ratio? The requisite is 2012 performance is better than the 2013 performance. (4) What steps must be done to improve the unfavourable 2013 quick_ ratio? The requisite is 2012 performance is better than the 2013 performance (Jain, 2010, p. 53). ( f ) Mary Quaint Recommendation. Mary Qaint should pursue the opening of a retail outlet. An increase in the number of outlets will increase the overall company revenue. With increase revenues from new outlets, the company’s overall gross profit and net profit performances will increase. I will advice management pursue setting up of new outlets. The financial statement ratios affirm it is profitable to set up new outlets as the current outlets are viably generating profitable revenues and net profits. The key implications is that the 2012 and 2013 financial performance indicate an increasing revenue, gross profit, net profit and other favourable financial ratio trends, in terms of setting up outlets (Weygandetal, 2013, p 22). . Ques 2: (a) Theoretical_Framework. Accounting is based on a number of conventions and rules that form a theoretical framework for the recording of transactions and representations of financial position and operations results. Explain this theoretical framework and the mechanism for promoting appropriate presentation of accounting information to stakeholders (Weygand et al., 2013, p 8). Further, the theoretical framework includes presenting useful information to the readers of the financial reports. Useful information must be both relevant and valid. Information should also be material enough to affect the decision making activities of the financial report users. The framework specifies the true and correct presentation of amounts shown in the balance sheet, income statement, and cash flows statement. Specifically, the balance sheet contains true and correct amounts shown in the assets, liabilities, and shareholders’ equity accounts. The income statement must show the true and correct revenue, expenses, costs, profit, and related amounts. The accounts must be comparable between accounting periods and between different companies, departments, or segments. The accounts shown in the financial reports must be verifiable. The transactions must be recorded time period incurred, and easily understood by the different financial statement users. The financial reports normally assume a going concern concept (Weygand et al., 2013, p 8). For example, the assets represent sources owned by the business entity. The liabilities represent the debts of the company. The shareholders’ equity includes the investments, retained earnings. Revenues represent the amount sold to customers. Income represents increased future_benefits. Expenses represent decrease in company’s future benefits, for example cash paid for electricity bill. The framework includes the objectives, qualitative characteristics, reporting_entity, recognition and measurement of the financial report amounts, especially the shareholders’ equity accounts (Weygand et al., 2013, p 8). (b ) Benefits and Constraints. There are benefits from the implementation of the above theoretical framework (Weygand et al., 2013, p 8). First, the readers will understand the contents of the financial reports. The users will know how the assets, liabilities, shareholders’ equity, expenses, costs, revenues, and other related accounts are recorded. Next, the users of the financial reports can compare the financial performance of the company. The users can compare the financial reports of the company during both 2012 and 2013. The users can use the financial reports as basis for future decision making activities. The users can use the financial reports prior years’ financial performances as basis for predicting the future years’ revenues, expenses, assets, liabilities, capital, profits, and other accounting-related management decision making issues. The framework ensures better communication between the preparers of the financial reports and the users of the financial reports. Further, there are constraints in the theoretical framework. The cost of preparing true and correct financial reports may discourage the preparers from ensuring the financial reports are true and correct. The accounting clerk may not have the funds needed to verify if the accuracy of the reported accounts. The materiality of the account details may affect the preparation of true and correct financial report. The erroneous recording of material amounts will unfavourably affect the decisions of the users of the financial reports. The non-inclusion of relevant or valid amounts in the financial reports may affect the trueness or correctness of the financial reports, feeding wrong financial report data for the decision makers. Next, the preparers may erroneously use conservatism to understate revenues and overstate expenses in the financial reports (Weygand et al., 2013, p 8). (c ) Rules –based Accounting. The law, just like in the United States Sarbanes- Oxley Act, will penalize preparers of erroneous or fraudulent financial reports. The courts will implement the rule or law by handing down possible fines and jail terms for those who violate any of the law’s financial report –related provisions. The strict rules (laws) may include penalizing the law or rule violators with jail terms and other punishments will discourage preparers of financial reports from intentionally preparing materially erroneous and materially fraudulent financial reports. The strict rules require strict implementation of all international_accounting principles. On the other hand, a less rigid framework that does not penalize or jail the fraudulent financial report preparers will encourage the unethical preparers of financial reports to present erroneous or fraudulent financial reports (Weygand et al., 2013, p 48). (d ) General_Public Interest_Accounting. The accounting profession significant serves the interest of the general public. The financial reports are grounded on unbiased accounting standards (Weygand et al., 2013, p 8). The International_Accounting Standards require the compulsory preparation of unbiased, true, and correct financial reports. The investors use the financial reports to enhance their investment decisions. An auditor reports that the financial report is true and correct. Consequently, the financial statement user uses the audited financial report’s net income output to determine if the company generated profits during the audit accounting period. A financial report showing the company generated net profits for 2012 and 2013 will persuade the investors to invest in the company. Further, a new investor will avoid companies that generated net loss figures for 2012 and 2013 in their audited financial reports for the same two years (Weygand et al., 2013, p 22). A net profit output indicates the manager performed well. A net loss indicates the manager failed to reach the required bottom line net profit benchmark. The managers use the audited unbiased financial reports to determine if they performed well during the past accounting period. The employees use the audited unbiased financial reports as basis for seeking salary increases and other fringe benefits. The residents use the financial reports as basis for applying for job vacancies. The environment protection agencies use the unbiased audited financial reports to determine if the company implements the company does not violate any environmental laws. The board of directors will use the audited unbiased financial reports as basis for expanding into new market segments or opening up branches in other cities. A net profit output persuades the board of directors to pursue expansion into new market segments. Conclusion The financial reports include the unbiased, true, as well as correct income_statement, balance sheet, and cash_flows. The financial report of Minimax_Plc for 2012 and 2013 indicates the company viably generated revenue, gross profit, and net profits figures. The theoretical framework of accounting helps users of the financial reports understand and compare the unbiased financial reports between accounting periods and between market segments. Evidently, the unbiased, true, correct, valid, relevant, and time financial reports enhance the financial statement users’ decision making activities. References: Bender, R. (2013). Corporate Financial Strategy. London: Routlege Press. Bonham, A. (2012). Painless Businss Finance . London: Infinite Ideas Press. Elliott, B. (2011). Financial Accounting & Reporting . London: Pearson Press. Jain, K. (2010). Management Accounting. London: McGraw Hill. Kiesoetal. (2012). Financial Accounting. London: J. Wiley & Sons. Maynard, J. (2013). Financial Accounting. Oxford: Oxford University Press. Weygandetal. (2013). Financial Accounting. London: J. Wiley & Sons. Read More
Cite this document
  • APA
  • MLA
  • CHICAGO
(Ratio Analysis & theoretical framework Essay Example | Topics and Well Written Essays - 3000 words, n.d.)
Ratio Analysis & theoretical framework Essay Example | Topics and Well Written Essays - 3000 words. https://studentshare.org/finance-accounting/1873089-ratio-analysis-theoretical-framework
(Ratio Analysis & Theoretical Framework Essay Example | Topics and Well Written Essays - 3000 Words)
Ratio Analysis & Theoretical Framework Essay Example | Topics and Well Written Essays - 3000 Words. https://studentshare.org/finance-accounting/1873089-ratio-analysis-theoretical-framework.
“Ratio Analysis & Theoretical Framework Essay Example | Topics and Well Written Essays - 3000 Words”. https://studentshare.org/finance-accounting/1873089-ratio-analysis-theoretical-framework.
  • Cited: 0 times
sponsored ads
We use cookies to create the best experience for you. Keep on browsing if you are OK with that, or find out how to manage cookies.
Contact Us