StudentShare
Contact Us
Sign In / Sign Up for FREE
Search
Go to advanced search...
Free

Financial report of Swallowfield company - Essay Example

Cite this document
Summary
Financial report of Swallowfield Supervisor March 24, Financial report of Swallowfield Financial report of Swallowfield Swallowfield manufactures products for personal care and beauty. It operates in the United Kingdom, the United States, China,…
Download full paper File format: .doc, available for editing
GRAB THE BEST PAPER93.6% of users find it useful
Financial report of Swallowfield company
Read Text Preview

Extract of sample "Financial report of Swallowfield company"

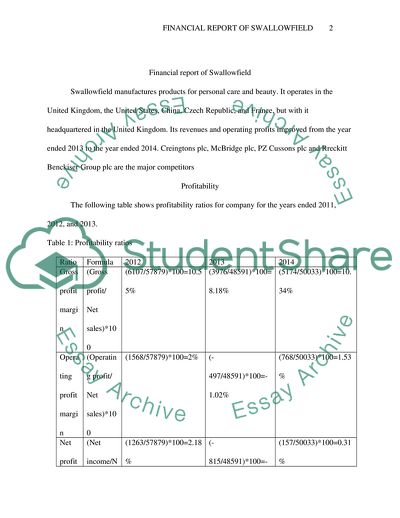
Financial report of Swallowfield Supervisor March 24, Financial report of Swallowfield Financial report of Swallowfield Swallowfield manufactures products for personal care and beauty. It operates in the United Kingdom, the United States, China, Czech Republic, and France, but with it headquartered in the United Kingdom. Its revenues and operating profits improved from the year ended 2013 to the year ended 2014. Creingtons plc, McBridge plc, PZ Cussons plc and Rreckitt Benckiser Group plc are the major competitors Profitability The following table shows profitability ratios for company for the years ended 2011, 2012, and 2013.

Table 1: Profitability ratios Ratio Formula 2012 2013 2014 Gross profit margin (Gross profit/ Net sales)*100 (6107/57879)*100=10.55% (3976/48591)*100=8.18% (5174/50033)*100=10.34% Operating profit margin (Operating profit/ Net sales)*100 (1568/57879)*100=2% (-497/48591)*100=-1.02% (768/50033)*100=1.53% Net profit margin (Net income/Net sales)*100 (1263/57879)*100=2.18% (-815/48591)*100=-1.68% (157/50033)*100=0.31% Return on assets {(Net income+ interest expense)/ Average total assets}*100 1263/{(34795+35249)/2}*100=3.

61% -815/{(33498+33795)/2}*100=-2.42% 157/{(31765+33662)/2}*100=0.48% Return on total equity (Net income/average total equity)*100 1263/{(13707+13446)/2}*100=9.30% -815/{(12433+13707)/2}*100=-6.24% 157/{(12560+12009)/2}*100=1.28% Swallowfield realized a net profit margin of 2.18 percent in the year ended 2012, but a negative margin in the following year, a loss indicator. A sense of recovery was then realized in the year ended 2014. Each of the other computed profitability ratios shows this trend, and analyzed with other ratios, shows that the company’s profitability is weak but is headed for improvement (Baker and Powell 2009, p.

61- 63; Swallowfield n.d., p. 1). Table 2: Shareholders’ earnings indicators (As offered in the annual reports) Ratio Formula 2012 2013 2014 Earnings per share Net profit after tax and preference dividend/ Number of equity shares 8.60 -4.96 4.87 Dividend per share Total equity dividend/number of equity shares 11.2p -7.2p 1.4p Both earnings per share and dividend per share reflect on the company’s profitability. The difference between earnings per share, in pounds, and dividend per share, in pence, however shows that the company’s percentage of shareholders’ return on investment is very low.

This makes it suitable for long-term investors, because of accumulated value on shares and forecasted improvement in profitability. Lack of standards for evaluating the rations and inability to capture price changes are some of the challenges to application of these ratios (Debarshi 2011, p. 73; Perriasamy 2009, p. 4-75; Swallowfield n.d., p. 1). In addition, the reports do not contain income statements for the company and group data are used as estimates. Efficiency Below is a summary of efficiency ratios for Swallowfield for the years ended 2011, 2012, and 2013 Table 3: Efficiency ratios Ratio Formula 2012 2013 2014 Fixed asset turnover Net revenues/ Fixed assets 57879/11779=5.

01 48591/11559=4.20 50033/11117=4.5 Total assets turnover Net revenues/Total assets 57879/34795=1.66 48591/33498=1.45 50033/31756=1.58 Inventory turnover Cost of sales/average inventory 44859/{(8297+8428)}=5.36 44616/{(7191+8297)/2}=5.76 44859/{(7065+7294)/2}6.25 The turnover ratios indicate an entity’s ability to convert its assets into revenues, efficiently. The fixed asset turnover, for the year 2012, shows that for every unit pound worth of fixed assets, Swallowfield generated 4.10 pounds of revenues.

The efficiency reduced in the year 2013 but its improvement in the year 2014 suggests an average improvement trend. The same trend is evident in total assets turnover and inventory turnover and suggest greater level of efficiency in future management of the company’s assets. The ratios do not however incorporate qualitative aspects of the organization an entity’s background information such as size. There was no information on company’s income statements and group data was used to estimate company’s ratios (Kuppapally 2008, p.

224- 228; Swallowfield n.d., p. 1). Liquidity The following table shows liquidity ratios for the three accounting years. Table 4: Liquidity ratios Ratio Formula 2012 2013 2014 Current ratio Current assets/Current liabilities 23087/20910=1.10 21869/21282=1.03 20433/19481=1.22 Acid-test ratio (Current assets- inventory)/ (Current liabilities- Overdraft) (23087-8297/20910=0.71 (21869-7294)/21282=0.68 (20433-7065)/194810.80 Swallowfield’s current ratios are commendable but weak, based on the recommended value of 2:1.

Even though a decline in the ratio was reported from the year ended 2012 to the year ended 2013, the greater improvement in the year ended 2014 suggests that the company is enjoying an overall improvement in its liquidity. Acid-test ratios, for the three periods, have been less than the recommended value of 1:1. This suggests a weak liquidity, though improvement is evident. Even though the company may be able to meet its short-term obligations and its liquidity shows an improving trend, the liquidity is below recommended level.

The ratios, and other ratios, are limited to reliability and validity of an entity’s financial accounting processes and differences in practices limits comparison across organizations (Debarshi 2011, p. 65, 77; Swallowfield n.d., p. 1). Gearing The following table summarizes the company’s gearing ratios for the accounting periods. Table 5: Gearing ratios Ratio Formula 2012 2013 2014 Debt to equity ratio Total debt/Owners’ equity 23584/13615=1.73 23643/11888=1.99 21693/11793=1.53 Debt ratio Total debt/ total assets 23584/33199=0.

64 23643/35531=0.67 21693/33486=0.60 Swallowfield’s debt-to-equity ratio for the three accounting periods is however higher that the recommended 1:2 ratio, indicating excessive reliance on external financing and weak gearing. Even though an increase in the ratio occurred from 2012 to 2013, the significant decrease in the year 2014 suggests improvement. Debt ratio also shows weakness and possible improvement on the company’s gearing as the ratio exhibits a decreasing trend. Consistency on the strength and trend of the two ratios, as well as consistency with other ratios, means reliability in the company’s improvement towards stability.

The ratios overlook qualitative elements of the organization and background information, factors that limit validity (Kuppapally 2008, p. 216, 217: Swallowfield n.d., p. 1). Reference list Baker, H and Powell, G 2009, Understanding financial management: A practical guide, John Wiley & Sons, Hoboken. Debarshi, B 2011, Management accounting, Pearson Education India, New Delhi. Kuppapally, J 2008, Accounting for managers, PHI Learning Pvt. Ltd., New Delhi. Perriasamy, P 2009, Financial management (2nd Ed.), Tata McGraw-Hill Education, New Delhi.

Swallowfield N.d., Reports & accounts, Swallowfield, Retrieved March 24, 2015, .

Read More
Cite this document
  • APA
  • MLA
  • CHICAGO
(Financial report of Swallowfield company Essay Example | Topics and Well Written Essays - 750 words, n.d.)
Financial report of Swallowfield company Essay Example | Topics and Well Written Essays - 750 words. https://studentshare.org/finance-accounting/1866725-financial-report-of-swallowfield-company
(Financial Report of Swallowfield Company Essay Example | Topics and Well Written Essays - 750 Words)
Financial Report of Swallowfield Company Essay Example | Topics and Well Written Essays - 750 Words. https://studentshare.org/finance-accounting/1866725-financial-report-of-swallowfield-company.
“Financial Report of Swallowfield Company Essay Example | Topics and Well Written Essays - 750 Words”. https://studentshare.org/finance-accounting/1866725-financial-report-of-swallowfield-company.
  • Cited: 0 times
sponsored ads
We use cookies to create the best experience for you. Keep on browsing if you are OK with that, or find out how to manage cookies.
Contact Us