StudentShare
Contact Us
Sign In / Sign Up for FREE
Search
Go to advanced search...
Free

Analysing the Liquidity of Starren PLC - Essay Example

Cite this document
Summary
The paper "Analysing the Liquidity of Starren PLC" tells us about the company's ability to adapt. When unforeseen expenses arise, a company with high liquidity will be able to easily cover the costs, while a company with low liquidity may be forced to sell off assets or take on debt…
Download full paper File format: .doc, available for editing
GRAB THE BEST PAPER93.3% of users find it useful
Analysing the Liquidity of Starren PLC
Read Text Preview

Extract of sample "Analysing the Liquidity of Starren PLC"

Analyzing the liquidity of Starren PLC (trend analysis) Analysing the liquidity of Starren PLC (trend analysis) For any business it is crucial to have sufficient liquidity in terms of liquid assets to meet its operational needs. These liquid assets are reported on the face of the balance sheet of a company as current assets. These assets are not held to maturity but instead, they are for the day-to-day operations of the business. In this report, the liquidity position of Starren PLC is investigated by determining key financial ratio values and their explanation and importance to the business.

The financial ratios selected for analysis are the current ratio and quick ratio. Their values are calculated for the five-year period from 1988 to 1992. 1988 Jan 30, 1989, Jan 28, 1990, Feb 3, 1991, Feb 2, 1992, Feb 1 Liquidity Ratios Current Ratio 2.43 1.75 2.25 2.57 3.20 Current Assets 234.80 328.40 545.10 776.90 791.90 Current Liabilities 96.70 187.60 241.90 302.20 247.40 Quick Ratio 0.62 0.41 0.71 1.10 1.48 Current Assets 234.80 328.40 545.10 776.90 791.

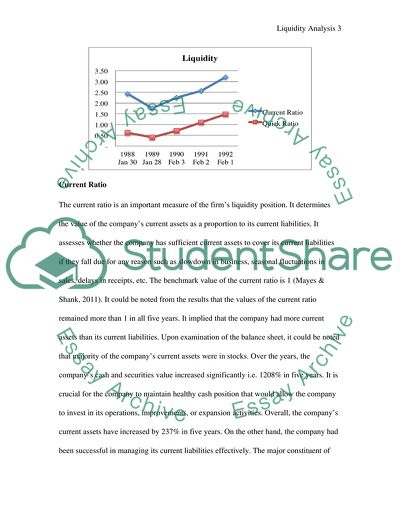
90 Stock 174.50 251.90 374.40 443.50 425.70 Current Liabilities 96.70 187.60 241.90 302.20 247.40 It could be noted that the company’s position has considerably improved over the period of analysis. The following graph depicts the trend observed in the values of both the current ratio and quick ratio. Current Ratio The current ratio is an important measure of the firm’s liquidity position. It determines the value of the company’s current assets as a proportion to its current liabilities.

It assesses whether the company has sufficient current assets to cover its current liabilities if they fall due for any reason such as a slowdown in business, seasonal fluctuations in sales, delays in receipts, etc. The benchmark value of the current ratio is 1 (Mayes & Shank, 2011). It could be noted from the results that the values of the current ratio remained more than 1 in all five years. It implied that the company had more current assets than current liabilities. Upon examination of the balance sheet, it could be noted that the majority of the company’s current assets were in stocks.

Over the years, the company’s cash and securities value increased significantly i.e. 1208% in five years. It is crucial for the company to maintain a healthy cash position that would allow the company to invest in its operations, improvements, or expansion activities. Overall, the company’s current assets have increased by 237% in five years. On the other hand, the company had been successful in managing its current liabilities effectively. The major constituent of the company’s current assets is the creditors account that recorded 248% growth in the five-year period.

Overall, the current liabilities of the company increased by 156% which remained below the growth rate of current assets. Quick Ratio Another important measure of liquidity is the quick ratio. It excludes stocks from current assets when measuring the company’s liquidity. The reason for excluding stock is that the company’s stocks are less liquid as compared to other current assets and companies often fail to find buyers for their stocks in times of financial difficulties or they do not receive the full value of their stocks (Mayes & Shank, 2011).

The quick ratio value also increased over the five-year period. Similar to the current ratio value, the quick ratio value fell in 1989 as there was a sharp increase in the company’s creditors' accounts. From 1998 to 1990, the quick ratio value was below 1. However, in the last two years of analysis, its value went above 1 which reflected a positive sign of improved liquidity position. It could be concluded that the company had a strong liquidity position and it is less likely to face any immediate financial difficulties in the coming years.

Reference Mayes, ‎T. & Shank, T., 2011. Financial Analysis with Microsoft Excel. Mason: Cengage Learning.

Read More
Tags
Cite this document
  • APA
  • MLA
  • CHICAGO
(Analysing the liquidity of Starren PLC (trend analysis) Essay, n.d.)
Analysing the liquidity of Starren PLC (trend analysis) Essay. https://studentshare.org/finance-accounting/1863326-analysing-the-liquidity-of-starren-plc-trend-analysis
(Analysing the Liquidity of Starren PLC (trend Analysis) Essay)
Analysing the Liquidity of Starren PLC (trend Analysis) Essay. https://studentshare.org/finance-accounting/1863326-analysing-the-liquidity-of-starren-plc-trend-analysis.
“Analysing the Liquidity of Starren PLC (trend Analysis) Essay”. https://studentshare.org/finance-accounting/1863326-analysing-the-liquidity-of-starren-plc-trend-analysis.
  • Cited: 0 times
sponsored ads
We use cookies to create the best experience for you. Keep on browsing if you are OK with that, or find out how to manage cookies.
Contact Us