StudentShare
Contact Us
Sign In / Sign Up for FREE
Search
Go to advanced search...
Free

Home Retail Group Plc Financial Ratio Analysis - Coursework Example

Cite this document
Summary
The report contains an analysis of the financial statements of the Company included in the Annual Report and Accounts 2014. A Ratio Analysis has been carried out for arriving at…
Download full paper File format: .doc, available for editing
GRAB THE BEST PAPER93.3% of users find it useful
Home Retail Group Plc Financial Ratio Analysis
Read Text Preview

Extract of sample "Home Retail Group Plc Financial Ratio Analysis"

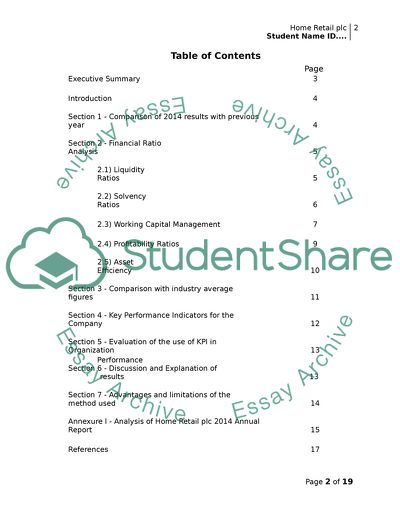
M004 (F01) work CW1 Data Response Home Retail Group plc - and ID and ID 2 and ID submission Table of Contents             Page Executive Summary       3               Introduction         4               Section 1 - Comparison of 2014 results with previous year 4               Section 2 - Financial Ratio Analysis     5                 2.1) Liquidity Ratios       5                 2.2) Solvency Ratios       6                 2.3) Working Capital Management   7                 2.4) Profitability Ratios     9                 2.5) Asset Efficiency       10               Section 3 - Comparison with industry average figures 11               Section 4 - Key Performance Indicators for the Company 12               Section 5 - Evaluation of the use of KPI in Organization 13   Performance         Section 6 - Discussion and Explanation of results   13                Section 7 - Advantages and limitations of the method used 14               Annexure I - Analysis of Home Retail plc 2014 Annual Report 15               References         17 Executive Summary This report is prepared for submission to the Board of Directors of Home Retail Group plc. The report contains an analysis of the financial statements of the Company included in the Annual Report and Accounts 2014. A Ratio Analysis has been carried out for arriving at performance measures for the Company. The analysis shows that though revenues have grown faster than the industry average in 2014, the Company lags the performance of other UK retail companies in profitability. The Key Performance Indicators for managing the Company do not appear to give adequate weightage to measures for improvement of profitability. A more detailed comparative analysis with companies retailing similar product lines would be needed to arrive at specific measures to be adopted for improved profitability. Introduction Home Retail Group plc is one of UK’s major home and general merchandise retailers. The company had revenues of £ 5.74 billion with a net income of £ 51.0 million in 2014 and employed over 47,000 people. The company has two major business segments, each with its own brand name. Argos is a digital retailer selling products such as mobile phones and video games through its 734 stores and on-line. Homebase offers products for the home improvement and the do-it-yourself market through 340 stores (FT.com, 2015). Both business segments are supported by an in-house financial services division that offers customers credit services for buying the company products (Home Retail Group AR 2014, p5). Section 1 – Comparison of 2014 results with the previous year The Consolidated Income Statement and the Consolidated Balance Sheet for the Home Retail Group plc for 2014 are shown in Annexure-1 (Home Retail Group AR 2014, p68, p 70). There has been a revenue growth of 3.4% in the year 2014 over the previous year. A report by the Centre for Retail Research published on 26 Jan 2015 says that retail sales in the UK in 2014 grew by about 2.3% (Retail Research, 2015). The Gross Margin has declined marginally to 31.1% in 2014 from 31.6% in 2013. A small reduction in net operating expenses has offset this decline and the company has an operating profit of 2.0% in 2014, similar to the figure of 1.9% for 2013. The company Balance Sheet shows no substantial change in non-current assets. The company’s Cash Flow statement for 2014 shows a spending of £ 102.5 million on Computer Software and £ 72.5 million on purchase of property, plant and equipment (Home Retail Group AR 2014, p72, p96).The company has no significant long term borrowings. The company’s total working capital in 2014 was £ 499.2 million, 7.9% higher in value than the figure of £ 462.5 million for 2013 when the revenue growth was only 3.4%. Section 2 – Financial Ratio Analysis Financial Ratios help us understand how well a company is performing and makes it easy to compare performance parameters with other companies (Myaccountingcourse.com, 2014). 2.1 Liquidity Ratios Liquidity Ratios are a measure of a company’s ability to meet its short term liabilities as they become due for payment (Myaccountingcourse.com, 2014). a) Current Ratio Companies require liquidity to sustain business. Home Retail had a very comfortable Current Ratio of 1.74 in 2013 which has fallen slightly to 1.64 in 2014. For both years, the company had comfortable liquidity. b) Quick Ratio or Acid Test Ratio This is narrower definition of liquidity where the only Current Assets considered are cash and cash equivalents, short term investments and receivables which can be immediately applied to meet current liabilities. The Quick Ratio for Home Retail was 93% in 2013 which has fallen slightly to 88% in 2014 both below the desirable 100% level. Liquidity Ratios   Year 2014 Year 2013 Current Ratio = Current Assets 1.63 1.74 Current Liabilities Quick Ratio = Cash & Eqvt + Short term investments + receivables 0.88 0.93 Current Liabilities 2.2 Solvency Ratios Solvency Ratios, also called Gearing Ratios, are a measure of a company’s ability to sustain its business over the longer term (Myaccountingcourse.com, 2014). a) Debt to Equity Ratio A company finances its business with equity from its shareholders and borrowings from banks or other lenders. A company’s equity includes retained earnings which are profits that belong to the shareholders. The debt to equity ratio is a measure of the company’s solvency or gearing. The Debt to Equity ratio for Home Retail Group plc was 0.55 in 2013 and a similar 0.57 in 2014 showing a company with high solvency or low gearing. b) Equity Ratio This is a subset of the Debt to Equity Ratio and measures of how much of the company’s assets are financed by its equity capital. For Home Retail, this ratio has remained unchanged at 0.64 for the two years 2013 and 2014. c) Debt Ratio This ratio complements the Equity Ratio and is the ratio between what the company owns (assets) against what it owes (liabilities). For Home Retail, this ratio has remained unchanged at 0.36 for the two years 2013 and 2014. Solvency Ratios   Year 2014 Year 2013 Debt to Equity Ratio = Total liabilities 0.57 0.55 Total Equity Equity Ratio = Total Equity 0.64 0.64 Total Assets Debt Ratio = Total Liabilities 0.36 0.36 Total Assets 2.3 Working Capital Management Working Capital Management is often the key difference between a well managed company and a poorly managed company. The primary measure for efficiency of Working Capital Management is the Cash Conversion Cycle and its constituent elements – inventory, accounts payable and accounts receivable (Myaccountingcourse.com, 2014). a) Cash Conversion Cycle Cash Conversion Cycle is the measure of the time taken by the company from spending cash on buying inventory to realizing cash after sale of the product to the customer. The Cash Conversion Cycle is made up of three elements - inventory, accounts payable and the accounts receivable. Home Retail had a Cash Conversion Cycle of 25.5 days in 2013 which has marginally gone up to 26 days. b) Number of days inventory The number of days’ inventory is a measure of the money locked up in keeping materials in stock in relation to the total cost of materials sold in the year. Home Retail had 91.8 days of inventory in 2013 which has improved to 84.5 days in 2014. c) Number of days receivable Accounts receivable arise where the company has made a sale but not received money for the goods sold. Home Retail had 42.5 days of receivables in 2013 which has increased to 45.9 days in 2014. d) Number of days payable The accounts payable are moneys that the company owes to its suppliers for materials it has bought for its business. Home Retail had 108.8 days of accounts payable in 2013 which has reduced to 104.4 days in 2014. Working Capital Management Year 2014 Year 2013 No of days inventory = Year-end Inventory x 365 days 84.5 91.8 Cost of Goods Sold No of days receivable = Accounts receivable x 365 days 45.9 42.5 Total Sales No of days payable = Accounts payable x 365 days 104.4 108.8 Cost of Goods Sold Cash Conversion Cycle = No of days inventory +No of days receivable - No of days payable 26.0 25.5 2.4 Profitability Ratios One of the primary purposes of a business enterprise is to make profits for its shareholders. Various measures to measure profitability can be applied (Myaccountingcourse.com, 2014). a) Gross Margin Gross Margin is the difference between the Sales value and the Cost of Goods. For Home Retail the Gross Margin was 31.6% in 2013 which has declined marginally to 31.1%. b) Net Income to Sales Net income is what the company generates after has meeting all operational expenses and interest costs. Home Retail plc had 1.9% of net income to sales in 2013 which has improved marginally to 2.0%. c) Return on Assets This is a measure of how efficiently the company has used its assets to generate net income. In 2014, Home Retail plc had a low 0.48% return on the average assets it used during that year. d) Return on Capital Employed This is a measure of the net income the company has generated on the total capital employed in the business. For Home Retail plc this was 3.71% in 2014 an improvement over 3.38% in 2013. e) Return on Equity This is a measure of the net income the company has generated on the shareholders’ equity. In 2014 this was 4.17% in Home Retail compared to 3.81% in 2013. Profitability Year 2014 Year 2013 Gross Margin = Gross margin x 100 31.1% 31.6% Total Sales Net income to sales = Net Income x 100 2.0% 1.9% Total Sales Return on Assets = Net Income x 100 0.48% # Average total assets Return on Capital employed = Net Income x 100 3.71% 3.38% Total assets - Current Liabilities Return on Equity = Net Income x 100 4.17% 3.81% Shareholders Equity Note # - Not calculated as the Assets for 2012 are needed for averaging 2.5 Asset Efficiency Asset Efficiency ratios are a measure of how well the company uses its assets to generate income. In low net margin industries such as retailing, asset efficiency often determines if the company is profitable. a) Asset turnover Ratio This ratio is a measure of how much Sales Revenue the company has generated from the assets deployed in the business. In 2014, Home Retail generated sales revenue of 1.34 times the average assets used during the year. b) Inventory Turnover Ratio Inventory is a key element of the working capital employed in a business. The Inventory turnover shows the efficiency of inventory management. Home Retail had an inventory turnover ratio of 4.23 on the average inventory during the year. c) Working Capital Ratio Working Capital is a key asset used by a company and the working capital ratio is a measure of how well the company uses its working capital. Home Retail had a working capital ratio of 1.63 in 2014 compared to 1.74 in 2013. Asset Efficiency Year 2014 Year 2013 Asset Turnover Ratio = Net Sales 1.34 # Average total assets Inventory Turnover Ratio = Cost of Goods Sold 4.23 # Average inventory Working Capital Ratio = Current Assets 1.63 1.74 Current Liabilities Note # - Not calculated as data for year 2012 are needed for averaging Section 3 – Comparison with industry average figures The tabulation below shows key performance ratios for major companies in the UK retail industry in comparison Home Retail (Google Finance, 2015). All three companies, J. Sainsbury, Tesco and Marks & Spencer have better profitability ratios than Home Retail. In making such comparisons, it is important to remember that the nature of merchandise sold by the retailer can determine profitability. Generally, fashion apparel and accessories have higher gross margin than grocery or food. J. Sainsbury and Tesco sell general merchandise whereas Marks & Spencer is predominantly a clothing retailer.   Year 2014   Home Retail J.Sainsbury Tesco Marks & Spencer Net Profit Margin 0.95% 2.99% 3.01% 4.91% Operating Margin 1.24% 4.21% 4.14% 6.74% EBITD Margin 6.33% 5.97% 6.40% 11.52% Return on avg assets 1.28% 4.90% 3.81% 6.52% Return on avg equity 2.00% 12.09% 12.22% 20.01% It would be necessary to study these companies’ financial reports in depth to arrive at meaningful comparisons. Section 4 – Key Performance Indicators for the Company The Home Retail Group annual report lists the Key Performance Indicators for the Company as below: (Home Retail Group AR 2014, p11). Sales – The company reports that Group sales increased by 3% in 2014. Argos which accounts for 72% of group sales increased by 3% and Homebase which accounts for 26% of Group sales increased by 4%. Group benchmark operating profit – This has increased by 21%. This benchmark is defined by the company as operating profit before a number of expenses including amortization of intangible assets, store impairment costs, certain employee related administration costs etc. Benchmark Earnings per share – This is related to the benchmark operating profit Net cash – The Company has reported that year-end net cash has decreased due to increase in strategic investments. Section 5 – Evaluation of the use of KPI in organization performance The 2007 publication titled “Guide to key performance indicators” by the audit firm PriceWaterhouseCoopers points out that the Key Performance Indicators included in a company financial report should be those that the Board uses to manage the business. When reported externally, these should allow the readers to assess progress against stated strategies. The KPIs reported by the Home Retail Group do not appear to measure up to the standard suggested by PWC. In the same publication, PWC suggests the following KPIs for the retail industry – Capital Expenditure, Store portfolio changes, Expected return on new stores, Customer satisfaction, same store/ like-for-like sales and Sales per square foot of space. The PWC publication also suggests that it is important for the management to disclose why they consider a performance measure as relevant to the achievement of a strategic objective. Section 6 – Discussion and Explanation of results The study of the 2014 financial report of Home Retail Group plc shows that revenue growth in 2014 has been higher than the industry average. The gross margin has however decreased compared to the previous year. The net margin has, however, been maintained due to a reduction in operating expenses. The company’s profitability measures are significantly lower than comparable UK retail companies. The company’s Key Performance Indicators do not focus adequately on measures to improve profitability. Section 7 – Advantages and limitations of the method used The major advantage of using financial statements for such analysis is the fact that the numbers used are not disputable. Ratio analysis is a well established method and widely understood. The major disadvantage is that we often forget that the financial report captures the numbers at a single point in time. For rational analysis, it is necessary to look at company financial performance over an extended period of time. It is also necessary to factor in external circumstances that may impact a company performance – it could be due to events such as the global financial crisis of 2008, the oil price fall of 2014-15 etc. Annexure 1 – Analysis of Home Retail plc 2014 annual report Consolidated Income Statement (in £ millions) Year 2014 Year 2013 Revenue 5,663.0 5,475.4 Revenue Growth % 3.4%   Cost of Sales 3,899.2 3,743.3 Gross Profit 1,763.8 1,732.1 Gross Profit % 31.1% 31.6% Net operating expenses ( excluding exceptional items) 1652.4 1628.1 Operating Profit 111.40 104.00 Operating Profit % 2.0% 1.9% Consolidated Balance Sheet     (in £ millions) Year 2014 Year 2013 Non-current assets     Goodwill 1,543.9 1,543.9 Other intangible assets 193.6 129.2 Property, Plant & eqpt 456.7 474.9 Other non-current assets 53.0 67.8 Total non-current assets 2,247.2 2,215.8 Current assets     Inventories 902.4 941.8 No of days of inventory 84.5 91.8 Receivables 712.1 636.8 No of days of receivables 45.9 42.5 Cash and equivalents 331.0 396.0 Other current assets 11.4 54.8 Total current assets 1,956.9 2,029.4 Total assets 4,204.10 4,245.20 Non-current Liabilities     Non-current Payables 47.4 52.6 Provisions 190.0 179.5 Other non-current liabilities 89.5 111.7 Total non-current liabilities 326.9 343.8 Current Liabilities     Payables 1,115.3 1,116.1 No of days payable 104.4 108.8 Provisions 46.1 38.3 Other current liabilities 42.3 14.5 Total current liabilities 1,203.7 1,168.9 Total liabilities 1,530.60 1,512.70 Net assets = Shareholders Equity 2,673.50 2,732.50 References: 1) FT.com (2015). “Home Retail Group plc – Business Profile”, The Financial Times, 19 February 2015. Accessed on 20 February at 2) Google Finance, (2015). “Home Retail plc – Key Stats and Ratios”, Google Finance, 20 February 2015. Accessed on 21 February 2015 at . 3) Home Retail AR 2014. “Home Retail Group – Annual Report and Financial Statements 2014”. Accessed on 20 February 2015 at 4) Myaccountingcourse.com, (2014). “Financial Ratio Analysis”, Myaccountingcourse.com. Accessed on 21 February 2015 at . 5) PWC, (2007). “Guide to key performance indicators – Communicating the measures that matter”, Price Waterhouse Coopers, 2007. Accessed on 21 February 2015 at 6) Peavler, R., (2015). “Limitations of Financial Ratio analysis”, About Money, 2015. Accessed on 21 February 2015 at 7) Retail Research, (2015). “The Retail Forecast for 2015-16”, The Centre for Retail Research, 26 January 2015. Accessed on 20 February 2015 at Read More
Cite this document
  • APA
  • MLA
  • CHICAGO
(Home retail group plc (Finance) Coursework Example | Topics and Well Written Essays - 2000 words, n.d.)
Home retail group plc (Finance) Coursework Example | Topics and Well Written Essays - 2000 words. https://studentshare.org/finance-accounting/1860888-home-retail-group-plc-finance
(Home Retail Group Plc (Finance) Coursework Example | Topics and Well Written Essays - 2000 Words)
Home Retail Group Plc (Finance) Coursework Example | Topics and Well Written Essays - 2000 Words. https://studentshare.org/finance-accounting/1860888-home-retail-group-plc-finance.
“Home Retail Group Plc (Finance) Coursework Example | Topics and Well Written Essays - 2000 Words”. https://studentshare.org/finance-accounting/1860888-home-retail-group-plc-finance.
  • Cited: 0 times

CHECK THESE SAMPLES OF Home Retail Group Plc Financial Ratio Analysis

Business Operations of Sainsbury Plc

The company management has come up with the idea of acquiring the UK based J Sainsbury plc in a bid to improve the valuation of the company.... The company also has an alliance with the Lloyds Banking group in financial services (Reuters-b, 2011).... Valuation of Sainsbury and writing the report Table of Contents Table of Contents 2 Motives 3 Future of retail- 4 Valuation of Sainsbury 5 Financing 12 Recommendation 14 Bibliography 18 Motives CF Inc is a large sized retail company with worldwide operations....
12 Pages (3000 words) Research Paper

Managerial Finance and Accounting in Kingfisher Plc

Case Study – KINGFISHER plc Table of Content Kingfisher plc – The Company 3 Background of the Company 3 Strategy 3 Brands 4 Customers 4 Market 4 Financial Statements 4 Use of Financial Statements by Organizations 4 Strengths of Kingfisher plc 5 Weakness of Kingfisher plc 6 Financial Analysis of Kingfisher plc 7 Recommendation and Conclusion 8 References 9 Appendix KINGFISHER plc Background Kingfisher originated in the year of 1982....
6 Pages (1500 words) Essay

Kingfisher Public Limited Company

he main objective of Kingfisher plc is to distribute superior and consistent returns to its shareholders.... n the meantime, B&Q was expanding its out of town appearance in order to become the leader of home “In 1990s, Kingfisher attempted to continue its expansion of retail businesses.... “The acquisition of Woolworth by Paternoster made ways for a fairly small chain consisting of home development stores, known as B&Q.... In 1994, home improvement zone expanded internationally....
6 Pages (1500 words) Essay

Financial analysis ' report' on Dunelm Group plc

Industry players are expected to venture more into the use of online market as will be shown through an outlook of two industry players; Dunelm Group plc and home retail group plc.... Should You Buy Dunelm Group plc Or home retail group plc?... home retail group plc (HOME.... Following its demerger from GUS plc, home retail group was launched in the year 2006 as home retail group.... Out of the 1,057 stores, there are 336 Homebase stores and 734 Argos stores (home retail group, 2014)....
2 Pages (500 words) Essay

Home Retail Group Plc

This paper "home retail group plc" covers the analysis and critical evaluation of the company's environmental audit, the strategic directions, and critical assessment of its strategies using the SAFS framework (suitability, acceptability, feasibility, and sustainability).... home retail group plc is a leading retailer of home and general merchandise.... Over 47,450 competent and efficient employees work in home retail group plc.... home retail group is always looking forward to easing information attainment to its customers on their needs....
14 Pages (3500 words) Coursework

Ratio Analysis of Home Retail Group

The company is listed under London Stock Exchange (LSE) and is a successful constituent of FTSE 250 Index (home retail group plc, 2015b).... The vision of home retail group plc is to value needs of the customers by providing them with their necessities either at home or at stores.... Argos is known to be a leading multi-channel retailer in the UK and Homebase to be the home-enchantment retailer (home retail group plc, 2015b; home retail group plc, 2015e)....
11 Pages (2750 words) Essay

Next Plc - Business Description

The paper "Next Plc - Business Description " is a perfect example of a finance and accounting case study.... The paper "Next Plc - Business Description " is a perfect example of a finance and accounting case study.... Next plc manufactures, designs and distributes apparels, accessory items and home furnishing items through its nearly 500 retail stores and mail order sales catalog.... Next plc manufactures, designs and distributes apparels, accessory items and home furnishing items through its nearly 500 retail stores and mail-order sales catalogue....
6 Pages (1500 words) Case Study

Retail Marketing Analysis on Next Plc

The company that is the subject of this paper "Retail Marketing Analysis on Next plc" is Next retail chain that was opened in February 1982 revitalizing the shape of fashion retailing in the UK.... Next plc is a company based in the United Kingdom that specializes in the home shopping and retailing of womenswear, menswear, childrenswear, interiors, accessories, fashion jewelry, and telecommunication software services.... Next plc trades from over 450 stores in the UK and Eire and 100 franchise stores overseas....
11 Pages (2750 words) Case Study
sponsored ads
We use cookies to create the best experience for you. Keep on browsing if you are OK with that, or find out how to manage cookies.
Contact Us