StudentShare
Contact Us
Sign In / Sign Up for FREE
Search
Go to advanced search...
Free

Total Liabilities of Fastenal Company - Example

Cite this document
Summary
While the total assets and liabilities in Fastenal Company rise steadily over the three-year period, those in Masco Corporation fall then rise…
Download full paper File format: .doc, available for editing
GRAB THE BEST PAPER91.9% of users find it useful
Total Liabilities of Fastenal Company
Read Text Preview

Extract of sample "Total Liabilities of Fastenal Company"

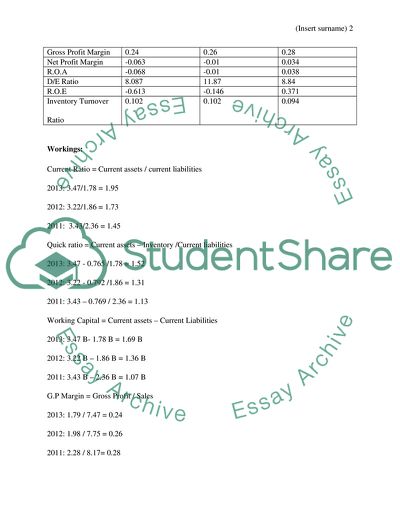
Masco Corporation: All values are in USD Balance sheet items Current assets 3.47 B 3.22 B 3.43 B Non-current assets 3.46 B 3.66 B 3.87 B Inventory 765 M 792 M 769 M Total assets 6.93 B 6.88 B 7.3 B Current Liabilities 1.78 B 1.86 B 2.36 B Non-current liabilities 4.39 B 4.48 B 4.2 B Total liabilities 6.17 B 6.34 B 6.56 B Equity 763 M 534 M 742 M Liability and Equity 6.93 B 6.88 B 7.3 B Income Statement Items 2013 2012 2011 Revenues 7.47 B 7.75 B 8.17 B Cost of Goods 5.68 B 5.77B 5.9 B Gross Income 1.79 B 1.98B 2.28 B Operating Expenses 2.294 B 2.165 B 2.317 B EBIT (504 M) (185 M) (37 M) Other expenses (36 M) (107 M) (313 M) Net Income (468 M) (78M) 276 M Financial Ratios 2013 2012 2011 EPS (Basic) 0.75 (0.33) (1.66) Current Ratio 1.95 1.73 1.45 Quick Ratio 1.52 1.31 1.13 Working Capital 1.69 B 1.36 B 1.07 B Gross Profit Margin 0.24 0.26 0.28 Net Profit Margin -0.063 -0.01 0.034 R.O.A -0.068 -0.01 0.038 D/E Ratio 8.087 11.87 8.84 R.O.E -0.613 -0.146 0.371 Inventory Turnover Ratio 0.102 0.102 0.094 Workings: Current Ratio = Current assets / current liabilities 2013: 3.47/1.78 = 1.95 2012: 3.22/1.86 = 1.73 2011: 3.43/2.36 = 1.45 Quick ratio = Current assets – Inventory /Current liabilities 2013: 3.47 - 0.765 /1.78 = 1.52 2012: 3.22 - 0.792 /1.86 = 1.31 2011: 3.43 – 0.769 / 2.36 = 1.13 Working Capital = Current assets – Current Liabilities 2013: 3.47 B- 1.78 B = 1.69 B 2012: 3.22 B – 1.86 B = 1.36 B 2011: 3.43 B – 2.36 B = 1.07 B G.P Margin = Gross Profit / Sales 2013: 1.79 / 7.47 = 0.24 2012: 1.98 / 7.75 = 0.26 2011: 2.28 / 8.17= 0.28 N.P Margin = Net Profit / Sales 2013: (468)/7470 = -0.063 2012: (78) / 7750 = -0.01 2011: 276 / 7300 = -0.034 R.O.A = Net Income / Total Assets 2013: (468) / 6930 = -0.068 2012: (78) / 6880 = -0.01 2011: 276 / 7300 = -0.038 D/E Ratio = Total Liabilities / Equity 2013: 6.17 / 0.763 = 8.087 2012: 6.34 / 0.534 = 11.87 2011: 6.56 / 0.742 =8.84 R.O.E = Net Income / Equity 2013: (468) /763 = -0.613 2012: (78) / 534 = -0.146 2011: 276 / 742 = 0.371 Inventory Turnover = Inventory / Sales 2013: 765 / 7470 = 0.102 2012: 792 / 7750 = 0.102 2011: 769 / 8170 = 0.094 Masco Corporation industry’s statistics Market Capitalization 7239 B Price / Earnings 58.2 Price / Book 18.5 Net Profit Margin 2.3% R.O.E 6.3% D /E Ratio 60.2 Dividend Yield 0.9% Fastenal Company: All values are in USD Balance Sheet Items 2013 2012 2011 Current Assets 1.41 B 1.29 B 1.24 B Non- Current Assets 670 M 530 M 440 M Inventory 765 M 792 M 769 M Total Assets 2.08 B 1.82 B 1.68 B Current Liabilities 239.83 M 204.17 M 187.82 M Non-Current Liabilities 63.26 M 51.3 M 38.15 M Total Liabilities 303.09 M 255.47 M 225.97 M Equity 1.77 B 1.56 B 1.46 B Liabilities and Equity 2.08B 1.82 B 1.68 B Income Statement Items 2013 2012 2011 Sales 3.33 B 3.13 B 2.77 B Cost of Goods 1.61 B 1.52 B 1.34 B Gross Income 1.72 B 1.61 B 1.43 B Operating Expenses 1.01 B 941.24 M 859.37 M EBIT 710 M 668.76 M 570.63 M Other Expenses 261.36 M 248 .22 M 212.7 M Net Income 448.64 M 420.54 M 357.93 M Financial Ratios 2013 2012 2011 EPS (Basic) 1.51 1.42 1.21 Current Ratio 5.879 6.318 6.602 Quick Ratio 2.61 2.816 3.163 Working Capital 1.1702 B 1.086 B 1.052 B Gross Margin 0.517 0.514 0.516 Net Profit Margin 0.315 0.314 0.129 R.O.A 0.216 0.231 0.213 D/E Ratio 0.171 0.164 0.155 R.O.E 0.253 0.269 0.245 Inventory Turnover Ratio 0.235 0.228 0.233 Working: Current Ratio = Current Assets / Current Liabilities 2013: 1.41 / 0.23983 = 5.879 2012: 1.29 / 0.20417 = 6.318 2011: 1.24 / 0.18782 = 6.602 Quick Ratio = Current Assets – Inventory / Current Liabilities 2013: 1.41 – 0.784 / 0.23983 = 2.61 2012: 1.29 – 0.715 / 0.20417 = 2.816 2011: 1.24 – 0.646 / 0.18782 = 3.163 Working capital =Current Assets – Current Liabilities 2013: 1.41- 0.2398 = 1.1702B 2012: 1.29 – 0.204 = 1.086B 2011: 1.24 – 0.188 = 1.052B Gross Profit Margin = Gross Profit / Sales 2013: 1.72 B / 3.33 B = 0.517 2012: 1.61B / 3.13B = 0.514 2011: 1.43B / 2.77B = 0.516 Net Profit Margin = Net Profit / Sales 2013: 448.64 / 3330 = 0.135 2012: 420.54 / 3130 = 0.134 2011: 357.93 / 2770 = 0.129 R.O.A = Net Income / Total Assets 2013: 448.64 /2080 = 0.216 2012: 420.54 / 1820 = 0.231 2011: 357.93 / 1680 = 0.213 Debt /Equity Ratio = Total Liabilities/ Equity 2013: 303.09 / 1770 = 0.171 2012: 255.47 / 1560 = 0.164 2011: 225.97 / 1460 = 0.155 R.O.E = Net Income / Equity 2013: 448.64 / 1770 = 0.253 2012: 420.54 / 1560 = 0.269 2011: 357.93 / 1460 = 0.245 Inventory Turnover = inventory / Sales 2013: 784 / 3330 = 0.235 2012: 715 / 3130 = 0.228 2011: 646 / 2770 = 0.233 Fastenal industry’s statistics Market Capitalization 493B Price / Earnings 28.1 Price / Book 25.4 Net Profit margin 4.2% R.O.E 16.4% D / E 51.4 Dividend Yield 1.8% Capital Accounts The total assets and total liabilities of Fastenal Company are less than those in Masco Corporation are in the three-year period. While the total assets and liabilities in Fastenal Company rise steadily over the three-year period, those in Masco Corporation fall then rise slightly. Fastenal Company finances its operation mainly through equity finance as compared to Masco Corporation that finances its operation majorly through Long-term debt. The high debt-equity ratio of Masco Corporation over the three-year period as compared to Fastenal Company heavily supports this fact. The present book value of Fastenal Company stock is $197 and that Masco Corporation is $16. However the two companies’ stock to book value is almost the similar due to the fact that there current market values of $ 451 and $36.9 respectively lead to the ratios of 2.29 and 2.31respectively.Both these companies’ stock price to book ratios are lower than their industries’ averages. This indicates that both their stock prices are not as volatile as those of their competitors are. Another similarity in the two companies is that despite them having almost equal working capital over the three-year period, their working capital rise steadily. This is a positive indicator since it shows that both the companies are able to finance their current liabilities with their current assets thus preventing any liquidity problems. Fixed Assets (Property account) Fastenal Company The Company states equipment and property at original cost and provides for depreciation using the straight-line method over their entire useful lives. In cases where it is hard to recover the carrying amount of an asset, revision of the fixed assets is necessary. Comparison of the forecasted cash flows of the fixed asset to its carrying value takes place. If the total cash flows are less than the carrying value then there is need for asset reviewing. Reviewing of an asset takes place up to a point when the carrying value exceeds the fair value. Calculation of the fair value uses techniques such as third-party appraisals, quoted market values, and discounted cash flow models. In this company, no impairments occurred in the three-year period. Masco Corporation Similarly, this company records equipment and property at cost. During disposal, there is elimination of cost and accumulated depreciation from the accounts and the gains or losses arising are included in the financial statements. It charges the repairs and maintenance costs of the property and equipment against earnings as they incur. It reviews equipment and property as events occur that would reduce the fair value of the equipment and property below the carrying amount (masco.com) Intangible and Non-current Assets Fastenal Company This company has non-compete agreements, goodwill, prepaid security deposits, and other related intangible assets. Calculation of goodwill is the fair value subtracted from the purchase price of net assets acquired. The Company reviews goodwill annually to adjust it for impairment Masco Corporation This company does its yearly impairment of goodwill as events that would probably reduce its fair value below its carrying value or if that is not the case, in the fourth quarter of each year. The company has finished the testing of goodwill impairment at the initial operating level. The operating segments of the company reports on units that involve business activities that discrete financial data is available. The company does a comparison of the carrying value and fair value of reported units to perform goodwill testing. Calculation of fair value uses a discounted cash flow approach that incorporates important unobservable inputs. Deferred Taxes and the treatment of taxes Fastenal Company This company accounts for income taxes using the liability and asset approach. This approach reports liabilities and deferred tax assets for the future tax computation. It is responsible for the differences between the consolidated financial statement carrying amounts of existing liabilities and assets and their tax levels. Deferred tax liabilities and assets are determined using pre-determined tax rates that is applicable in future years’ taxable income whose temporary differences settle. Recognition of the effect on deferred tax liabilities and assets that occur because of tax rate changes is as income occurs in the period that incorporates the date of enactment. The effect of income tax positions are recognized only if it is probable that the will be sustained. Recognized income tax positions computation is greater than what is realizable. Recording of changes in measurement or recognition happens in the period that the change occurs. The company record penalties and interest related to unrecognized tax benefits in the income tax expense. Masco Corporation Just like the previous company, this company records its uncertain tax positions and interest in the income tax expense. The accounting approach for income taxes demand that the realization of deferred tax liabilities and assets rely on the availability of enough taxable income in the future periods. It records sources of taxable income include, tax planning strategies lead to future gains, the future existing taxable differences as deferred tax liability, and taxable income that includes taxable income in past periods carried forward and forecasted future taxable income. Current Assets Fastenal Company The current assets of this company rise steadily over the three-year period. They rise from 1.24B to 1.29B then shoots to 1.41B. The current ratio declines from 6.602 in 2011 to 6.318 in 2012 and finally to 5.879 in 2013. This decline does not affect its liquidity since all these ratios are greater than one and there above industry averages. The quick ratio also declines from 3.163 in 2011 to 2.816 in 2012 and eventually to 2.61 in 2013.Though there is a decline in the quick ratios over the years, it shows that the company maintains high-level liquidity. This is because it can finance all or almost all of its current liabilities using other current assets apart from inventories. The quick ratios are also above the industry averages (fastenal.com). Masco Company The company maintains a steady level of current assets over the three-year period. Its total current assets are 3.43B in 2011, 3.22B in 2012 and 3.47B in 2013.The current ratios increase from 1.45 in 2011 to 1.73 in 2012 and the to 1.95 in 2013.All these ratios are greater than one indicating that the company maintains a good liquidity level. It is quite impressive that the current ratio increases over the years; it indicates that the company is improving its liquidity. The quick ratio also increases over the three-year period, from 1.13 in 2011 to 1.31 in 2012 and currently in 1.52 in 2013. Even though the ratios are slightly above one, it still shows a positive sign about the liquidity of the company. The company does not have to depend heavily on inventory to finance its current liabilities. Liabilities Fastenal Company The total liabilities increase from $225.97M in 2011 to $255.47M in 2012 and eventually to $303.09M in 2013. This increase in liabilities is because of the steady increase in total assets over the years in evaluation. This is very little debt for the company. This largely explains why the current ratios and quick ratios of the company over the years are greater than one by a big margin. The little debt of these company leads to a little debt-equity ratio over the three years, 0.155 in 2011, 0.164 in 2012 and 0.171 in 2013.This shows that the company is mainly depending on equity to finance its operations. Masco Corporation The level of total liabilities is usually is maintained over the three years though with slight differences. It is $6.56B in 2011, $6.34B in 2012, and then $6.17B in 2013. The large number of liabilities is mainly because of the high levels of non-current liabilities. This debt is very high leading to a high debt equity ratio of 8.84 in 2011, 11.87 in 2012, and 8.087 in 2013. This is an indication that the company heavily relies in debt to finance its operations as compared. Hidden Assets Both these companies do not have any hidden assets. All owned assets are properly recorded in there appropriate accounts and reported in the statement of financial position. Profitability of the companies Some of the ratios that help in determining the profitability of these companies are net profit margin ratio, gross profit margin ratio, return on assets ratio, and the return on equity ratio. Fastenal Company’s net income increases over the three years, $357.93M in 2011, $420.54M in2012 and $448.64M in 2013. Gross profit margin and net profit margin is steady over the three-year period. The gross profit margin is 0.516, 0.514, and 0.517 respectively while the Net profit margin is 0.129, 0.134, and 0.135 respectively. Though the net profit margin is lower than the industry average of 2.3% it still shows that company is profitable. This company maintains a steady return on assets and return on equity over the years. Masco Corporation registers a loss of $468M and $78M in 2013 and 2012 respectively after making a profit of $276M.This causes the company to make negative net profit margin in 2012 and 2013 which shows bad performance compared to the industry average of 4.2% (market watch). These companies should use cheaper sources of finance such as improving on their working capital management. This will increase their profit margins. Diversifying their operations is also another way in which the specific companies can improve on their profitability. Both companies have less return on assets and return on equity ratios compared to their specific industry averages. Masco Corporation is worse since it has negative values in both the two ratios. DuPont Analysis. Fastenal Company: ROE = Profit Margin * Total Asset Turnover * Leverage factor ROE = (Net income/Revenues) * (Revenues/Total Assets) *(Total Assets /Equity) ROE = (448.64/ 3330) * (3330/2080) * (2080/1770) = 0.253 This DuPont analysis uses profit margin, total asset turnover and leverage factor to show the weak and strong areas of the company. This analysis shows that the operating efficiency, asset efficiency and the debt factors are all good. Masco Corporation: ROE = (-468/ 7470) * (7470/6930) * (6930/763) = - 0.613 In this DuPont analysis, the negative ROE is because of the negative operation efficiency that is because of the losses that the company had in 2013. Works cited Web. 28 Jan. 2015. . Top of Form Bottom of Form "Annual Reports." Fastenal Company -. Web. 28 Jan. 2015. . Top of Form Bottom of Form "Fastenal Co." FAST Stock Quote. Web. 27 Jan. 2015. . Top of Form Bottom of Form "Symbol Lookup." Stock Ticker. Web. 28 Jan. 2015. . Read More
Cite this document
  • APA
  • MLA
  • CHICAGO
(Financial Analysis of Fastenal (FAST) and Masco Corp. (MAS) Research Paper, n.d.)
Financial Analysis of Fastenal (FAST) and Masco Corp. (MAS) Research Paper. https://studentshare.org/finance-accounting/1857210-financial-analysis-of-fastenal-fast-and-masco-corp-mas
(Financial Analysis of Fastenal (FAST) and Masco Corp. (MAS) Research Paper)
Financial Analysis of Fastenal (FAST) and Masco Corp. (MAS) Research Paper. https://studentshare.org/finance-accounting/1857210-financial-analysis-of-fastenal-fast-and-masco-corp-mas.
“Financial Analysis of Fastenal (FAST) and Masco Corp. (MAS) Research Paper”. https://studentshare.org/finance-accounting/1857210-financial-analysis-of-fastenal-fast-and-masco-corp-mas.
  • Cited: 0 times

CHECK THESE SAMPLES OF Total Liabilities of Fastenal Company

S.W.O.T. Analysis of Maaco Auto Body & Painting

analysis of MAACO Auto Body Shop.... n this regard, this essay aims to proffer a SWOT analysis of MAACO, by reviewing the ... As revealed by All Business, “the company has ranked high in financial strength for two consecutive years, and this year its Web visibility improved significantly (from #202 to #106).... The unique franchising strategy entices investors to open new shops due to the financial prospects and the number of clientele who continue to patronize MAACO auto body shops....
7 Pages (1750 words) Research Paper

The Construction Methods Used in Self-Build Schemes

The paper "The Construction Methods Used in Self-Build Schemes" highlights that most self-builders were primarily motivated to self-build due to the financial incentives offered by the government.... financial incentives for people who will opt to self-build homes.... It was noted that offering such financial incentives proved to be cheaper in the long run for the government, and for the homeowners, the satisfaction of erecting their house to their own design and specification....
31 Pages (7750 words) Dissertation

Financial Analysis

This paper hence seeks to give a detailed strategic review and financial analysis of two organizations: Morrison and Target.... The analysis of financial statements is useful to one and every stakeholder such as the employees, managers, creditors and suppliers, government agents, researchers, customers, lenders, and financial analysts.... This paper ''financial analysis'' tells us that financial analysis is the study of organizational financial operations and forecasts to monitor, budget, and improve the finance base of an organization....
10 Pages (2500 words) Assignment

Explorations of Marco Polo

Marco Polo (1254 - 1324), the Italian explorer who found most of Asia for the Europeans, gained reputation for his worldwide travels and is considered the greatest of the European explorers.... The great explorers of the history such as Columbus, Bartolomeu Dias, Vasco da Gama, and Marco Polo have done important service to humanity in general and to the Europeans in particular....
4 Pages (1000 words) Essay

Masco Corporations Strategic Planning

ADVISE framework is a useful method of describing masco Corporation's current strategy.... masco Corporation has developed a brand image in the manufacturing of consumer durable products for kitchens and bathrooms.... n 1986, masco Corporation developed its vision statement, which reflected its desire to become "Procter & Gamble of consumer durables" (Harvard Business School, 1998).... masco's resourcesThe resources of masco Corporation can be categorized into two types i....
4 Pages (1000 words) Case Study

Financial Analysis of Coca-Cola

The aim of this project "financial analysis of Coca-Cola" is to analyze the financial standing of the Coca Cola Company using ratio analysis as a tool, and to show how this can determine whether Coca Cola is financially appealing to attract further investors.... The financial analysis of Coca Cola Company, having multinational operations, calls for critical analysis of its financial status in order to have wealth maximizing action consistent with the preservation of the wealth of stakeholders....
40 Pages (10000 words) Capstone Project

Ration Class of Fastenal Company

The author of the present case study "Ration Class of fastenal Company" mentions that Fastenal Company is a company that is publicly traded in the stock market.... Financial ratio analysis is the calculation of harmonized relationship of figures that appear in the financial statements.... These relationships are known as ratios and they are very useful in analyzing the financial performance and financial position of a business....
4 Pages (1000 words) Case Study

Marketing Fundamentals

This essay discusses that with globalization taking place at a fast pace, the demand for McDonald's products may change.... ith globalization taking place at a fast pace, the demand for McDonald's products may change.... Also, as women and men both start working across the globe; there will be an increased trend to buy from fast-food chains.... echnological progress is fast integrating the industry and the customers are also becoming technologically advanced....
22 Pages (5500 words) Essay
sponsored ads
We use cookies to create the best experience for you. Keep on browsing if you are OK with that, or find out how to manage cookies.
Contact Us