StudentShare
Contact Us
Sign In / Sign Up for FREE
Search
Go to advanced search...
Free

The Cost Effectiveness of Using a Dashboard to Measure Key Metrics in the Hospital Industry - Example

Cite this document
Summary
In this information age, majority of the industries throughout the world are resorting to the use of business intelligence in order to monitor their performance rigorously. The Hospital Industry is not an exception to this fact with top performers who have implemented business…
Download full paper File format: .doc, available for editing
GRAB THE BEST PAPER96.2% of users find it useful
The Cost Effectiveness of Using a Dashboard to Measure Key Metrics in the Hospital Industry
Read Text Preview

Extract of sample "The Cost Effectiveness of Using a Dashboard to Measure Key Metrics in the Hospital Industry"

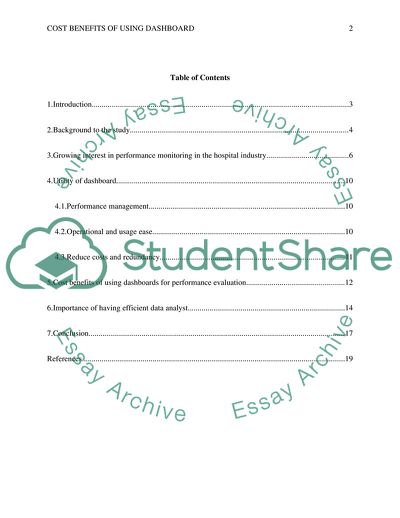
The Cost Effectiveness of using a Dashboard to measure Key Metrics in the Hospital Industry of the of the Table of Contents 1.Introduction 3 2.Background to the study 4 3.Growing interest in performance monitoring in the hospital industry 6 4.Utility of dashboard 9 4.1.Performance management 9 4.2.Operational and usage ease 10 4.3.Reduce costs and redundancy 11 5.Cost benefits of using dashboards for performance evaluation 12 6.Importance of having efficient data analyst 13 7.Conclusion 17 References 19 1. Introduction In this information age, majority of the industries throughout the world are resorting to the use of business intelligence in order to monitor their performance rigorously. The Hospital Industry is not an exception to this fact with top performers who have implemented business intelligence for the purpose of precise data analysis in order to run their operations. Business intelligence systems work as a magnifying glass that is set up in all areas of an organization’s performance management framework that helps analysts to unlock and report the reasons behind the financial figures achieve by the organization. The insights provided by business intelligence systems help hospital organization to maximize their revenue, minimize expenditures and increase profitability that is facilitated by an information intensive decision making process (Watson & Wixom, 2007). Business intelligence basically refers to a wide base of business management programs or software applications which are primarily responsible for retrieving, storing, evaluating and providing admittance to operating data that allows enterprise owners to make informed judgments. The applications encompass aspects such as data assistance, query management and reporting, data mining and online analytical processing (OLAP). The contemporary information age has witnessed the dawn of a new variant of business intelligence that has taken information intensive decision making framework to a whole new level. This new variant is known to majority of the world’s population as on-screen dashboards. Dashboards are mobile graphic displays that display complex information quickly in order for managers to be able to respond rapidly to variations in performance. While conventional spreadsheets involve the use of cross tab spreadsheets that work on the basis of line by line searches for particular data, dashboards are much faster which facilitates quicker and relatively confident decision making. This is precisely because dashboards have the capability to translate numerical data from multiple corporate databases into visually rich presentations that can be easily interpreted. Maps, Gauges, charts and several different graphical elements exhibit multiple results in a visual format that relieves managers from going through cumbersome hard copies of performance reports which in turn saves a lot of their time and cost (Ranjan, 2009). It is with regards to facts mentioned above that the researcher endeavors to conduct a thorough research on the cost benefits of tracking key performance drivers in a dashboard. This will enable the researcher to have a comprehensive idea about the utility of dashboard and the impact of this business intelligence system in enhancing organizational performance with particular emphasis on the hospital industry. 2. Background to the study Given the fact that the intensity of competition in the hospital sector is tremendously high, organizations operating in this industry are resorting to new and innovative techniques in order to enhance their operational efficiency and convert the same into profitability (Aragon Penoyer, et al., 2014). In order to be able to achieve the above mentioned objectives organizations in this sector require enhanced accounting procedures, robust performance measurement framework, improved strategic planning and forecasting capability. In such a context it can be said that the data retrieved by the business intelligence platforms such as dashboards and other business application solutions play a crucial role in maintaining the financial health of the organization. Information technology powered dashboards which are also sometimes referred to as I-dashboard is a software application that has the capability to consolidate various data sources such as purchasing platforms, bookkeeping databases and other POS systems in once centralized location (Chen & Keh-Wen Carin, 2013). This in turn creates a powerful analytical platform that enables end users to identify and analyze trends, monitor performance metrics and keep track of sales at a glance. One of the fundamental determinants of organizational success in the hospital sector is the level of customer/patient satisfaction. Provided the fact that this is a service industry, organizations emphasize a lot on improving the quality of products and services provided to the customers/patients/patients in order to enhance their loyalty and subsequently increase satisfaction index. This is precisely the reason why performance monitoring becomes a necessity for organizations operating in this sector. Achieving operational efficiency is a key organizational objective and the same is ensured by the incorporation of dashboard base performance analysis. As far as the hospital industry is concerned, I-dashboards can prove to be immensely beneficial when it comes to creating interactive intelligence (Dennis, 2012). It serves as a guidance tool for analysts who are able to evaluate key performance metrics with the help of powerful visuals as well as an intuitive user-interface. Dashboards provide a cost effective means for companies to manage their inventories in an appropriate manner. It reduces the workload of inventory managers by a huge margin and also reduces the need for extra workforce for inventory management. Given the fact that having adequate inventory in reserve for organizations such as hospitals is highly critical, appropriate management of inventory becomes imperative. In such cases dashboards plays a crucial role in updating critical information regarding inventory stocks thereby notifying the inventory managers about the time when inventory replenishment will be required. This in turn helps managers to restock their inventory in time thereby avoiding any delay in the delivery of products or services (Duarte, Goodson & Dougherty, 2014). This is just one aspect of implementing business intelligence system with the help of dashboards. This component also has a significant contribution in providing HR managers with a cost effective means of managing staffs and employment procedures. Other areas that are also facilitated by this information analysis platform are front house management, sales and marketing, bar and cellar management as well as finance and administration (Gehlert, Ressler & Baylon, 2013). Dashboards have served as a robust analytical platform that has assisted managers of hospitals to identify the strengths and weaknesses that lie within the organization which in turn places them in a position whereby they are able to formulate appropriate strategies to tap the strengths and address the areas of improvement. This business system provides mangers with a holistic view of the organization which in turn makes managing organizational performance convenient for them. The overall workload is evenly distributed within the organization which in turn enhances the operational efficiency. Consequently organizations are able to achieve cost and time efficiency as well as which gets translated into increased profitability (Kimmel, 2002). 3. Growing interest in performance monitoring in the hospital industry In an intensely competitive industry such as the hospital industry, it is highly imperative for hospital managers to have a holistic view of each and every aspect of their business. This is primarily because it helps managers to analyze the key performance indicators that are highly important as far as meeting customer expectation is concerned. Ensuring optimal price and quality of product and service offerings are critical concerns of hospital managers throughout the world. This is precisely because customers/patients/patients in this sector have become very price sensitive. Therefore it becomes extremely critical for hospital managers to analyze the demand as well as the purchase behavior of their customers/patients. By doing so, managers can compare the efforts being made by their employees in order to satisfy the demand and meet the expectations of their customers/patients (Zaydfudim, et al., 2009). One of the salient features of organizations in the hospital industry is that they give extreme emphasis on enhancing their brand image. This is precisely because it is believed that their image in the market plays a critical role in dragging the attention of their customers/patients. The extent to which superior quality services are provided in hospitals is one of the key determinants of their brand image. The manner in which their physical evidence is exhibited in front of the customer/patient is another indicator of their brand image. Consumers are always drawn towards those hospitals which provide value for money and the two factors are perhaps the most important ones as far as adding value is concerned. Therefore to make sure that such happens, it becomes pivotal for hospital managers to make sure that the performance delivered by their staff are of exceptional quality. One way of doing that is to monitor their performance on a continuous basis. This is precisely because constant performance scrutiny will enable hospital managers to identify the areas of improvement (Choi, Lee & Rhee, 2013). Performance monitoring and management is also crucial when it comes to achieving operational efficiency. Provided the fact that a hospital consists of a number of functional departments, hospital managers have to make sure that each and every department are performing with the optimal level of efficiency. One of the fundamental reasons behind this fact is that a slack or delay in generating an output in one department will lead to subsequent delays in another department. Consequently, hospital managers have to realize considerable levels of cost and time inefficiency which is unaffordable provided that hospitals belong to service industry. Inefficient service delivery can have a significant negative impact in terms of tarnished reputation. As a consequence, a hospital’s customer base can get depleted by an unprecedented level (Kroch, et al., 2006). According to Tepeci (1999) in a highly competitive industry the necessity to ensure customer/patient satisfaction is very critical for a business’s survival precisely because of the demonstrated association between customers/patient’s loyalty and satisfaction. The requirement to provide satisfaction to customers/patients prompts managers in hospital industry to monitor the performance of the employees. This is precisely because the base of highly satisfied will become a sustainable source of revenue for hospital managers. This fact is particularly true for hospitals which are internationally recognized whose brand image is enhanced with every little improvement brought about in the quality of products and services offered by them. One of the most conventional strategies adopted by hospital managers is to set a performance benchmark that stands ahead of the standard maintained by their contemporaries. Subsequently hospital managers review the performance rigorously in order to assess and make sure that the benchmarks are being satisfied on a regular basis. Such strategy combined with a robust performance monitoring framework enables hospitals to attain sustainable competitive advantage in the market that is operates in. Importance performance analysis is one of the most sought after analytical approach adopted by hospital managers in the contemporary business environment. This approach has proven to be extremely effective when it comes to making an association between the importance that customers/patients place on a particular attribute of a hospital and the performance exhibition that is related to that attribute. This form of performance analysis not only enables hospital managers to compare the dimensions of various services offered by them but also enables them to conduct a matrix evaluation of the dissimilarities between these dimensions thereby allowing them to pinpoint areas that need to be revised in terms of resource allocation. The extension of this approach provides organizations in the hospital industry to evaluate their performance and compare the same with the service attributes (Foldy, et al., 2004). This is where the relevance of incorporating a dashboard oriented performance analysis and management framework lies in the hospital industry. Given the fact that dashboards are powered by information technology, it has the capability to enable hospital managers to conduct a thorough performance analysis of all its departments in a relatively convenient manner. The use of a dashboard nullifies the need to recruit additional officers for evaluating performance of individuals and the overall departments and compare the same with the satisfaction level of customers/patients. Dashboards provide a comprehensive image of the actual performance exhibited by employees and it also allows managers to understand the expectations of customers/patients on the basis of their purchasing behavior. Analysis becomes relatively inexpensive and easy with the help of dashboard. The ways in which this technology proves to be cost advantageous will be explained in details in the followings sections. Nonetheless, the facts that have been mentioned in this section justify the growing interest and need of performance monitoring and evaluation in the hospital industry. This in itself speaks for the cost efficient contribution that usage of dashboards may have in enabling hospital managers to identify the key performance indicators of their organization. 4. Utility of dashboard 4.1. Performance management The fact that determines the uniqueness of hospital operators and management is the way in which they direct their enterprises. Every company has its own sets of performance indicators which indicate the key strengths that are needed to be tapped in appropriately in order to maximize revenues. It is in this context that business intelligence dashboards have come to great use for hospital managers throughout the world. As mentioned above that performance indicators vary from hospital to hospital, therefore identification and assessment of these indicators will also vary in a similar manner. In such respect business intelligence dashboards can prove to be extremely beneficial as it has the capability to depict customized data on screen which is designed for each company. Consequently, this application helps managers to focus on company specific data that serves as a guidance tool towards directing organizational operations (Choi, Lee & Rhee, 2013). 4.2. Operational and usage ease Hospital groups who have multiple properties at their position benefit the most from the implementation of executive dashboards. This is particularly because these dashboards have the capability to provide 50,000-foot view of a particular hospital’s portfolio across different locations, segments and flags. It is almost similar to a heads up display of international operations conducted by hospitals. For example, properties that are underperforming currently can be red flagged and the ones that are performing relatively well can be green flagged. This enhances the readability of the user. In addition to that this form of graphical reporting is faster to prepare and easy to comprehend. This innovative business intelligence system is comprehensively better from its preceding technology and facilitates rapid decision making. The application is very user-friendly and it does not require extensive training for a user to operate in it (Zaydfudim, et al., 2009). 4.3. Reduce costs and redundancy One of the salient features of dashboards is that they are capable of consolidating and integrating corporate information mainframe using common metrics, rules and definition. By standardization and consolidation of information, dashboards are able to eliminate any form of requirement for redundant silos that store information thereby underling single version of business intelligence. This reduces the costs for companies to have multiple mainframes that store information. Normally a huge workforce is required in order to prepare, analyze and subsequently process information. Nonetheless the requirement for workforce is also reduced by the use of dashboard applications precisely because the application has the capability to perform all the aforementioned activities with the help of consolidated information. The time taken by the dashboard to process critical information is far less compared to the time consumed by an official doing the same task over different platforms. A single performance dashboard has the capability to help hospital managers shut down multiple autonomous reporting system, data marts, warehouses and data marts and integrate all information into one centralized system which in turn makes it easier for hospital managers to look for the required information. Given the fact that analysis using dashboards are fairly easy and less time consuming, hospital managers can utilize the time for conducting other important activities. In that way they are able to reduce the cost of their operation. Moreover, due to reduced workforce requirement hospital managers can allocate their workforce resources appropriately which in turn also proves to be a cost effective strategy. Dashboards are easy to operate and the information displayed within the application is relatively easier to comprehend. Therefore, in order to use dashboard applications rigorous training is not required. This also saves a lot of cost for hospital managers as they would have had to incur huge cost behind hiring and training analysts to conduct information assessment over various platforms. Dashboard based business intelligence analysis also allows hospital managers to assess the operations that are being carried out as well as the effectiveness and efficiency of those operations. Several operations have to be repeated within a process which in turn produces a certain output. However, if these operations do not produce any output whatsoever in that case they are regarded as redundant. These redundant operations deteriorate the operational efficiency of functional departments within hospitals which in turn increase the cost of service provided. This is where the relevance of a dashboard lies. It helps hospital managers to identify the operations that are redundant and thereafter eliminate the same from the overall workflow process. In that way hospital managers are able to reduce the cost of products and service offered to the customers/patients (Chen & Keh-Wen Carin, 2013). 5. Cost benefits of using dashboards for performance evaluation The cost benefits of incorporating a dashboard application as a business intelligence system can be realized by hospital managers through a number of factors. For example, dashboard plays a crucial role in enhancing operational efficiency by reducing redundancy within work flow processes, streamlining every operation and reducing the need for extra work force for a particular operation. This in turn enables hospital managers to reduce the cost for every operation thereby increasing the margin of their operating profit. Another cost benefit of dashboard application is that it enhances the uptime for critical services. Given the fact that it consolidates information related to various aspects of a business into one centralized system, it enables employees to access the information required for an operation from a single system. This in reduces the time taken to conduct a critical operation. As a consequence cost borne per operation is also reduced. Dashboard has a significant contribution in improving the productivity of a company. The information that is displayed within the dashboard enables managers to understand the areas of slack. Following this they are able to taken an appropriate course of action that can reduce the slack by a drastic margin and enhance the overall productivity. Given the fact that dashboard also has the capability to conduct inventory management it enables hospital managers to realize economies of scale and scope. Consequently managers are able to reduce the cost of products and services sold by a significant level (Gehlert, Ressler & Baylon, 2013). Incorporation of dashboard proves to be immensely beneficial when it comes to reducing the mean time to repair business critical IT services. Provided that dashboard itself is powered by information technology, it has the capability to pin point the business critical IT services that are not functioning in an appropriate manner thereby causing further delays in operations. Having identified the delay, the dashboard enables users to repair the business critical IT services in a very short time which in turn brings down the Mean-Time-to-Repair business-critical IT services by considerable amount. As a consequence of this reduction hospital managers are able to enhance their operational efficiency as well as reduce the cost of operations. The implementation of dashboard enables hospital managers to optimize their usage of IT resources. It reduces the use of additional IT mainframes which have relatively higher costs. This is precisely because dashboard has the capability to store information in a single mainframe. As a result of this the cost of maintaining additional IT resources are reduced which in turn contributes towards increasing the profit margin for hospitals. 6. Importance of having efficient data analyst Having a team of individuals, who are able to successfully analyze and summarize the data and thereafter subsequently communicate the same throughout the organization, is very important for organizations operating in the hospital industry. First of all, it has to be kept in mind that one of the fundamental determinants of a hospital’s success is the satisfaction index of customers/patients. Therefore it becomes crucial for hospital managers to understand the expectation of the market wide customers/patients. This is particularly one of the reasons why hospital managers need to analyze the buying pattern of customers/patients, their trend, tastes and preferences. This is where the relevance of an individual with sound analytical skills lies. They are primarily responsible for conducting analysis regarding purchasing behavior of customers/patients and thereafter convey this information throughout the organization. This information plays a critical role in enabling hospital managers to formulate and implement appropriate strategies. It can become quite complicated to handle such information unless the information is appropriately summarized. Summarizing complex data in simplex form is one of the fundament responsibilities of analyst. This is precisely because this information serves as a robust guidance tool during managerial decision making (Fayyad, Piatetsky-Shapiro & Smyth, 1996). Market research is arguably one of the most crucial tools implemented by organizations in the hospital industry in order to analyze their image in the market. Market research analysts conduct number of surveys and interviews in order to collect feedbacks and opinions from their customers/patients as well as random people. This enables them to learn about their expectations and their understanding of quality of service. In that way they are able to highlight the areas of improvement that needs to be addressed specially in hospitals. The surveys and interview data needs to be arranged appropriately and summarized in a professional manner. This report is then demystified in front of the managerial boards in order for them to be able to take an appropriate course of action. As far as hospital industry is concerned, presentation is of optimal importance. This is precisely because the way information is communicated throughout the organization determines the effectiveness with which that information will be put to practice. Individuals with good analytical skills are highly important when it comes to interpreting the data displayed in dashboards. This is precisely because dashboard compiles critical business information that is related to various aspects of a business and displays it in a single screen. This data can become very confusing at times and therefore making a proper interpretation of the same is highly imperative. The data needs to be organized and analyzed in a proper manner precisely because this information serves as a robust platform whereby analysts can make predictions regarding the future performance of the company. The data displayed in the dashboard needs to scrutinized rigorously in order for hospital managers to have a comprehensive view of the market so that hospital managers can set a benchmark of their own depending upon various market wide factors. The analysis of dashboard information is critical for risk assessment and subsequent management. Such analysis helps analysts to assess the risk that a particular hospital is exposed to. For example, analysis of dashboard information can enable analysts to understand if a hospital is exposed to product or service obsolescence risk. Such form of analysis can only be conducted by individuals who have sound understanding of data analysis as well as the knowhow of operating dashboard based applications. Thereafter analysts have to prepare summary reports of their findings which are needed to be conveyed appropriately to the managerial board in order for them to be able to implement effective strategies (Fayyad, Piatetsky-Shapiro & Smyth, 1996). Data analysts play a crucial role in identifying the key performance indicators that needs to be maintained steadily in order for any business to prosper. This holds particularly true for organizations that are based in the service industry or hospital industry. Normally four perspectives are considered while analyzing the key performance indicators in any hospitals. They are financial perspective, consumer perspective, internal business perspective and learning and innovation perspective. Based upon these perspectives assessment needs to be carried as to which factors should be identified as the fundamental indicator of business’s performance. For example, net cash flow, operating profit, leverage ratio and revenue stream are some of the factors within the financial perspective category which serve as basic indicators of how a particular business is performing. Based upon this analysis managers need to focus on these indicators so as to make sure that a healthy figure is maintained for each of those factors in order to ensure that the business is financially healthy. Similarly customer loyalty index, growth rate of customers/patients, repeat visits and purchases by customers/patients are some of the key indicator’s of performance especially for hospitals. This is precisely because a hospital’s success depends largely on the level of customer satisfaction. Therefore hospital managers need to monitor and review its customer satisfaction index in order to make sure that their services are meeting the expectations of their customers/patients. The better the result of this key performance indicator the better off will be the hospital. Such an extensive analysis needs to be carried out with extreme precision and the results of this analysis has to be conveyed throughout the length and breadth of the hospital in order to ensure the objective of the hospital managers is completely alignment with the objectives of the employees. This in turn enables companies to realize cost as well as time efficiency. The facts that have been mentioned above justify the necessity to incorporate dashboards. This is precisely because this application has the capability to assess different business aspects of an organization according to the inputs provided by the user and thereafter identify the key performance indicators that has to be emphasized on (Fayyad, Piatetsky-Shapiro & Smyth, 1996). 7. Conclusion In the contemporary business environment the intensity of competition between organizations has increased to an all new level. The situation in same in every industry, however the intensity seems to be higher in case of the hospital industry given that organizations in this sector thrive to enhance the satisfaction level of their customers/patients with every possible opportunity available at their disposal. This is precisely the reason why hospitals in this sector resort to the adoption of innovative strategies in order to attain competitive advantage and beat the competition in the market. One such strategy is the incorporation of business intelligence system within the organization’s analytical framework. The modern development of business intelligence system which is being rigorously used in the hospital industry is a dashboard. The dashboard is a software application (available in various formats) that enables managers to have a comprehensive view of the overall business process within an organization. It is one of the cost effective ways available to hospital managers to analyze the key performance indicators of their organization. The application has the capability to consolidate critical information related to various aspects of a business and present them in a compact and precise manner that is easy to understand. It proves to be immensely beneficial when it comes to learning about the strengths and weaknesses of an organization. This information processed by this tool serves as a robust foundation that facilitates sound management decision making. Given the fact that the application has the capability to store, process and analysis large chunks of data in a considerably little time. It enables organizations to achieve cost as well as time efficiency. It reduces the need for extra work force which in turn enables managers to channelize their workforce effectively. As a result of that the cost of production gets significantly lowered. It helps analysts understand the trend in the market based upon which appropriate strategies could be formulated and subsequently implemented. All these factors call for the necessity to incorporate a business intelligence dashboard in order to increase their operational efficiency thereby gaining considerable level of competitive advantage. References Aragon Penoyer, D., Cortelyou-Ward, K. H., Noblin, A. M., Bullard, T., Talbert, S., Wilson, J. & ... Briscoe, J. G. (2014). Use of Electronic Health Record Documentation by Healthcare Workers in an Acute Care Hospital System. Journal of Healthcare Management, 59(2), 130-144 Chen, K. & Keh-Wen Carin, C. (2013). Using systems thinking to analyze health care in the united states: should we move to a government sponsored health care system?.Academy Of Health Care Management Journal, 9(1/2), 3-12. Choi, J., Lee, W. & Rhee, P. (2013). Cost-benefit analysis of electronic medical record system at a tertiary care hospital. Healthcare Informatics Research, 3, 205-214. Dennis, V. (2012). Adding insight to using analytics to improve public sector. Journal of Government Financial Management, 11-14. Duarte, N., Goodson, J. & Dougherty, T. M. (2014). Managing innovation in hospitals and health systems: Lessons from the Malcolm Baldrige national quality award winners. International Journal of Healthcare Management, 7(1), 21-34 Fayyad, U., Piatetsky-Shapiro, G., & Smyth, P. (1996). From data mining to knowledge discovery in databases. AI magazine, 17(3), 37. Foldy, S. L., Biedrzycki, P. A., Baker, B. K., Swain, G. R., Howe, D. S., Gieryn, D. ... & Pemble, K. R. (2004). The public health dashboard: a surveillance model for bioterrorism preparedness. Journal of Public Health Management and Practice, 10(3), 234-240. Gehlert, K. M., Ressler, T. &Baylon, D. (2013). Global challenges demand global education of systems thinking. Human Systems Management, 32(2), 79-94. Kimmel, K. (2002). The technological approach to enhancing patient safety. Health Information and Management Systems Society, 1-7. Kroch, E., Vaughn, T., Koepke, M., Roman, S., Foster, D., Sinha, S. & Levey, S. (2006). Hospital boards and quality dashboards. Journal of Patient Safety, 2(1), 10-19. Ranjan, J. (2009). Business intelligence: concepts, components, techniques and benefits. Journal of Theoretical and Applied Information Technology, 9(1), 60-70. Watson, H. J. & Wixom, B. H. (2007). The current state of business intelligence. Computer, 40(9), 96-99. Zaydfudim, V., Dossett, L. A., Starmer, J. M., Arbogast, P. G., Feurer, I. D., Ray, W. A., ... & Pinson, C. W. (2009). Implementation of a real-time compliance dashboard to help reduce SICU ventilator-associated pneumonia with the ventilator bundle. Archives of Surgery, 144(7), 656-662. Read More
Cite this document
  • APA
  • MLA
  • CHICAGO
(The Cost Effectiveness of using a Dashboard to measure Key Metrics in Research Paper, n.d.)
The Cost Effectiveness of using a Dashboard to measure Key Metrics in Research Paper. https://studentshare.org/finance-accounting/1839266-the-cost-effectiveness-of-using-a-dashboard-to-measure-key-metrics-in-the-hospital-industry
(The Cost Effectiveness of Using a Dashboard to Measure Key Metrics in Research Paper)
The Cost Effectiveness of Using a Dashboard to Measure Key Metrics in Research Paper. https://studentshare.org/finance-accounting/1839266-the-cost-effectiveness-of-using-a-dashboard-to-measure-key-metrics-in-the-hospital-industry.
“The Cost Effectiveness of Using a Dashboard to Measure Key Metrics in Research Paper”. https://studentshare.org/finance-accounting/1839266-the-cost-effectiveness-of-using-a-dashboard-to-measure-key-metrics-in-the-hospital-industry.
  • Cited: 0 times

CHECK THESE SAMPLES OF The Cost Effectiveness of Using a Dashboard to Measure Key Metrics in the Hospital Industry

Significance of Performance Management in the Middle East

In hospital industry the performance of employees are vital for company's success.... the hospital was established by the joint venture between government of ‘Ras Al Khaimah' and ‘ETA Star Healthcare' in Dubai city.... The design of the hospital is developed by Eller Becket which is one of the top engineering, interior design and manufacture companies of the US.... industry Report OR Design of a Performance Abstract In an organization with effective performance management, the managers perform performance management process and carry out each component of the process effectively....
11 Pages (2750 words) Essay

Researching reporting dashboard features for marketing automation tools

It allows for a single view into one's data across every source, as well as pre-calculated key metrics like revenue by channel and acquisition, customer retention over time and by value, and lifetime value by segment or acquisition source (Agilone.... glione is a powerful business intelligence tool that is also easy to use as a dashboard tool and a marketing intelligence application.... Measurements that marketers can carry out using Neolane's technology include transaction data, marketing data, key performance indicators, and execution data....
4 Pages (1000 words) Research Paper

Effective Resource Management

A key aspect of leadership is that of aligning people with the goals and values of the company.... The questions raised in the articles under analysis in this document are: can the firm deal with changes in demand or can it withstand a price war, has it the financial backing to invest in new technology, as well as other questions that deal with issues of resource balance....
10 Pages (2500 words) Essay

The Hold as Management Tool

The history reflects the impact of the Control or Hold on the employees in a clear way, so that industry should observe more profitable and productive ways of dealing with employee management.... The present paper illustrates the concept of Hold as a Tool used by management during the organizational design, structuring and during the change management....
69 Pages (17250 words) Essay

The deficiencies of using dashboards

In recent time, excessive scrolling to watch all the data of a dashboard is pulling the usage rate of the same downwards.... mportant for the IT department of any organization and at the same time this dashboards are helpful to “displays the current status of metrics and key performance indicators (KPIs) for an enterprise.... Among all the players, Oracle is most well known for making Business Intelligence dashboard as in their opinion, dashboard is most important for the IT department of any organization and at the same time this dashboards are helpful to “displays the current status of metrics and key performance indicators (KPIs) for an enterprise....
2 Pages (500 words) Essay

Healthcare dashboards and metrics

Below is a description of a healthcare metric that I would include in a dashboard.... Incidence of pre-hypertension is an example of a healthcare metric that I would include in a dashboard.... About 33 percent of American adults suffer from the condition that causes Healthcare dashboards and metrics February 23, Healthcare dashboards and metrics Prevention and management of diseases and infections is one of the major aims of the healthcare sector....
1 Pages (250 words) Assignment

Use of COBIT as Corporate Governance Audit Methodology

This study 'Use of COBIT as Corporate Governance Audit Methodology' focuses on a comparative analysis between two firms that use COBIT as the basic IT framework and the various uses and applications of COBIT and other IT systems for security management, performance management is also discussed.... ...
6 Pages (1500 words) Essay

He Deficiencies of Using Dashboards

a dashboard or business intelligence dashboard can be defined as 'a graphical interface that displays the current status of metrics and key performance indicators (KPIs) for an enterprise'.... The values on a dashboard can be manipulated in a way that affects real-time processes, such as manufacturing.... According to research findings of the paper 'The Deficiencies of using Dashboards', the dashboard is an integral part of modern-day business....
16 Pages (4000 words) Research Paper
sponsored ads
We use cookies to create the best experience for you. Keep on browsing if you are OK with that, or find out how to manage cookies.
Contact Us