StudentShare
Contact Us
Sign In / Sign Up for FREE
Search
Go to advanced search...
Free

Measuring Performance - Essay Example

Cite this document
Summary
a. Gross Margin is defined as the percentage difference between Revenue and Cost of Sales. Therefore, Gross Margin for the year = (3679 – 2308) / 3679 * 100 = 37.266%
Gross Margin for the year 2011 = (5331 – 3594) / 5331 * 100 = 32.583%
Net Margin is…
Download full paper File format: .doc, available for editing
GRAB THE BEST PAPER91.9% of users find it useful
Measuring Performance
Read Text Preview

Extract of sample "Measuring Performance"

a. Gross Margin is defined as the percentage difference between Revenue and Cost of Sales. Therefore, Gross Margin for the year = (3679 – 2308) / 3679 * 100 = 37.266% Gross Margin for the year 2011 = (5331 – 3594) / 5331 * 100 = 32.583% Net Margin is defined as the percentage of net income of revenue. Therefore, Net Margin for the year 2010 = 91 / 3679 * 100 = 2.473% Net Margin for the year 2011 = 69 / 5331 * 100 = 1.294% Return on Capital Employed (ROTCE) is defined as the ratio of EBIT to the difference between Total Assets and Current Liabilities (Balance Sheet Ratios). i.e.

ROTCE = EBIT / (Total Assets – Current Liabilities) * 100 For year 2010, EBIT = EBT + Finance costs = 111 + 7 = 118 Total Assets = 822 Current liabilities = 297 ROTCE = 118 / (822 – 297) * 100 = 22.476% For year 2011, EBIT = EBT + Finance costs = 86 + 15 = 101 Total Assets = 1333 Current liabilities = 581 ROTCE = 101 / (1333 – 581) * 100 = 13.431% On the basis of these numbers in the two years, it can be said that Fresh and Fruity Ltd. has more than decent gross margins in both the years.

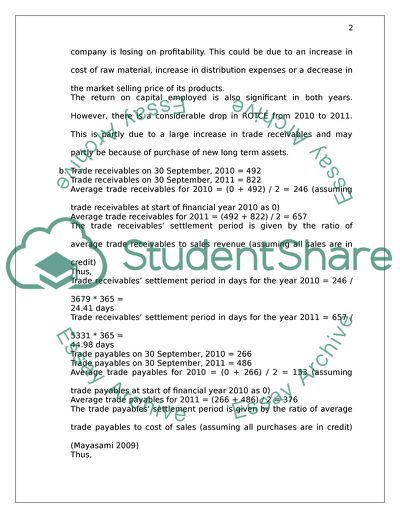
However, the net margins are quite low. This indicates that the company spends a huge amount on administration and distribution which affects the profitability. It is also observed that the revenue in 2011 is quite high as compared to 2010. However, the gross margins and net margins have reduced from 2010 to 2011. This implies that in generating greater sales, the company is losing on profitability. This could be due to an increase in cost of raw material, increase in distribution expenses or a decrease in the market selling price of its products.

The return on capital employed is also significant in both years. However, there is a considerable drop in ROTCE from 2010 to 2011. This is partly due to a large increase in trade receivables and may partly be because of purchase of new long term assets. b. Trade receivables on 30 September, 2010 = 492 Trade receivables on 30 September, 2011 = 822 Average trade receivables for 2010 = (0 + 492) / 2 = 246 (assuming trade receivables at start of financial year 2010 as 0) Average trade receivables for 2011 = (492 + 822) / 2 = 657 The trade receivables’ settlement period is given by the ratio of average trade receivables to sales revenue (assuming all sales are in credit) Thus, Trade receivables’ settlement period in days for the year 2010 = 246 / 3679 * 365 = 24.

41 days Trade receivables’ settlement period in days for the year 2011 = 657 / 5331 * 365 = 44.98 days Trade payables on 30 September, 2010 = 266 Trade payables on 30 September, 2011 = 486 Average trade payables for 2010 = (0 + 266) / 2 = 133 (assuming trade payables at start of financial year 2010 as 0) Average trade payables for 2011 = (266 + 486) / 2 = 376 The trade payables‘ settlement period is given by the ratio of average trade payables to cost of sales (assuming all purchases are in credit)(Mayasami 2009) Thus, Trade payables’ settlement period in days for the year 2010 = 133 / 2308 * 365 = 21.

033 days Trade payables’ settlement period in days for the year 2011 = 376 / 3594 * 365 = 38.186 days On the basis of above calculations, a few interesting facts come into picture. It is seen that in 2010, the trade receivables’ payment period is greater than trade payables’ payment period but the difference is only about 3 days. In 2011, the equation still remains the same but the difference increases to about 6 days. Fresh and Fruity Ltd is, therefore, paying to its suppliers earlier than it is receiving from its customers.

This implies that the working capital cycle is positive and the company has to depend upon a financial lender for its working capital. Secondly, the working capital position of the firm is deteriorating from 2010 to 2011 and therefore, it s financial costs in the form of interests have increased. c. With the proposed contract with the regional supermarket chain, the sales volume increase by 20% but the selling price for increased volume is 95% of the original selling price. Hence, net impact on sales revenue = 20% * .

95 = 19% Therefore, new revenue = 1.19 * 5331 (Assuming no other volume growth in 2012) = 6343.89 New cost of sales = 1.2 * 3594 (Assuming that all cost of sales vary with the production volume) = 4312.8 Gross Margin = (6343.89 – 4312.8) / 6343.89 * 100 = 32.016% The gross margin due to the new proposed contract would hence decrease though the sales revenue increases. Thus, the profitability of the company is impacted. This is primarily due to the discount the company is planning to offer to the supermarket chain.

Also, the supermarket chain is demanding a credit period of 60 days. This is very high as compared to the current trade receivables’ period of about 45 days. This would further deteriorate the working capital condition of the company and increase its financial costs. However, if the company sees long term benefits of this contract, it must try to offset these expenses by increasing its trade payables’ settlement period through supplier negotiations (Chartered Institute of Management Consultants).

References ‘Improving Cash Flow through Credit Management’, Chartered Institute of Management Consultants Maysami,Ramin 2009, ‘Understanding and Controlling Cash Flow’, Financial Management Series, U.S. Small Business Administration ‘Balance Sheet Ratios’, Available on < http://www.suu.edu/business/sbdc/pdf/balancesheetratios.pdf> February 02, 2012

Read More
Cite this document
  • APA
  • MLA
  • CHICAGO
(Measuring Performance Essay Example | Topics and Well Written Essays - 1000 words - 2, n.d.)
Measuring Performance Essay Example | Topics and Well Written Essays - 1000 words - 2. https://studentshare.org/finance-accounting/1765847-measuring-performance
(Measuring Performance Essay Example | Topics and Well Written Essays - 1000 Words - 2)
Measuring Performance Essay Example | Topics and Well Written Essays - 1000 Words - 2. https://studentshare.org/finance-accounting/1765847-measuring-performance.
“Measuring Performance Essay Example | Topics and Well Written Essays - 1000 Words - 2”. https://studentshare.org/finance-accounting/1765847-measuring-performance.
  • Cited: 0 times
sponsored ads
We use cookies to create the best experience for you. Keep on browsing if you are OK with that, or find out how to manage cookies.
Contact Us