StudentShare
Contact Us
Sign In / Sign Up for FREE
Search
Go to advanced search...
Free

Understanding and Interpreting Financial Statements - Case Study Example

Cite this document
Summary
The study deals with the financial information and analysis of J Sainsbury Plc and Marks and Spencer. For the basic understanding of the company’s ratio, the analysis will provide the performance and market position of the companies. This analysis offers a future-oriented action course…
Download full paper File format: .doc, available for editing
GRAB THE BEST PAPER98.9% of users find it useful
Understanding and Interpreting Financial Statements
Read Text Preview

Extract of sample "Understanding and Interpreting Financial Statements"

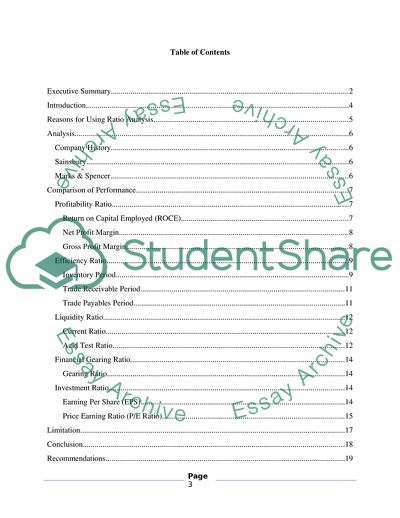
Understanding and Interpreting Financial Statements Executive Summary The study will deal with the financial information and analysis of J Sainsbury Plc and Marks and Spencer. The analysis will be discussed in two parts. Firstly there will be comparison over time of the two companies and then a comparative analysis will be applied. For the purpose of analysis the ratio analysis technique will be implemented. For the basic understanding of the company’s ratio, analysis will provide the performance and market position of the companies. This analysis will offer the future oriented action course that will enable the company to take corrective measures to increase their performance. Table of Contents Executive Summary 1 Introduction 3 Reasons for Using Ratio Analysis 4 Analysis 5 Company History 5 Sainsbury 5 Marks & Spencer 5 Comparison of Performance 6 Profitability Ratio 6 Return on Capital Employed (ROCE) 6 Net Profit Margin 7 Gross Profit Margin 7 Efficiency Ratio 8 Inventory Period 8 Trade Receivable Period 10 Trade Payables Period 10 Liquidity Ratio 11 Current Ratio 11 Acid Test Ratio 11 Financial Gearing Ratio 13 Gearing Ratio 13 Investment Ratio 13 Earning Per Share (EPS) 13 Price Earning Ratio (P/E Ratio) 14 Limitation 16 Conclusion 17 Recommendations 18 Appendix 19 20 References 21 Bibliography 24 Introduction The analysis is possible from the financial statements. For this purpose Sainsbury and Marks and Spencer financial statements were collected for the comparative analysis. For over-time comparison two year data of each company has been taken. The data made available for the comparison consisted of 2009 and 2008 years. Sainsbury and Marks & Spencer are the leading retailers in the UK and are competitors of each other. They have a tough competition over the market share and consumers. Both the companies have been in the UK market operations for more than 100 years (Shooter, 2010). Reasons for Using Ratio Analysis The ratio analysis that has been implemented in the study helps in measuring the firms’ profitability through various ratios. The ratios used in the analysis will provide information and help the management of the firms’ about the capacity of the business in terms of earning. The actual performance of the firms’ can be judged. The ratio analysis also helps in comparative analysis of the performances with the previous year. This helps the firms’ to identify the weakness and strengths and be able to take decisions that will improve the financial position of the firms. Analysis Company History Sainsbury Sainsbury has been operating for more than 140 years in the UK market and is one of the oldest retailers. It was established in 1869 by J. Sainsbury (Sainsbury, 2010). Currently it operates 890 stores that comprises of 547 supermarkets and 343 convenience stores. The brand of Sainsbury is built on healthy, safe, tasty and fresh food to consumers. The business is based upon quality and fair pricing (Sainsbury, 2010). Marks & Spencer Michael Marks opened a stall at Leeds Kirkgate Market in 1884 and the company was officially registered in 1901 (Marks & Spencer, 2010). M&S have more than 600 stores located throughout the UK market that ranges from great out-of-town and flagship stores that is over 100000 sq ft to uncomplicated stores around 7000 sq ft (Marks & Spencer, 2010). M&S is the UK’s largest cloth retailer. M&S sells high quality, stylish and great value clothing and home products. M&S sells outstanding quality foods which are sourced from 2000 suppliers globally and within the UK market (Marks & Spencer, 2010). Comparison of Performance Profitability Ratio Return on Capital Employed (ROCE) ROCE ratio specifies the efficiency and profitability of the company’s capital investment. This ratio is important as it is the indicator of the company’s ability to utilization of capital in order to generate revenue (Value Based Management, 2010). Sainsbury had 5.35% of ROCE in 2009 and 5.21% in 2008. There has been an increase in the percentage. 0.14% of ROCE has been increased. M&S had 14.26% & 21.83 % of ROCE in 2009 & 2008 year respectively. There has been a decrease in the ROCE. 7.57% of ROCE has been decreased. This shows that Marks & Spencer’s utilization of capital employed has not been fully operated as compared to Sainsbury. This shows the positive aspect of Sainsbury through increasing of the revenue and the borrowings in Sainsbury is less. Net Profit Margin N/P Margin conveys the amount of profit per £1 of turnover that a business has earned (Bized, 2010). In the case of Sainsbury, the N/P margin has been 1.52% & 1.84% for 2009 & 2008 respectively. M&S N/P margin has been 5.59% & 9.09% for 2009 & 2008 respectively. There has been 0.32% decrease in N/P margin in Sainsbury while 3.5% of decrease in N/P margin has been recorded in M&S. This shows that both the companies are not being able to increase there net profit margin in 2009. The turnover of Sainsbury and M&S has not been able to achieve the level that will generate revenue and shareholders will be satisfied. Gross Profit Margin G/P margin conveys the information of the relationship that exists between cost and sales (Bized, 2010). For Sainsbury, during the year 2009 & 2008, there has been 5.47% & 5.61% of G/P margin respectively. For M&S, during the year 2009 & 2008 there has been 7.79% & 12.51% of G/P margin respectively. This shows an increase in the cost of the companies. The costs rose in the year 2009 but the sales did not increase as compared to cost. 0.14% decrease in G/P margin of Sainsbury has been recorded whereas there was 4.72% decrease in G/P margin of M&S. If the overall industry trend is considered, there has been decrease in the sales in the retail sector that might be due to the financial recession in 2009. Efficiency Ratio Inventory Period Inventory Period ratio indicates the average time that the inventory is held. This shows the blockage of the capital (Bizwiz, n.d.). Sainsbury held the inventories for 14.06 days & 14.76 days in 2009 & 2008 years respectively. M&S held the inventories for 23.88 & 22.84 days in 2009 & 2008 years respectively. Sainsbury has been able to liquidate the inventories quickly in 2009 as compared to 2008. M&S inventory liquidity for inventories has decreased. This shows that Sainsbury is efficient enough to turn over the inventory rapidly than that of M&S. Trade Receivable Period The receivables turnover ratio is the ratio that helps in measuring the efficiency of a firm’s utilisation of its assets (Investopedia, 2010). Sainsbury’s trade receivable period for 2009 & 2008 were 94.31 & 88.52 (days). M&S trade receivable period for 2009 & 2008 were 30.57 & 35.78 (days). Sainsbury’s increase in the days shows the period of extension that leads to collection of cash for longer period. This is not good for a company. M&S’s trade receivable period has decreased by 5.21 days that show the receivable tenure to be received earlier and there will be cash flow earlier that is better for M&S. Trade Payables Period The ratio is important as it indicates the short term liquidity that is used to quantify the rate of the company’s paying ability to its suppliers (Investopedia, 2010). Sainsbury trade payable has not shown much change. 7.49 & 7.40 (days) were recorded in 2009 & 2008 year. M&S did not show much change as well. 7.99 & 7.73 (days) were recorded in 2009 & 2008 year. This shows the credit policy did not have much effect or changes for both the companies. But there were slight changes in the tenure and increase in the period might affect the procurement policy. Liquidity Ratio Current Ratio Current Ratio is the ratio that indicates the ability to pay short term obligations (Investopedia, 2010). Sainsbury’s current ratio has show a decrease from 0.60 in 2008 to 0.53 in 2009. M&S show an increase from 0.59 in 2008 to 0.60 in 2009 in current ratio. The increase of M&S represents the ability to pay off short term obligations. But in comparison, Sainsbury shows decrease of 0.07 in current ratio and M&S shows increase of 0.01 in current ratio. The obligation playability rate of M&S is higher than Sainsbury. Acid Test Ratio Acid Test Ratio represents the firms’ ability to cover its instant liabilities through short term assets. M&S ratio has shown positive sign by increasing from 0.34 in 2008 to 0.37 in 2009. Sainsbury has shown a decrease from 0.35 in 2008 to 0.30 in 2009. M&S increase in 0.03 ratio represents the ability of the firm to pay off its instant liability quickly than that of Sainsbury. Financial Gearing Ratio Gearing Ratio Gearing Ratio is used to evaluate financial leverage that represents the quantity of a firm’s actions that are financed by the proprietor’s funds versus the creditor's funds. Through EBIT and total interest the gearing ratio has been derived. Sainsbury has shown a decrease from 3.89 in 2008 to 3.64 in 2009. The decrease is 0.25 that shows the level of risk of the company has decreased. M&S has shown a decrease from 12.70 in 2008 to 3.58 in 2009. The decrease is 9.12, that is maximum in nature and there is a decrease in level of risk. The risk level of M&S has shown greater decrease than Sainsbury. Investment Ratio Earning Per Share (EPS) EPS is the indicator of the company’s profitability. It shows the company’s profitability portion to be distributed to each outstanding share that is held by common shareholders. EPS Basic In Sainsbury, there has been a decrease of 2.5p from 19.1p in 2008 & 16.6p in 2009. In M&S, there has been a decrease of 16.4p from 48.7p in 2008 & 32.3p in 2009. Both the companies have shown a decrease in basic EPS. This indicates that the company’s profitability has decreased. From the industry trend of both the companies, a decrease in profitability is observed. But the decrease in M&S is more when compared to Sainsbury. If an average trend of the industry is considered consisting of these two companies, then it is 18.9. The deviation from the trend of Sainsbury is 16.4 and that of M&S is 9.61. The deviation of M&S is greater than Sainsbury. EPS Diluted Sainsbury has shown a decrease of 2.2p from 18.6 in 2008 & 16.4p in 2009. M&S has shown a decrease of 16.4p from 48.7 in 2008 & 32.3 in 2009. The results are same as EPS Basic. Price Earning Ratio (P/E Ratio) The valuation of the company’s existing share price is evaluated by comparing to its per-share earnings. The ratio is important as it indicates the earning growths in future. The average 52 weeks market share price of M&S was 431.10 GBX. The P/E ratio of M&S is 11.58 (ADVFN, 2010). The average 52 weeks market share price of Sainsbury was 397.00 GBX. The P/E ratio of Sainsbury is 11.61 (ADVFN, 2010). Higher P/E ratio indicates that the investors are expecting increased growth in earning in the future compared to companies that provide lower P/E ratio. Sainsbury has been providing higher P/E ratio than M&S and are able to attract investors towards them. The expectations of the investors are more in Sainsbury than M&S. Limitation The industry average and other indices are generally applied in financial ratios. To some extent, it is complicated to judge whether a certain ratio is good or bad. A high current ratio may signify either a strong liquidity position or higher amount of inventories. Similarly, a high turnover of fixed assets might signify effective use of plant and machinery or ineffective plant and machinery due to worn-out problems. The problem in interpretation occurs when the firm has certain favourable ratios and certain unfavourable ratios and this situation is found out in the financial analysis of Sainsbury and Mark & Spencer. This problem is huge and has created difficulty in overall judgement about the financial strengths and weaknesses. There are also other tools that applies statistical tools but those guide towards varied directions. Conclusion From the overall financial analysis, it has been found out that both Sainsbury and Mark & Spencer are in favourable as well as unfavourable situations according to the various financial ratios. But looking at the industry of retail sector in the UK it has been found that there has been a decrease in the sales volume and the revenue has been decreased in the year 2009. There may be many reasons for the decline in industrial growth rate of the sector. The major reasons might be the financial problems like credit crises that existed till the year 2009 since early 2008. Also, the analysis that has been included in the study is related to the year 2008 and 2009. Recommendations The financial ratio analysis of both the companies shows the strengths and weaknesses in terns of various ratios. The focus needs to be on both strengths and weaknesses. With the strength the company can develop marketing strategies that will help the company to generate revenue and increase the sales volume. With the weakness the company should focus upon these areas in taking measures to improve the performance of the company. The unfavourable situations can be turned into favourable situation by effective management decisions analysing the ratios. This will help in decision making that will be guided towards the performance of the company. With limitations in financial ratio analysis, it is recommended to apply the statistical tools with the financial ratios that will help in generating an in-depth understanding. This knowledge will help the companies to develop strategic decisions regarding the financial decisions and other areas like marketing that will lead the companies to be the market leader. Appendix References ADVFN, 2010. Marks & SP Company Financial Information. PE Ratio. [Online] Available at: http://in.advfn.com/p.php?pid=financials&btn=s_ok&symbol=LSE%3AMKS&s_ok=OK [Accessed December 08, 2010]. ADVFN, 2010. Sainsburys Company Financial Information. PE Ratio. [Online] Available at: http://in.advfn.com/p.php?pid=financials&btn=s_ok&symbol=LSE%3ASBRY&s_ok=OK [Accessed December 08, 2010]. Bized, 2010. Net Profit Margin. Company Info. [Online] Available at: http://www.bized.co.uk/compfact/ratios/profit4.htm [Accessed December 08, 2010]. Bized, 2010. Gross Margin. Company Info. [Online] Available at: http://www.bized.co.uk/compfact/ratios/profit3.htm [Accessed December 08, 2010]. Bizwiz, No Date. Average Inventory Period Ratio. Inventory Holding Period. [Online] Available at: http://www.bizwiz.ca/efficiency_ratio_calculation_formulas/average_inventory_period.html [Accessed December 08, 2010]. Investopedia, 2010. Receivable Turn over Ratio. Dictionary. [Online] Available at: http://www.investopedia.com/terms/r/receivableturnoverratio.asp [Accessed December 08, 2010]. Investopedia, 2010. Accounts Payable Turnover Ratio. Dictionary. [Online] Available at: http://www.investopedia.com/terms/a/accountspayableturnoverratio.asp [Accessed December 08, 2010]. Investopedia, 2010. Current Ratio. Dictionary. [Online] Available at: http://www.investopedia.com/terms/c/currentratio.asp [Accessed December 08, 2010]. Marks & Spencer, 2010. The 1880’s. Company Profile. [Online] Available at: http://corporate.marksandspencer.com/HTML/index.html#/1910s [Accessed December 08, 2010]. Marks & Spencer, 2010. About Marks & Spencer. Where We Are. [Online] Available at: http://corporate.marksandspencer.com/aboutus/where/uk_stores [Accessed December 08, 2010]. Marks & Spencer, 2010. An Introduction to M&S. Company Overview. [Online] Available at: http://corporate.marksandspencer.com/aboutus [Accessed December 08, 2010]. Shooter, A., 2010. M&S vs. Sainsbury: Which is best? Time is Money. [Online] Available at: http://www.thisismoney.co.uk/bargains-and-rip-offs/article.html?in_article_id=487342&in_page_id=5 [Accessed December 08, 2010]. Sainsbury, 2010. About Sainsbury. Home. [Online] Available at: http://www2.sainsburys.co.uk/aboutus/about_us_default.htm [Accessed December 08, 2010]. Sainsbury, 2010. Sainsbury plc. Company Overview. [Online] Available at: http://www.j-sainsbury.co.uk/index.asp?pageid=12 [Accessed December 08, 2010]. Value Based Management, 2010. ROCE. Measuring the Efficiency. [Online] Available at: http://www.valuebasedmanagement.net/methods_roce.html [Accessed December 08, 2010]. Bibliography Abraham, A., 2006. Financial Management in the Non profit Sector: A Mission-Based Approach to Ratio Analysis in Membership Organizations. The Journal of American Academy of Business Cambridge, pp. 212-217. [Online] Available at: http://web.ebscohost.com/bsi/pdf?vid=9&hid=5&sid=6d283c3b-8f61-4049-bd7c-87847ee196fe%40sessionmgr8 [Accessed December 08, 2010]. Atrill, P. & McLaney, E., 2008. Accounting and Finance for Non-Specialists. Prentice Hall Financial Times. Black, G., 2005. Introduction to Accounting and Finance. Prentice Hall Financial Times. Castro, N. R. & Chousa, J. P., 2006. An Integrated Framework for the Financial Analysis of Sustainability. Business Source Complete. [Online] Available at: http://web.ebscohost.com/bsi/pdf?vid=11&hid=5&sid=6d283c3b-8f61-4049-bd7c-87847ee196fe%40sessionmgr8 [Accessed December 08, 2010]. Chadwick, L., 1996. The Essence of Financial Accounting. Prentice Hall. Cocheo, S. 2005. The Efficiency Ratio: How good a tool. ABA Banking Journal. [Online] Available at: http://web.ebscohost.com/bsi/pdf?vid=16&hid=5&sid=6d283c3b-8f61-4049-bd7c-87847ee196fe%40sessionmgr8 Dyson, J.R. 2001. Accounting for Non-Accounting Students. Prentice Hall Financial Times. Emerald 1984. Comparing Financial Performance: Ratio Analysis and Retail Management. Journal: International Journal of Retail and Distribution Management. pp. 0307-2363. Elliott, B. & Elliott, J., 2007. Financial Accounting and Reporting. Dawsonera. [Online] Available at: http://www.dawsonera.com/depp/reader/protected/external/AbstractView/S9781408212288 [Accessed December 08, 2010]. Gowthorpe, C., 2005. Business Accounting and Finance for Non-Specialists. Thomson Learning. Griffiths, I., 1995. New Creative Accounting: How to Make Profits What You Want Them to Be. Routledge. Garner, D., 1993. Analyzing Your Business: Ratios/Trends Analysis and Credit Management. Business Source Complete. [Online] Available at: https://uhvpn.herts.ac.uk/ehost/,DanaInfo=web.ebscohost.com+detail?vid=4&hid=13&sid=dade10d0-a840-4e6f-9507-da56f154d307%40sessionmgr11&bdata=JnNpdGU9ZWhvc3QtbGl2ZQ%3d%3d#db=bth&AN=9309300574#db=bth&AN=9309300574 [Accessed December 08, 2010]. Horrigan, J. 1965. Some Empirical Bases of Financial Ratio Analysis. JSTOR [Online] Available at: http://www.jstor.org/pss/243060 [Accessed December 08, 2010]. Johnson, C., 1970. Ratio Analysis and the Prediction of Firm Failure. JSTOR. [Online] Available at: http://www.jstor.org/pss/2325590 [Accessed December 08, 2010]. Kind, J. 2003. Accounting and Finance for Managers. Reader. [Online] Available at: http://reader.eblib.com/Reader.aspx?p=148703&o=79&u=her.614871006b78135a&t=1260808638&h=7fd0f3bcfa8b4e3ac611364c63831251ab637097&s=8008934&ut=174&pg=1&r=img# [Accessed December 08, 2010]. Proctor, R. 2006. Managerial Accounting for Business Decisions. Prentice Hall. Richard, B. 2007. Financial Ratios: How to Use Financial Ratios to Maximise Value and Success for Your Business. EBL. [Online] Available at: http://www.herts.eblib.com/EBLWeb/patron/ Read More
Cite this document
  • APA
  • MLA
  • CHICAGO
(Understanding and Interpreting Financial Statements Case Study, n.d.)
Understanding and Interpreting Financial Statements Case Study. Retrieved from https://studentshare.org/finance-accounting/1746491-understanding-and-interpreting-financial-statements
(Understanding and Interpreting Financial Statements Case Study)
Understanding and Interpreting Financial Statements Case Study. https://studentshare.org/finance-accounting/1746491-understanding-and-interpreting-financial-statements.
“Understanding and Interpreting Financial Statements Case Study”. https://studentshare.org/finance-accounting/1746491-understanding-and-interpreting-financial-statements.
  • Cited: 0 times

CHECK THESE SAMPLES OF Understanding and Interpreting Financial Statements

Purposes and Components of the Balance Sheet

Challenges in interpreting financial statements Managers entitled to perform the financial recording of an organization are often examined to face daunting problems or challenges while interpreting the financial statements in order to make efficient financial decisions.... In this regard, one of the most apparent challenges which are frequently faced by the managers in interpreting financial statements is the obligation to follow specified auditor norms which if misrepresented can even necessitate financial restatements....
3 Pages (750 words) Essay

Understanding and interpreting financial data

… In this case, Bravo Ltd can obtain financial ratios using their latest financial statements and comparing the results with a competing business within the same industry.... In this case, Bravo Ltd can obtain financial ratios using their latest financial statements and comparing the results with a competing business within the same industry.... t is a tool for interpreting the financial statements to assess financial and management performance....
4 Pages (1000 words) Coursework

The Role of Financial and Accounting Management

The paper "The Role of Financial and Accounting Management" shows that financial accounting prepares and provides financial statements to analyze the past performance of the business and is used to make important decisions about the short and long term financial planning.... The income statements are prepared to measure the net income of the organization during a specific period.... It is the process of identifying, measuring, accumulating, analyzing, preparing, interpreting, and communicating information that helps managers fulfill organization objectives" " (Horngren, Sundem, & Stratton, 2005, p....
4 Pages (1000 words) Essay

Financial & managerial accounting

Management… g is never a subsidiary of financial accounting rather it is the process that includes tax accounting, financial accounting, information analysis and other accounting activities. ... tatements of cash flows are important for managerial and financial accounting.... This statement rizes the effects on cash of the operating, investing and financial activities of a company during a specified accounting period (Plewa and Friedlob 345)....
3 Pages (750 words) Assignment

Financial Analysis

One group that uses Financial Analysis affiliation Financial Analysis Ratio Analysis The ratio analysis has become the primary technique thatis used by companies to analyze financial statements.... The ratio analysis helps in analyzing and interpreting information from the financial statements in a simplified manner, and in a manner that can be understood by those who do not know the accounting language.... The next step is looking at the notes accompanying the financial statements for any information that can be useful in the analysis....
2 Pages (500 words) Assignment

Critical Review of Conceptual Framework

Additionally, it delivers ease of understanding and interpreting the financial statements to its users (AASB, 2010).... The conceptual framework was recently proposed by the IASB (International Accounting Standards Board) and prior its introduction, most accounting standard setters pursued financial accounting operations without any specific framework resulting to disorganized and substandard… This also increased the risk of development of mutually inconsistent standards that violated the main objective behind preparation of financial statements....
8 Pages (2000 words) Essay

Chosen career

axation can be a complicated career as it requires understanding and interpreting the complex taxation laws and legislations.... The most important need for a tax advisor is to be passionate and capable of reading and interpreting tax Taxation Introduction The career that I would like to pursue is taxation.... The most important need for a tax advisor is to be passionate and capable of reading and interpreting tax legislations.... This requires a good understanding and knowledge of the terms and techniques....
2 Pages (500 words) Personal Statement

Users of Accounting Information

Accounting is the art of collecting, recording, summarizing and reporting accounting information in form of financial statements to various stakeholders both internal and external (Schneier, 2013).... These financial statements include the statement of financial position which… ms the user of specific accounts the company contains and what the balance is in each account, income statement which tells the user the quantity of money the company has made or lost and statement of cash flow which shows what contributed to revenue and expenses (Schneier, There are also retained earnings, which tell the user the portion of the net income reinvested in the company....
4 Pages (1000 words) Essay
sponsored ads
We use cookies to create the best experience for you. Keep on browsing if you are OK with that, or find out how to manage cookies.
Contact Us