StudentShare
Contact Us
Sign In / Sign Up for FREE
Search
Go to advanced search...
Free

Financial Statement Analysis of Vmoto - Case Study Example

Cite this document
Summary
The profitability ratios have been calculated in the paper to analyze the profits generated by Vmoto per dollar of its assets and invested equity. While calculating return on assets and return on equity, it has been assumed that beginning assets are equal to the last year ending assets of Vmoto. …
Download full paper File format: .doc, available for editing
GRAB THE BEST PAPER96.4% of users find it useful
Financial Statement Analysis of Vmoto
Read Text Preview

Extract of sample "Financial Statement Analysis of Vmoto"

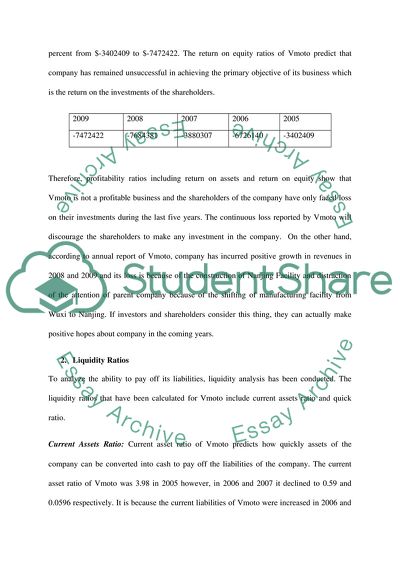
Financial ment Analysis Ratios Analysis Profitability Ratio The profitability ratios have been calculated to analyze the profits generated by Vmoto per dollar of its assets and invested equity. While calculating return on assets and return on equity, it has been assumed that beginning assets are equal to the last year ending assets of Vmoto and beginning equity is equal to the last year ending equity of Vmoto, therefore, average assets are equal to average of two years and average equity is equal to average of two years’ equity (Table I). Return on Assets: The return on assets ratio show how successful the company remained in achieving profits on its invested capital. Vmoto ratios show that Vmoto has generated negative profit or loss on its invested assets. The company has not earned any profit on assets of the company. The ratios are showing the loss per dollar of assets of Vmoto and negative sign is showing the loss. It has been noticed that over the five years the loss on assets of Vmoto has increased significant for example, in 2005 Vmoto incurred a loss of $1.28 on each $1 asset whereas, in 2009 company has reported a loss of $5.048 on each $1 asset. Return on Shareholders’ Equity: The ratio of the return on shareholders’ equity is predicting the extent to which Vmoto has achieved its business objective. From return on equity ratios, it seems that company is not making any profit for its shareholders. The minus sign in the ratios reflect the negative income generated by Vmoto over the five years. It is also evident that ratio is increasing, thereby showing an increase in the loss incurred by the company. The following table shows that from 2005 to 2009, the loss of Vmoto has increased by 120 percent from $-3402409 to $-7472422. The return on equity ratios of Vmoto predict that company has remained unsuccessful in achieving the primary objective of its business which is the return on the investments of the shareholders. 2009 2008 2007 2006 2005 -7472422 -7684381 -3880307 -6726140 -3402409 Therefore, profitability ratios including return on assets and return on equity show that Vmoto is not a profitable business and the shareholders of the company have only faced loss on their investments during the last five years. The continuous loss reported by Vmoto will discourage the shareholders to make any investment in the company. On the other hand, according to annual report of Vmoto, company has incurred positive growth in revenues in 2008 and 2009 and its loss is because of the construction of Nanjing Facility and distraction of the attention of parent company because of the shifting of manufacturing facility from Wuxi to Nanjing. If investors and shareholders consider this thing, they can actually make positive hopes about company in the coming years. 2. Liquidity Ratios To analyze the ability to pay off its liabilities, liquidity analysis has been conducted. The liquidity ratios that have been calculated for Vmoto include current assets ratio and quick ratio. Current Assets Ratio: Current asset ratio of Vmoto predicts how quickly assets of the company can be converted into cash to pay off the liabilities of the company. The current asset ratio of Vmoto was 3.98 in 2005 however, in 2006 and 2007 it declined to 0.59 and 0.0596 respectively. It is because the current liabilities of Vmoto were increased in 2006 and 2007 and the current assets of the company declined during this period. The ratio has again improved in 2008 and 2009 because of increasing current assets of Vmoto relative to its liabilities. The improvement in current asset ratio in 2009 predict that liquidity of Vmoto is showing improvement however, it is important to note that current assets including trade receivables have significantly increased. The company has made sales however; most of them appear to be credit sales. It is possible that Vmoto attracted customers by offering good sales credit offers. Quick Ratio: To analyze the short term liquidity of Vmoto, quick ratios have been calculated however, the quick ratios are equal to current asset ratios for the years 2009, 2007 and 2006. It is because company is not carrying any inventory and the prepayments have been only made in 2005 and 2008. Quick ratios also support the findings of current assets ratio. Vmoto’s liquidity has declined from 2005 to 2007 however; in 2008 and 2009 quick ratios have improved thereby, showing an increase in quick assets of the company against its liabilities. Therefore, liquidity ratios of Vmoto shows that from 2005 to 2007 company faced problems in liquidity management however, situation of the company has improved in 2008 and 2009. One major reason of this improvement is the positive revenue of the company. From 2005 to 2007 company has not generated any income however, in 2008 and 2009; Vmoto generated significant revenues thereby, improving cash and trade receivables. Cash Flow Adequacy Ratios: To measure the cash sufficiency of Vmoto, cash flow adequacy ratios were calculated. It is important to note that company has generated only negative cash flow from its operations during the last five years. During the last five years, company has not paid any dividend to its shareholders. Moreover, long terms debt repayments have been only made in 2007 and 2009. In 2006, company only generated negative cash from operations and did not pay its long term debt and dividends and did not purchase fixed assets. The ratios show that Vmoto has been facing severe liquidity problems. 3. Capital Structure Ratios To determine how Vmoto has established its capital structure, these ratios were calculated. Debt to Equity Ratio: Debt to equity ratio for 2005 is 0.08 which shows that in 2008 company had an equity capital structure with very less borrowing however, in 2006 capital structure of company changed when dependence of Vmoto enhanced on borrowings of creditors. In 2006, the relative decline in shareholders’ equity was higher than increase in liabilities. In 2009 borrowing is around 179 percent of equity. Interest Coverage Ratio: To determine how easily Vmoto can pay off its interest on its debt, interest coverage ratio was calculated. The company did not have interest bearing liability in 2005 however; in 2006 Vmoto incurred huge interest expense. In 2006, company did not have any revenue to pay off its debt and most of the expenses were made through equity. However, in 2008 and 2009, the interest coverage ratio of Vmoto has improved relative to previous years because of the positive revenues of the company. Book Value per Share versus Market Value per Share The following table shows the book value and market value per share of Vmoto. The comparison of the values shows that book value per share of is significantly lower than market value of shares; therefore, shares of the company have been overvalued. Since Vmoto is not offering preferred shares, therefore, book value has been calculated by dividing shareholders’ equity with average outstanding shares. Moreover, table also shows that market value of shares have declined from 2006 to 2008 however, in 2009 company has been able to improve the confidence of its shareholders and market value of shares increased. 2009 2008 2007 2006 2005 Book value of Shares $0.0064284903 $0.0110606 $0.010852078 $0.007984288 $0.023907208 Average outstanding shares 323,203,255 224,034,254 185,500,779 89,332,195 73,037,722 Market value per share $0.10 $0.08 $0.073 $0.0775 $0.11 Common Size Financial Statements The common size income statement has been only prepared for year 2008 and 2009 because company started generating revenues from 2008. The statements shows that the major chunk of the revenues of Vmoto is going to costs of goods sold and company has only earned 3.83 percent and 4.33 percent gross margin in 2008 and 2009. Therefore, company could not make expenses out of its revenues (Table II). The common size balance sheet shows non-current assets of the company are very higher as compared to the its current assets, however, in 2009 total current assets of company has increased significantly (Table III). Moreover, equity of company has significantly declined over the years as compared to the liabilities, which are increasing. As stated by the company, the increase in liabilities is because of the current development of manufacturing plant in Nanjing. CEO And Auditors of Vmoto For the past three years, Lee Verios was the president and CEO of the company however; he has resigned on 29 September 2009. The Auditors of the company during the last three years are PKF Chartered Accountants. As claimed by the company, the auditors have not provided any non-audit service to the company in addition to their statutory duties in 2007 and 2009. However, in 2008 auditors provided corporate advisory services however, as claimed by the company provision of these services did not result in any compromise on the independence of the auditors. As a result of non-audit services by auditors in 2008, it was ensured that corporate governance procedures of the company might not impact the independence and integrity of auditors. Moreover, auditors have presented their opinion in the Auditors’ Independence Declaration Report that company is following all Australian Accounting Standards and there are no controversies in Financial Reporting. Appendix Table I: Ratios Analysis Table II: Common Size Income Statement   2009 2008 2007 2006 2005 Revenue 100.00% 100.00% - - - Cost of goods sold -95.67% -96.17% - - - Gross profit 4.33% 3.83% - - - Other income 0.62% 0.77% 31483 11752 46092 Operational expenses -3.50% -3.93% - - - Marketing and distribution expenses -1.53% -3.53% -171963 -23462 -31191 Corporate and administrative expenses -5.04% -14.72% -626276 -215650 -300030 Occupancy expenses -1.61% -2.12% -46148 -48369 -36460 Other expenses   -0.85% -38612 -11552 -42017 Finance costs -0.35% -1.01% -108839 -22636   Impairment of Goodwill   - - -   Provision of impairment loss in the value of investments on controlled entitles -39.63% - -   Intangible assets written off -   - - -100000 Provision against value of investments in controlled entities -   - -4500000 -363974 Provision for doubtful amount against unsecured loans to controlled entities -11.71% 0.26% -2919952 -1916223 -2574829             Loss from continuing operations before income tax -18.80% -60.94% -3880307 -6726140 -3402409 Income tax - - - - - Loss after tax from continuing operations -18.80% -60.94% -3880307 -6726140 -3402409 Loss attributable to minority interests - - - - - Loss attributable to equity holders -18.80% -60.94% -3880307 -6726140 -3402409 Table III: Common Size Balance Sheet   2009 2008 2007 2006 2005 CURRENT ASSETS           Cash and cash equivalents 42.10% 7.67% 1.52% 27.72% 30.06% Trade and other receivables 1.49% 0.41% 0.36% 0.11% 0.25% Inventories - - - - - Other assets 4.12% 11.19% 1.10% - - Total Current Assets 47.71% 19.27% 2.98% 27.83% 30.30% NON CURRENT ASSETS           Receivables - - 0.02% 72.17% 69.69% Property, plant and equipment 40.93% 65.43% 0.36% - - Intangible assets 11.35% 15.30% - - - Other financial assets - - 96.64% - - Total Non Current Assets 52.29% 80.73% 97.02% 72.17% 69.69% TOTAL ASSETS 100.00% 100.00% 100.00% 100.00% 100.00%             CURRENT LIABILITIES           Trade and other payables 56.80% 60.95% 49.63% 8.78% 7.05% Employee benefits 0.78% 2975100.00% 0.42% 0.95% 0.56% Loans and borrowings 168.28% 154.98% - 37.20% - Other liabilities - - - - - Total Current Liabilities 225.86% 218.20% 50.05% 46.93% 7.61% NON CURRENT LIABILITIES           Trade and other payables - - - - - Loans and borrowings - 71.02% 18.10% - - Total Non Current Liabilities - 71.02% 18.10% - - TOTAL LIABILITIES 225.86% 289.22% 68.16% 46.93% 7.61% NET ASSETS -125.86% -189.22% 31.84% 53.07% 92.39% EQUITY           Issued capital 1744.86% 1620.26% 295.26% 1006.37% 414.50% Reserves 58.87% 52.33% 0.70% 0.26% 0.19% Accumulated losses -1929.59% -1861.82% -264.11% 953.57% 92.39% Minority interest - - - -   TOTAL EQUITY -125.86% -189.22% 31.84% 53.07% 92.39% TOTAL EQUITY AND LIABILITIES 100.00% 100.00% 100.00% 100.00% 100.00% Read More
Tags
Cite this document
  • APA
  • MLA
  • CHICAGO
(Financial Statement Analysis of Vmoto Case Study, n.d.)
Financial Statement Analysis of Vmoto Case Study. Retrieved from https://studentshare.org/finance-accounting/1742512-accounting-anual-report-analysis
(Financial Statement Analysis of Vmoto Case Study)
Financial Statement Analysis of Vmoto Case Study. https://studentshare.org/finance-accounting/1742512-accounting-anual-report-analysis.
“Financial Statement Analysis of Vmoto Case Study”, n.d. https://studentshare.org/finance-accounting/1742512-accounting-anual-report-analysis.
  • Cited: 0 times

CHECK THESE SAMPLES OF Financial Statement Analysis of Vmoto

Fnancial Accounting

The company has two segments, namely automotive and financial services.... hellip; The financial services segment consists of vehicle-related financing, leasing and insurance, renting and leasing of cars and trucks and renting industrial and construction equipment and other activities. ... e have completed integrated audits of Ford Motor Company's consolidated financial statements and of its internal control over financial reporting as of December 31, 2006 in accordance with the standards of the Public Company Accounting Oversight Board (United States)....
19 Pages (4750 words) Case Study

Financial Statement Presentation

This paper discusses and critically evaluates the changes that have been made to the content and financial statement Presentation over the last 15 years.... hellip; This particular standard has been periodically amended from time to time either to bring in more transparency in the way the financial reports are presented or to bring it in line with other IASs as a result of amendment in other IAS.... In common parlance as understood in day to day communication financial statements are records of accounts (financial transactions)....
21 Pages (5250 words) Essay

Evaluation of the Financial Statements of Ford and General Motors

The impact of the global financial crisis was more on the automobile sector than on the housing and financing… This study would include an analysis of two most famous American automakers General Motors and Ford.... We would be presenting a comparative analysis of the financial statements of both the companies to evaluate the financial status of both General Motors and Ford.... he financial analysis would include evaluation of the financial statements of Ford and General Motors, which would assist in understanding the revenue and profitability of the two companies and the operating expenses that the company has to bear....
4 Pages (1000 words) Research Paper

Financial Statement/Audit Report Review

In light of GAAP, management team should a narrative introduction overview and analysis to entity's basic financial statements, a schedule of Management's Discussion and analysis (MD&A) (Bragg & Bragg, (2007).... In this regard the analysis will cover all governmental funds with the inclusion of general fund under one umbrella.... Again the use of statement of activities avails net position change for a given period.... Other items which are reported in this statement are expenses as well as revenues that have resulted from outlay and inflow respectively....
4 Pages (1000 words) Case Study

Financial Statement Analysis for HCA, Inc and Community Health Systems

Many firms hide debt in the financial statement notes.... The final analysis for HCA & CHS will be presented from the prospective of the investor.... In the next few pages, you will find a vertical ratio and horizontal analysis for subject firms.... The computations were performed using Gibson (2013), supplemental Excel worksheet provided with There are many reasons for someone to explore a firm's financial statements.... Consequently, investors willing to invest in a given organization should not evaluate the viability of the investment from the face value of the financial statements....
15 Pages (3750 words) Assignment

Financial Analysis BMW

The company takes a propotionate amount of financial instruments and factors in account to For example the 2011 and 2012 financial reports shows that the company had a toatl of €27,038 million and €30,295 million respectively for the equity attributed to shareholders of BMW.... MW company uses both operating and financial lease....
5 Pages (1250 words) Essay

Analysis Of Ford Motor Companys Balance Sheet

?financial statement analysis: A practitioners guide, fourth edition.... The paper "analysis of Ford Motor Company's Balance Sheet" assesses the condition of the Ford Motor Company using the analysis of balance sheet from its 2012 Annual Report.... ?analysis of financial statements.... hellip; The balance sheet, currently known as a statement of financial position, refers to a financial statement that indicates the worth of business at one point in time....
2 Pages (500 words) Assignment

Income Statement - Ford Motor Company

ord Motor's income statement analysisAn analysis of Ford Motors Company's income statement from year 2012 shows the following facts.... That is why it is Income ment - Ford Motor Company Income ment - Ford Motor Company In order to measure a company's performance financially, analysts use the income statement.... That is why it is also known as profit or loss statement or revenue statement.... Income statement is different from the balance sheet because the latter represents a single instance of time (for example, a week)....
2 Pages (500 words) Assignment
sponsored ads
We use cookies to create the best experience for you. Keep on browsing if you are OK with that, or find out how to manage cookies.
Contact Us