StudentShare
Contact Us
Sign In / Sign Up for FREE
Search
Go to advanced search...
Free

Analysis of Financial Performance and Dividend Policy of Vodafone Company - Assignment Example

Cite this document
Summary
The author provides a critical review of the aspects of the Vodafone business in the past three years such as overall financial performance and dividend policy and evaluates the impact and relevance of Corporate Governance policy disclosures in Vodafone’s Financial Statements in the past 3 years.  …
Download full paper File format: .doc, available for editing
GRAB THE BEST PAPER91.9% of users find it useful
Analysis of Financial Performance and Dividend Policy of Vodafone Company
Read Text Preview

Extract of sample "Analysis of Financial Performance and Dividend Policy of Vodafone Company"

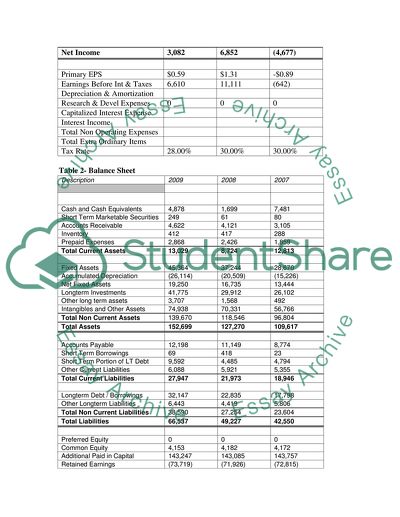
Question Research Vodafone firm to provide a critical review of the following aspects of the business in the past three years: Overall financial performance and dividend policy. Vodafone Group Plc is one of the worlds leading mobile telecommunications company, offering an extensive range of services, including voice and data communications. Over years Vodafone has created a strong foothold for it self in the global market. The group has presence in almost all continents such as Europe, Central Asia, Africa, Asia Pacific and the America. It provides its services through its subsidiaries and joint ventures. By the end of the year 2008, the company had stake in various undertakings in 27 countries across the world. The financial statement of the company is summarized in the tables below: Table 1- Income Statement Description 2009 2008 2007 Net Sales 41,017 35,478 31,104 Share of result in associated undertakings 4,091 2,876 2,728 Total Revenues 45,108 38,354 33,832 Cost of Goods Sold (25,842) (21,890) (18,725) Other Operating Expenses (5,900) (28) (11,098) Total Direct Expenses (31,742) (21,918) (29,823) Selling, General & Administrative (7,509) (6,389) (5,573) Operating Income 5,857 10,047 (1,564) Interest Expenses (2,419) (2,014) (1,612) Foreign Exchange (Loss) Gain 0 0 0 Investment Income 795 714 789 Other NonOperating (Loss) Gain (44) 254 4 Income Tax Expense (1,109) (2,245) (2,423) Reserve Charges 0 0 0 Income Before Extra Ord Items 3,080 6,756 (4,806) Extra Ordinary Items (Loss) Gain 0 0 0 Tax Effects of Extraordinary Items 0 0 0 Minority Interests 2 96 129 Net Income 3,082 6,852 (4,677) Primary EPS $0.59 $1.31 -$0.89 Earnings Before Int & Taxes 6,610 11,111 (642) Depreciation & Amortization Research & Devel Expenses 0 0 0 Capitalized Interest Expense Interest Income Total Non Operating Expenses Total Extra Ordinary Items Tax Rate 28.00% 30.00% 30.00% Table 2- Balance Sheet Description 2009 2008 2007 Cash and Cash Equivalents 4,878 1,699 7,481 Short Term Marketable Securities 249 61 80 Accounts Receivable 4,622 4,121 3,105 Inventory 412 417 288 Prepaid Expenses 2,868 2,426 1,859 Total Current Assets 13,029 8,724 12,813 Fixed Assets 45,364 37,244 28,670 Accumulated Depreciation (26,114) (20,509) (15,226) Net Fixed Assets 19,250 16,735 13,444 Longterm Investments 41,775 29,912 26,102 Other long term assets 3,707 1,568 492 Intangibles and Other Assets 74,938 70,331 56,766 Total Non Current Assets 139,670 118,546 96,804 Total Assets 152,699 127,270 109,617 Accounts Payable 12,198 11,149 8,774 Short Term Borrowings 69 418 23 Short Term Portion of LT Debt 9,592 4,485 4,794 Other Current Liabilities 6,088 5,921 5,355 Total Current Liabilities 27,947 21,973 18,946 Longterm Debt / Borrowings 32,147 22,835 17,798 Other Longterm Liabilities 6,443 4,419 5,806 Total Non Current Liabilities 38,590 27,254 23,604 Total Liabilities 66,537 49,227 42,550 Preferred Equity 0 0 0 Common Equity 4,153 4,182 4,172 Additional Paid in Capital 143,247 143,085 143,757 Retained Earnings (73,719) (71,926) (72,815) Other Equity 20,517 10,558 - Treasury Stock (8,036) (7,856) (8,047) Total Shareholder Equity 86,162 78,043 67,067 Total Liabilities & Equity 152,699 127,270 109,617 Table 3- Cash Flow Statement Description 2009 2008 2007 Net Income 3,082 6,852 (4,677) Depreciation and Amortization 0 0 0 (Increase) Decrease Defer Taxes 0 0 0 (Gain) Loss on Sale of Assets 0 45 0 (Increase) Decrease Current Assets 4,305 (4,089) 5,281 Increase (Decrease) Current Liab (5,974) (3,027) (3,434) Cash Flow from Operations 1,413 (219) (2,830) Capital Expenditures (5,204) (3,852) (3,633) Acquisition in Other Cos (3,153) (6,803) (3,704) Disposal of property, plant and equipment 317 39 34 Purchases of Investments (133) (96) (172) Disposal of investments 282 785 (3,725) Other Investment Activities(dividends and interest received) 1,057 1,383 1,374 Cash Provided (Used) from Investmts (6,834) (8,544) (9,826) Proceeds from Borrowings 6,156 995 6,103 Payments on Borrowings (2,729) (3,847) (1,961) Dividends Paid to Shareholders (4,013) (3,658) (3,555) Proceeds from Minority Interest 456 (113) (34) Issue Stock / Exercise Options 22 310 193 Purchase / Retire Common Stock (978) (7) (5,756) Other Financing Activities like interet paid (1,470) (1,545) (1,051) Cash Provided (Used) from Financing (2,556) (7,865) (6,061) Increase (Decrease) to Cash (7,977) (16,628) (18,717) The year 2008-09 was one of the most challenging years for all the industry. It was on the whole a very average year for Vodafone. In the year 2006-07, the company had witnessed a loss of ₤ 4,077 Million. In the year 2007-08, the figures improved and the company witnessed a top-line growth of 13% and 17% in the year 2008-09. However, both in the year 2007 and 2009, a large chunk of revenue was eaten up by unusual operating expenses. In the year 2008, low operating expenses gave a huge thrust to net income, bringing it up to ₤ 6,756 from a net loss of ₤ 4,806. Organic revenue growth was driven by the higher customer base and successful usage stimulation initiatives, partially offset by ongoing price reductions and the impact of regulatory driven reductions. Growth in data revenue was particularly strong, up 39.0% on an organic basis to £2,119 million, reflecting increased penetration of mobile PC connectivity devices and improved service offerings. The operating profit witnessed a decline in the year 2009 due to impairment losses in Spain, Turkey and Ghana. In the year 2008, the operating profit increased to ₤ 10,047 million from a loss of ₤ 1,564 Million. The loss witnessed in 2007 was mainly due to ₤ 11,600 impairment charges. Adjusted operating profit increased by 16.7%, or 2.0% on an organic basis, with a 16.5 percentage point contribution from favourable exchange rates, whilst the impact of merger and acquisition activity reduced adjusted operating profit growth by 1.8 percentage points. The share of results in Verizon Wireless, the Group’s associated undertaking in the US, increased by 21.6% on an organic basis, primarily due to a focus on the high value contract segment and low customer churn. On 9 January 2009, Verizon Wireless completed its acquisition of Alltel Corp. (‘Alltel’), adding 13.2 million customers before required divestitures. The break-up of the operating cost is shown in the figure below: Figure 1 The summarized key financials of Vodafone is given in the table 1 below. Table 4- Key Financials of Vodafone Plc. Description 2009 2008 2007 EBITDA : Income before ExtraOrd Items 3,080 6,756 (4,806) Interest Expense 2,419 2,014 1,612 Capitalized Interest Expense 0 0 0 Income Tax Expense 1,109 2,245 2,423 Reserve Charges 0 0 0 Depreciation and Amortization 0 0 0 EBITDA 6,608 11,015 (771) EBITDA Margin 16% 31% -2% Free Cash Flow: Operating Cash Flow 1,413 (219) (2,830) Investment Cash Flows (6,834) (8,544) (9,826) Preferred Dividends Paid (fixed) 0 0 0 Redemption of Fixed Obligations (2,729) (3,847) (1,961) Free Cash Flow (8,150) (12,610) (14,617) Working Capital: Current Assets 13,029 8,724 12,813 Current Liabilities 27,947 21,973 18,946 Working Capital (14,918) (13,249) (6,133) Liquid Capital: Cash and Cash Equivalents 4,878 1,699 7,481 Marketable Securities 249 61 80 Accounts Receivable 4,622 4,121 3,105 Notes Receivable 0 0 0 Total Current Liabilities (27,947) (21,973) (18,946) Long Term Debt (32,147) (22,835) (17,798) Preferred Equity 0 0 0 Liquid Capital (50,345) (38,927) (26,078) Market Capitalization: Market Cap - Common Stk $115,465 $115,465 $115,465 Market Cap - Preferred Stk $0.00 $0.00 $0.00 Total Market Capitalization $115,465 $115,465 $115,465 NOPAT / Operating Indicators: Net Interest Expense After Tax (1,742) (1,410) (1,128) Interest Bearing Liabilities 41,808 27,738 22,615 NOPAT 4,824 8,262 (3,549) Net Longterm Assets 133,227 114,127 90,998 The break-up of the financial components are shown in the figures below: Figure 2 Figure 3 The figures given above shows that majority part of current asset is composed of cash and cash equivalents. This component dipped in the year 2008 and slightly recovered in the year 2009. The next biggest component is the accounts receivable and short term marketable securities. However, the gap between the current and non current asset still remains very wide. The liquidity status in the company has improved over time. In the year 2007-08, the current ratio of the company was about 0.40. In the year 2008-09, it rose up to 0.47. This increase was mainly due to raise in liquid cash components. Figure 4 Figure 5 Vodafone is considered to be one of the best telecom companies in the world. When compared to other telecom companies. Over the span of time it is seen that Vodafone has used its operating cash flows for new investments backed by several acquisitions and takeovers. However, there has been a significant increase in the liability of the company in the year 2008-09. The current liability figures have witnessed a slight growth in the span of three years. However, the total liability has increased by almost 35 % in the year 2008-09 over 15 % in the year 2007-08. The adjusted earning per share increased almost by 37.4% for the year 2007-08, owing to favourable exchange rate movement and tax benefits arising due to capital restructuring. Basic EPS declined to 5.8 pence in the year 2008-09. The dividend paid to the common shareholders increased by 9.7 % in the year 2008-09 over 2.8% in 2007-08. The company’s overall status has been indicated in the ratio analysis given in the Table 2 below. Table 5- Key Financial Ratio Title of Ratio 2009 2008 2007 Acid Test Ratio 0.35 0.27 0.56 Current Ratio 0.47 0.40 0.68 Operating Cash Flow to Net Income 0.46 (0.03) 0.61 Z Score: 1.2 x (working capital / total assets) (0.12) (0.12) (0.07) 1.4 x (retained earn / total assets) (0.68) (0.79) (0.93) 3.3 x (EBIT / total assets) 0.14 0.29 (0.02) .6 x (market value equity / b.v. debt) 2.16 3.03 3.89 .999 x (sales / total assets) 0.27 0.28 0.28 Z Score 1.77 2.68 3.16 Inventory Turnover: Average Inventory Balance 415 353 293 Inventory Turnover 52.8 53.1 58.4 Days in Inventory 7 7 6 Total Asset Turnover 0.3 0.3 0.3 Operating Assets Ratio 0.21 0.20 0.24 Gross Profit Margin 37% 38% 40% Operating Margin 14% 28% -5% Net Profit Margin 7% 18% -14% Direct Cost to Operating Revenues 70% 57% 88% Capitalization Rate / Asset Return: Net Operating Income 4,217 7,033 (1,095) Total Investments / Operating Assets 32,279 25,459 26,257 Capitalization Rate / Return 13.06% 27.62% -4.17% Return on Shareholder Equity 4% 9% -6% Debt to Total Assets 0.44 0.39 0.39 Debt to Common Equity 0.90 0.65 0.57 Times Interest Earned 3 6 (0) Price to Earnings (P/E) 37.5 16.9 (24.7) Price to Book Value 1.3 1.5 1.7 Stock Yield 3.48% 3.17% 3.08% On the whole it can be said that though the financial performance looks reasonably good, there are still few areas of concern. Firstly, Vodafone should ensure that the liquidity position is well maintained. Secondly, the company has to ensure that it should not go on an acquisition spree and block its operating cash flows in long term assets. It has to also ensure that the loss arising from the take overs or newly aquired company is properly depicted and is accounted for before hand. Question 2: Critically evaluate the impact and relevance of Corporate Governance policy disclosures in Vodafone’s Financial Statements in the past three years. The corporate governance procedures were introduced with a vision to bring in more clarity and portray a true picture of the entity in concern in front of the regulators and minority shareholders. However, in span of few years, failures in the domain of corporate governance have brought forward a series of concern. Those failures have starkly pointed out severe drawbacks in the corporate governance policies and procedures. In the current decade, the corporate governance failures have called for stricter norms in the domain of risk management and also corporate strategy. In last few years the majority of failures have mainly due to lack of clarity in the reporting system. The reporting system has failed to portray the risk appetite of the company in a perfect and timely manner. Often the corporate reports overlook the remuneration policy of the senior management team and the risk appetite unless it is too late. Regulators have now taken up the issue and have been laying emphasis on internal controls and ensuring external checks, which should ideally be in the line of Sarbanes Oxley regulations. With every passing day, Vodafone is growing in size. Along with this, the risk parameters are also increasing. Vodafone has several risk factors which impacts its business. The type of risk varies from macro economic conditions, the changes in the telecom regulatory norms, the exchange rate fluctuations, to the political risks blooming in the countries where Vodafone operates. The list of KPIs and its impact has been given in the table below. Table 6- List of KPIs.1 KPI Purpose of KPI 2009 2008 2007 Free cash flow before licence and spectrum payments(2) Provides an evaluation of the cash generated by the Group’s operations and available for reinvestment, shareholder returns or debt reduction. Also used in determining management’s remuneration. £5,722m £5,580m £6,343m Service revenue and related organic growth(2) Measure of the Group’s success in growing ongoing revenue streams. Also used in determining management’s remuneration. £38,294m (0.3)% £33,042m 4.3% £28,871m 4.7% Data revenue and related organic growth(2) Data revenue is expected to be a key driver of the future growth of the business. £3,046m 25.9% £2,119m 39.0% £1,405m 30.7% Capital expenditure Measure of the Group’s investment in capital expenditure to deliver services to customers. £5,909m £5,075m £4,208m EBITDA and related organic growth(2) Measure used by Group management to monitor performance at a segment level. £14,490m (3.5)% £13,178m 2.6% £11,960m 0.2% Customer delight index Measure of customer satisfaction across the Group’s controlled markets and its jointly controlled market in Italy. Also used in determining management’s remuneration. 72.9 73.1 70.6 Adjusted operating profit and related organic growth(2) Measure used for the assessment of operating performance, including the results of associated undertakings. Also used in determining management’s remuneration. £11,757m 2.0% £10,075m 5.7% £9,531m 4.2% Proportionate mobile customers(1) Customers are a key driver of revenue growth in all operating companies in which the Group has an equity interest. 302.6m 260.5m 206.4m Proportionate mobile customer net additions(1) Measure of the Group’s success at attracting new and retaining existing customers. 33.6m 39.5m 28.2m Voice usage (in minutes) Voice usage is an important driver of revenue growth, especially given continuing price reductions in the competitive markets in which the Group operates. 548.4bn 427.9bn 245.0bn Vodafone has also been impacted by the shortcomings of the corporate governance policies and procedures on certain aspects. In last three years, it has reportedly witnessed a rise in its other operating expense owing to losses in its operations in foreign countries like Turkey, Ghana, etc. This had dropped in the year 2007-08 to almost negligible amount. However, in the financial report, nowhere is it clearly mentioned as how the company is going to handle such unusual expenses. The company is also not very clear on discussing its ever increasing debt. In the year 2008-09, the total Long term borrowing has increased by almost 40 percent, in comparison to a rise of 28 percent in the year before that. Though the long term investments have also witnessed a significant growth, however a layman would fail to understand that out of those investments pointed out in the asset side of the balance sheet, what the actual proportion of liability is in them. It is also pertinent to note that though the investments increased, the income from investments have not increased in equal proportion. Another major failure in this domain is lack of clarity in the remuneration norms for the senior management personnel in the company. Compensation and incentive systems have is a significant component in the company’s expense schedule. However, this aspect is often overlooked by the company. In the past also, Vodafone has been pulled into controversies with regards to Mannesmann case. Hence, it becomes even more important for the company to be more open with its reporting standards in order to ensure that it abides by the trust and faith of its shareholders. It is extremely important to address these issues from the perspective of not only the shareholders and regulators but also from the perspective general public or rather a common man. Question 3: Comment on criticisms that Annual Report and Accounts have become increasingly complex and fail to communicate appropriately with stakeholders;- relevant, up to date, understandable data on the state of Vodafones affairs. Please support the answer by reference to research and commentary on developments in Financial Reporting. It has been rightly pointed out that as time has passed on; financial reports have become very complex. Ideally most of the reforms in the financial reporting system were introduced to bring in more clarity. However, time and again the purpose of bringing in these norms has failed. This issue becomes more pertinent as the company grows in size and dimension. For a company like Vodafone, which is so huge, it is very difficult for the investors and layman to understand the micro management issues like expenses and liabilities arising out of mergers and takeovers. It is also very difficult to predict the future performance of the company owing to the fact that there are several geographical factors which affects the performance of the company. Vodafone is said to have one of the most prudent disclosure norms. The senior management of the company has abided by strict code of ethics, ensuring full and fair disclosure of company’s results abiding the regulatory norms. The board of directors, however, has the authority to waive certain SOXA regulations. This has to be disclosed to SEC. Vodafone follows a much disciplined approach towards maintaining and recording financial information. The internal audit norms are highly detailed and are governed by the chairman of the Audit Committee. The CFO is no way involved in the audit procedures. They regularly conduct meetings with the senior management whenever a necessity arises. Their focus is completely zeroed on acceptability and quality of accounting practices, financial disclosures, issues which requires attention like provisions for losses, identifying the risk parameters, etc. The committee is also supposed to oversee the extent to which financial figures are impacted by peculiar transactions and off balance sheet items. However, on analysis of the financials of Vodafone, it is realized there are some drawbacks in the way the company has disclosed its financial situation through the statements as well as disclosures. Some of the key issues are pointed as follows: One of the key issues is that the income statement of the company is extremely precise and short for any analyst to derive a true picture of the company from it. In the year 2008-09 as well as the year 2006-07, the operating expenses have been very high. In the year 2007-08, this figure drops to almost negligible. A common investor might be left wondering as what can be the prime reason for such a huge expense. After reading the Annual report, it is found that these operational expenses have come out of issues pertaining to certain regions like Turkey, Ghana, etc. However, one might still wonder if the entire cost can be attributes to “unusual expense” or there should be a separate head to provide more clarity to the investors. Another major problem arising out of the statements is the lack of clarity in the actual value of the investments. It is quite surprising that when companies make huge investments in other companies and other geographies, it is often not understood by a common investor that if there are any potential risk of losses. Mostly all the investments are portrayed under the heading investments. However, all takeovers come with additional liabilities like the existing debt, aging machineries, loss making units, etc. In spite of this, the entire cost of acquisition is known as investment and asset of the company. The liability figures usually come up on the liability side after a year, when the investment is already made. Goodwill is yet another instance where there is a huge scope of ambiguity. All large companies usually account a huge amount on their goodwill. This keeps increasing as there are more mergers and takeovers. However, the goodwill remains intact till the time the company does not close its operation. This is ideally not the fact. Anytime there is a conflicting situation in the top management, common shareholders do not come to know about it. These situations in the long run do impact the goodwill and performance of the company. On the whole it can be said that financial statement and disclosures are meant to divulge information to the minority shareholders and investors. Though Vodafone has ensured to be transparent, there are certainly areas of improvement in the disclosures and financial statements. A company should aim at making the information crisp and clear and readily available to all the stakeholders of the company. Distorted results can be misguiding and can be extremely detrimental for the company’s future in the long run. This is even more when Vodafone has strategized its business by acquiring more companies across the world. References J. J. Du Plessis, Bernhard Großfeld, Claus Luttermann, Ingo Saenger, Otto Sandrock. German corporate governance in international and European context. Springer, 2007 Chee Keong Low. Corporate governance: an Asia-Pacific critique. Sweet & Maxwell Asia, 2002 Grant Kirkpatrick. The Corporate Governance Lessons from the Financial Crisis. OECD 2009 Annual Report of Vodafone Plc. For the Year 2008-09 & 2007-08. Nicholas Beale. Constructive engagement: directors and investors in action. Gower Publishing, Ltd., 2005. Andreas Cseh. The British Telecom Industry. GRIN Verlag, 2007 CFA level I candidate readings, 2008. CFA Institute, 2008 Read More
Cite this document
  • APA
  • MLA
  • CHICAGO
(Analysis of Financial Performance and Dividend Policy of Vodafone Assignment, n.d.)
Analysis of Financial Performance and Dividend Policy of Vodafone Assignment. Retrieved from https://studentshare.org/finance-accounting/1734782-vodafone
(Analysis of Financial Performance and Dividend Policy of Vodafone Assignment)
Analysis of Financial Performance and Dividend Policy of Vodafone Assignment. https://studentshare.org/finance-accounting/1734782-vodafone.
“Analysis of Financial Performance and Dividend Policy of Vodafone Assignment”, n.d. https://studentshare.org/finance-accounting/1734782-vodafone.
  • Cited: 0 times

CHECK THESE SAMPLES OF Analysis of Financial Performance and Dividend Policy of Vodafone Company

Growth and Strategy of Vodafone Company

Analyst Management Summary Report of vodafone UK Table of Contents Overview 3 Company Profile 3 Financial Summary 4 Financial Ratio Analysis 5 Company Growth and Strategy 7 Market Competition 8 Risks 11 Recommendation 11 References 13 Appendices 15 1.... inancial Ratios 20 Overview This paper would attempt to assess the financial health of vodafone Group PLC, by evaluating its financial performance, its market position and its future strategy.... Million in the stocks of vodafone....
7 Pages (1750 words) Essay

Factors That Influence the Dividend Policies for UK Companies

Decisions regarding dividends are guided by the firm's dividend policy.... dividend policy is influenced by the investment… Stockholders have certain requirements that need to be taken into consideration in determining dividend policy or formulation of an appropriate dividend structure. Arriva is the one of the biggest names in the transport service business in the Arriva's balance sheet of last 5 years (from 2004-2008) is densely populated with debt financing and it is obvious because Arriva is a servicing business....
3 Pages (750 words) Essay

Opportunities Vodafone

A Framework for AnalysisA resource based analysis of vodafone involves an investigation of the capabilities and resources that results to its strengths and weaknesses.... For a careful analysis of vodafone's current strategy, some essential issues affecting the company both externally and internally need to be examined.... It has been credited for being the biggest telecommunications network company all over the world with a market worth of close to hundred billion pounds....
2 Pages (500 words) Essay

Dividend Policy - Plan for Apple's Cash

Apple has been notorious for its policy of holding out on its cash hoard (particularly during Jobs' tenure), and refusing to pay dividends to its shareholders.... Greenlight Capital's position dividend policy This February Apple has doled out this quarter's dividends.... This dividend policy is, of course, justified.... However, Greenlight Capital, one of its shareholders, slapped the company with a lawsuit, demanding a modification of such policy....
2 Pages (500 words) Essay

Dividends Policy of Vodafone

nother example relates to the long-term dividend yield history of vodafone group whereby in 2009 there was the largest yield while in 1999 the lowest yield.... Thirdly, shareholders receive the corporation dividends proportional to what they own in the corporation, thus dividend policy Dividends commonly relates to the investment earnings distribution amongst a firm's shareholders.... Corporate managers always consider the choice of dividend policy....
2 Pages (500 words) Assignment

Analysis and Interpretation of Financial Statements: Intec Telecom Plc

Effectively financial analysis is the exploration of a firm's past financial performance and based on this analysis, it requires the formulation of an effective forecast for estimating the future performance of the firm.... The author of this paper provides a financial analysis of the Intec Telecom Plc company during the years 2008 and 2009 and based on this analysis the recommendations are formulated as to whether the investors should buy the stock of this firm or not....
8 Pages (2000 words) Case Study

The Financial Engineer's Most Versatile Tool

The EPS graph of the company has been shown for a five year period to highlight the rise in the earnings per share due to a stock repurchase program.... n announcement of a share repurchase by a company is valued highly by the market participants interpreting it as a 'buy signal' for its stock.... So the company has good reasons to buy-back its stocks but sometimes these share buyback programs go awry.... From the viewpoint of the company stock buyback results in increased Earnings per share (EPS), share price and increases the value of “executive stock options” (Ogilvie, 2006, p....
12 Pages (3000 words) Dissertation

Financial Status of the Vodafone

Headquarters of vodafone is located in London, United Kingdom (UK).... Headquarters of vodafone is located in London, United Kingdom (UK).... In this paper, Vodafone will be considered in order to study the rules and regulations followed by the company for the preparation of its annual report.... hellip; This essay analyzes Vodafone Group Plc, that is a British telecommunication company which operates in multiple nations worldwide....
6 Pages (1500 words) Coursework
sponsored ads
We use cookies to create the best experience for you. Keep on browsing if you are OK with that, or find out how to manage cookies.
Contact Us