StudentShare
Contact Us
Sign In / Sign Up for FREE
Search
Go to advanced search...
Free

Financial Strengths and Weaknesses of Tesco And Wal-Mart - Essay Example

Cite this document
Summary
The paper "Financial Strengths and Weaknesses of Tesco And Wal-Mart" is an exceptional example of an essay on finance and accounting. This paper seeks to analyze the strengths and weaknesses of Tesco and Wal-Mart in terms of profitability, liquidity and efficiency, and other relevant financial ratios…
Download full paper File format: .doc, available for editing
GRAB THE BEST PAPER94.6% of users find it useful
Financial Strengths and Weaknesses of Tesco And Wal-Mart
Read Text Preview

Extract of sample "Financial Strengths and Weaknesses of Tesco And Wal-Mart"

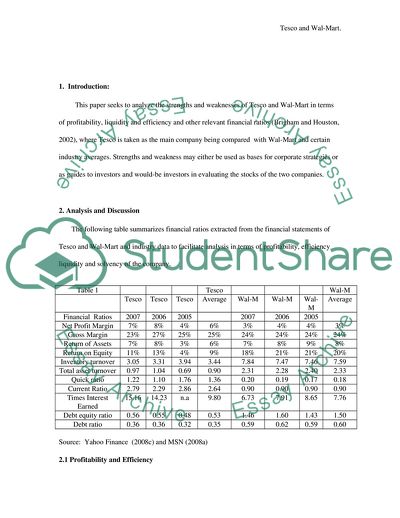
 Financial Strengths and Weaknesses of Tesco And Wal-Mart. 1. Introduction: This paper seeks to analyze the strengths and weaknesses of Tesco and Wal-Mart in terms of profitability, liquidity and efficiency and other relevant financial ratios (Brigham and Houston, 2002), where Tesco is taken as the main company being compared with Wal-Mart and certain industry averages. Strengths and weakness may either be used as bases for corporate strategies or as guides to investors and would-be investors in evaluating the stocks of the two companies. 2. Analysis and Discussion The following table summarizes financial ratios extracted from the financial statements of Tesco and Wal-Mart and industry data to facilitate analysis in terms of profitability, efficiency liquidity and solvency of the company. Table 1 Tesco Wal-M Tesco Tesco Tesco Average Wal-M Wal-M Wal-M Average Financial Ratios 2007 2006 2005 2007 2006 2005 Net Profit Margin 7% 8% 4% 6% 3% 4% 4% 3% Gross Margin 23% 27% 25% 25% 24% 24% 24% 24% Return of Assets 7% 8% 3% 6% 7% 8% 9% 8% Return on Equity 11% 13% 4% 9% 18% 21% 21% 20% Inventory turnover 3.05 3.31 3.94 3.44 7.84 7.47 7.46 7.59 Total asset turnover 0.97 1.04 0.69 0.90 2.31 2.28 2.40 2.33 Quick ratio 1.22 1.10 1.76 1.36 0.20 0.19 0.17 0.18 Current Ratio 2.79 2.29 2.86 2.64 0.90 0.90 0.90 0.90 Times Interest Earned 15.16 14.23 n.a 9.80 6.73 7.91 8.65 7.76 Debt equity ratio 0.56 0.55 0.48 0.53 1.46 1.60 1.43 1.50 Debt ratio 0.36 0.36 0.32 0.35 0.59 0.62 0.59 0.60 Source: Yahoo Finance (2008c) and MSN (2008a) 2.1 Profitability and Efficiency Tesco’s profitability is obviously higher than Wal-Mart. Based on net profit margin for years 2007, 2006 and 2005 where Tesco had 7%, 8%, 4% o or and average of 6% for the three year period as compared with Wal-Mart’s 3%, 4%, and 4% for the same years respectively or an average of 4%. The same behaviour may be observed in terms of gross margin where Tesco had a higher ratio at average of 25% as against that of Wal-Mart at 24%. See Table I above. This means that the 3% difference in net profit margin has its roots in lower cost of revenues for Tesco and lower operating expenses in relation to revenues. This also means the Tesco is more efficient based on generated revenues. If net profit margin of Tesco of for 2007 at 7% and of Wal-Mart of 3% as against industry average of 6.24% (See Appendix A), Tesco is clearer more profitable than competitors on the average. Industry average is estimated by getting the same financial ratios of Marks and Spencer (MSN, 2008b) and taking the average of three companies for comparison. In terms of return on assets (ROA), Tesco has shown 7%, 8% and 3% for the years 2007, 2006 and 2005 respectively or an average of 6% which is higher as against that of Wal-Mart at 7%, 8% and 9% for the same years respectively or an average of 8%. Surprisingly, Wal-Mart is better this time. This better profitability of Wal-Mart is strengthened in terms of better return of returns on equity (ROE) at 18%, 21% and 21% for the years 2007, 2006 and 2005 respectively or an average of 20% as against that of Tesco at 11%, 13% and 4% for the years 2007, 2006 and 2005 respectively or an average of 9%. See Table I above. If the ROE’s of Tesco and Wal-Mart for 2007 are compared with industry average of 25.79% (See Appendix A), it would appear that both companies are not performing more profitably than competitors on the average. It may be noted that ROA is more of a measure of efficiency while ROE is more of a measure of profitability. The better ROA and better ROE of Wal-Mart as against Tesco created a conflict with an earlier finding based on net profit margin and gross margin. To resolve the seeming conflict, Wal-Mart must be declared as more efficient and more profitable than Tesco since ROA measures the use of assets in business in trying to maximize the revenues. The better efficiency of Wal-Mart is further confirmed by faster inventory turnover of Wal-Mart at 7.84, 7.47 and 7.46 for the years 2007, 2006 and 2005 respectively or an average of 7.59 as against that of Tesco at 3.05, 3.31 and 3.94 for the years 2007, 2006 and 2005 respectively or an average of 3.44. Faster turnover in inventory means that it takes faster for Wal-Mart to sell. Further the same finding is confirmed by better total asset turn over of Wal-Mart at 2.31, 2.28 and 2.40 for the years 2007, 2006 and 2005 respectively or an average of 2.33 as against that of Tesco at 0.97, 1.04 and 0.69 for the years 2007, 2006 and 2005 respectively or an average of 0.90. See Table I above. Better use of assets for Wal-Mart could only mean better asset utilization of assets and therefore better efficiency. 2.2 Liquidity The companies’ liquidity indicates their capacity to meet currently maturing obligations, which are measured by the quick ratios and current ratios (Meigs and Meigs, 1995). Tesco’s quick ratios are higher at 1.22, 1.10 and 1.76 for the years 2007, 2006 and 2005 respectively or an average of 1.36 as against that of Wal-Mart at 0.20, 0.19 and 0.17 for the years 2007, 2006 and 2005 respectively or an average of 0.18. The same liquidity behaviour of the Tesco is observed in terms of current ratios, where Tesco reflected higher at 2.79, 2.29 and2.86 for the years 2007, 2006 and 2005 respectively or an average of as against that of Wal-Mart at a uniform of .90 for the whole three-year period. The better liquidity is also supported by having better capacity to service interest expense in terms of Tesco’s higher number of times interest earned at an average of 9.80 as against Wal-Mart’s 7.76. Comparing quick ratio from current ratio, it may be noted that quick ratio is better measure for liquidity since the same excludes inventory and other current assets in the composition of the quick assets. It may be observed however that the results of the profitability analysis appear to create some inconsistency in the resulting liquidity ratios of the Tesco and Wal-Mart. This may be explained by the fact that although Tesco is less efficient and less profitable than Wal-Mart, Tesco started better than Wal-Mart using 2005 as basis in terms of better financial condition at that point. 2.3 Solvency Solvency like liquidity also measures the ability of an enterprise to pay its debts but this time the issue is long terms debts of the company hence solvency tells more about long-term heath where a stable company is deemed stronger than an unstable one (Van Horne, 1992; Ross et. al, 1996). Using debt to equity ratio as an expression of solvency, Tesco reflected better at 0.56, 0.55 and 0.48 for the years 2007, 2006 and 2005 respectively or an average of 0.53 as against that of Wal-Mart at 1.46, 1.60 and 1.43 for the years 2007, 2006 and 2005 respectively or an average of 1.50. See Table I above. Tesco’s debt equity ratio of 0.56 for 2007 is also better than industry average 0f 1.05 (See Appendix A). Note that this time, the lower the ratio, the better the solvency or financial leverage. 3. Conclusion Based on the foregoing analysis and discussion, this paper concludes that Wal-Mart is more profitable and efficient compared to that of Tesco but both the profitability of two companies is still below the industry average. In terms of liquidity and solvency, Tesco is definitely better than Wal-Mart. The seeming conflict of better profitability not amounting or resulting necessarily to better liquidity and solvency may be explained by the fact the Tesco from the start of comparison period has definitely better financial position than Wal-Mart, hence Tesco’s lower profitability and efficiency could not just have eroded that stronger and more stable position during the period under review. The better solvency for Tesco is confirmed by the fact of its even better than industry average. This paper therefore attributes more strengths and less weakness for Tesco compared with Wal-Mart for strategic management purposes. In addition Tesco’ stock is also a better investment option than that of Wal-Mart’s. No wonder, the stocks of Tesco has behaved better than that of Wal-Mart. See Appendices B and C. Appendices Appendix A Industry M&S Tesco Wal-Mart Average Net Profit Margin 8.73% 7% 3% 6.24% Return on Equity 48.37% 11% 18% 25.79% Debt/Equity Ratio 1.13 0.56 1.46 1.05 Appendix B – Stock Price Graph of Tesco Source: Yahoo Finance (2008a) Appendix C -- Stock Price Graph of Wal-Mart Source: Yahoo Finance (2008b) References: Brigham and Houston (2002) Fundamentals of Financial Management, Thomson South-Western, London, UK Meigs and Meigs (1995) Financial Accounting, McGraw-Hill, London, UK MSN (2008a) Financial Statement s 2005 to 2007, {www document} URL http://moneycentral.msn.com/investor/invsub/results/hilite.asp?Symbol=MAKSF, Accessed April 10, 2008 MSN (2008b) Financial ratios of Marks and Spencer for 2007 , {www document} URL http://moneycentral.msn.com/investor/invsub/results/hilite.asp?Symbol=MAKSF, Accessed April 10, 2008 Ross et. al (1996) Essentials of Corporate Finance ,IRWIN, London, UK Van Horne (1992) Financial Management and Policy, Prentice-Hall International, London, UK Yahoo Finance (2008a), Stock Graph of Tesco plc, {www document} URL http://finance.yahoo.com/q/bc?s=TESO&t=5y, Accessed April 10, 2008 Yahoo Finance (2008a), Stock Graph of Wal-Mart, {www document} URL, http://finance.yahoo.com/q/bc?s=WMT&t=5y, Accessed April 10, 2008 Yahoo Finance (2008c), Financial Statement s 2005 to 2007, {www document} URL, http://finance.yahoo.com/q/bs?s=WMT&annual Accessed April 10, 2008 Read More
Cite this document
  • APA
  • MLA
  • CHICAGO
(Financial Strengths and Weaknesses of Tesco And Wal-Mart Case Study, n.d.)
Financial Strengths and Weaknesses of Tesco And Wal-Mart Case Study. https://studentshare.org/finance-accounting/1713235-analyze-the-financial-strengths-and-weaknessesin-terms-of-profitability-liquidity-and-efficiency-revealed-by-the-report-and-key-ratios-of-tesco-and-wal-mart
(Financial Strengths and Weaknesses of Tesco And Wal-Mart Case Study)
Financial Strengths and Weaknesses of Tesco And Wal-Mart Case Study. https://studentshare.org/finance-accounting/1713235-analyze-the-financial-strengths-and-weaknessesin-terms-of-profitability-liquidity-and-efficiency-revealed-by-the-report-and-key-ratios-of-tesco-and-wal-mart.
“Financial Strengths and Weaknesses of Tesco And Wal-Mart Case Study”. https://studentshare.org/finance-accounting/1713235-analyze-the-financial-strengths-and-weaknessesin-terms-of-profitability-liquidity-and-efficiency-revealed-by-the-report-and-key-ratios-of-tesco-and-wal-mart.
  • Cited: 0 times
sponsored ads
We use cookies to create the best experience for you. Keep on browsing if you are OK with that, or find out how to manage cookies.
Contact Us