StudentShare
Contact Us
Sign In / Sign Up for FREE
Search
Go to advanced search...
Free

Financial ratios - Assignment Example

Cite this document
Summary
(31 December 2013). “Consolidated financial statements 31 December 2013.” Qatar Stock Exchange. Retrieved 14 May 2015 from…
Download full paper File format: .doc, available for editing
GRAB THE BEST PAPER93% of users find it useful
Financial ratios
Read Text Preview

Extract of sample "Financial ratios"

Financial Ratio Analysis Number: Lecturer: Financial Ratio Analysis Doha Bank Q.S.C. a) Liquidity Ratios i) Current asset ratio Current asset ratio = current assets/current liabilities = 65,428,874,000/52,818,101,000 = 1.24 or 124%ii) Acid test (quick) ratioAcid test = (cash + Due from other banks + investment securities)/ current liabilities = (3,435,761,000 + 9,180,420,000 + 11,703,577,000)/52,818,101,000 = 24,319,758,000/52,818,101,000 = 0.

46 or 46%iii) Cash ratio Cash ratio = Cash Equivalents + Marketable Securities Current Liabilities = 24,319,758,000 52,818,101,000 = 0.46 or 46%b) Financial leverage ratiosi) Debt ratio Debt ratio= Total Debt/Total Assets = 55,698,921,000/66,969,824,000 = 0.832 or 83.2%ii) Debt-to-equity ratio Debt-to-equity ratio= Total Debt/ Total Equity = 55,698,921,000/11,270,903,000 = 4.

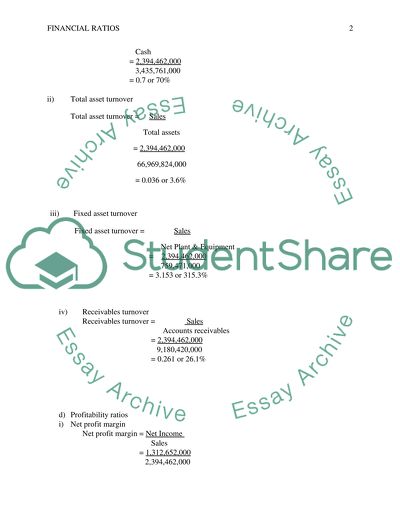
942 or 494.2%c) Efficiency ratiosi) Cash turnoverCash turnover = Sales Cash = 2,394,462,000 3,435,761,000 = 0.7 or 70%ii) Total asset turnover Total asset turnover = Sales Total assets = 2,394,462,000 66,969,824,000 = 0.036 or 3.6%iii) Fixed asset turnover Fixed asset turnover = Sales Net Plant & Equipment = 2,394,462,000 759,471,000 = 3.

153 or 315.3% iv) Receivables turnover Receivables turnover = Sales Accounts receivables = 2,394,462,000 9,180,420,000 = 0.261 or 26.1% d) Profitability ratiosi) Net profit marginNet profit margin = Net Income Sales = 1,312,652,000 2,394,462,000 = 0.

55 or 55%ii) Return on assetsReturn on assets = Net Income Assets = 1,312,652,000 66,969,824,000 = 0.0196 or 1.96%iii) Operating income marginOperating income margin = Operating Income (EBIT) Sales = 1,317,759,000 2,394,462,000 = 0.

55 or 55%iv) Return on investmentReturn on investment = Net Income Long-term Liabilities + Equity = 1,312,652,000 14,151,723,000 = 0.093 or 9.3% v) Return on equityReturn on equity = Net Income Equity = 1,312,652,000 11,270,903,000 = 0.

1165 or 11.65%vi) Gross profit margin Gross profit margin = Gross Profit Sales = 1,822,251,000 2,394,462,000 = 0.761 or 76.1%e) Market value ratiosi) Price earnings ratio = Market price per share Earnings per share = 58.8 5.29 = 11.1 times ii) Market-to-Book ratio Market-to-Book ratio = market price per share Book value per share =58.

8 43.7 = 1.35 times Commercial Bank of Qatar (CBQ)a) Liquidity Ratiosi) Current asset ratioCurrent asset ratio = current assets/current liabilities = 103,649,354,000/85,778,808,000 = 1.21 or 121%ii) Acid test (quick) ratioAcid test = cash + Due from other banks + investment securities/ current liabilities = 36,786,810,000/85,778,808,000 = 0.

43 or 43%iii) Cash ratio Cash ratio = Cash Equivalents + Marketable Securities Current Liabilities = 29,884,263,000 85,778,808,000 = 0.35 or 35%b) Financial leverage ratiosi) Debt ratio Debt ratio= Total Debt/Total Assets = 96,556,770,000/113,111,865,000 = 0.854 or 85.4%ii) Debt-to-equity ratioDebt-to-equity ratio= Total Debt/ Total Equity = 96,556,770,000/16,555,095,000 =5.

83 or 583%c) Efficiency ratiosi) Cash turnoverCash turnover = Sales Cash = 3,607,146,000 6,902,547,000 = 0.52 timesii) Total asset turnoverTotal asset turnover = Sales Total assets = 3,607,146,000 113,111,865,000 = 0.032 timesiii) Fixed asset turnoverFixed asset turnover = Sales Net Plant & Equipment = 3,607,146,000 1,283,186,000 = 2.

81 times or 281% iv) Receivables turnover Receivables turnover = Sales Accounts receivables = 3,607,146,000 15,177,969,000 = 0.24 timesd) Profitability ratiosi) Net profit marginNet profit margin = Net Income Sales = 1,605,378,000 3,607,146,000 = 0.445 or 44.5% ii) Return on assetsReturn on assets = Net Income Assets = 1,605,378,000 113,111,865,000 = 0.0142 or 1.42% iii) Operating income marginOperating income margin = Operating Income (EBIT) Sales = 1,607,758,000 3,607,146,000 = 0.446 or 44.6% iv) Return on investmentReturn on investment = Net Income Long-term Liabilities + Equity = 1,605,378,000 27,333,057,000 = 0.0587 or 5.87% v) Return on equityReturn on equity = Net Income Equity = 1,605,378,000 16,555,095,000 = 0.097 or 9.7%vi) Gross profit marginGross profit margin = Gross Profit Sales = 2,188,359,000 3,607,146,000 = 0.

61 or 61%e) Market value ratiosi) Price earnings ratio = Market price per share Earnings per share = 70.5 6.48 = 10.88 timesii) Market-to-Book ratio Market-to-Book ratio = market price per share Book value per share = 70.5 56.

4 = 1.25 times Comparisons between the two banks Liquidity RatiosDoha BankCommercial Bank of QatarAssessmentCurrent asset ratio124%121%Doha Bank has more liquid asset than CBQAcid test ratio46%43%Doha Bank has more liquid asset than CBQCash ratio46%35%Doha Bank has more liquid asset than CBQFinancial leverage ratiosDoha BankCommercial Bank of QatarAssessmentDebt ratio83.2%85.4%CBQ has more debts than Doha BankDebt-to-equity ratio494.

2%583%CBQ has more debts than Doha BankEfficiency ratiosDoha BankCommercial Bank of QatarAssessmentCash turnover70%52%Doha Bank is more efficient than CBQTotal asset turnover3.6%3.2%Doha Bank is more efficient than CBQFixed asset turnover315.3%281%Doha Bank is more efficient than CBQReceivables turnover 26.1%24%Doha Bank is more efficient than CBQProfitability ratiosDoha BankCommercial Bank of QatarAssessmentNet profit margin55%44.5%Doha Bank is more profitable than CBQReturn on assets1.96%1.

42%Doha Bank has better return on assets than CBQOperating income margin55%44.6%Doha Bank is more profitable than CBQReturn on investment9.3%5.87%Doha Bank has better returns on investment than CBQReturn on equity11.65%9.7%Doha Bank has better returns on equity than CBQGross profit margin76.1%61%Doha Bank is more profitable than CBQMarket value ratiosDoha BankCommercial Bank of QatarAssessmentPrice earnings ratio11.110.88Doha Bank is better in value than CBQMarket-to-Book ratio1.351.25Doha Bank is better in value than CBQWorks CitedCommercial Bank of Qatar.

(31 December 2013). “Consolidated financial statements 31 December 2013.” Qatar Stock Exchange. Retrieved 14 May 2015 from http://www.qe.com.qa/pps/qe/qe+english+portal/Pages/Company+Profile+Pages/Financial+Statements+Details?com.tibco.ps.pagesvc.action=updateRenderState&rp.currentDocumentID=3fbacc09_14425b1d033_-3ea07f000001&rp.attachmentPropertyName=Attachment&rp.revisionNumber=1&com.tibco.ps.pagesvc.mode=resource&rp.redirectPage=-53343f7a_1279673d2a9_-78b60a000136&com.tibco.ps.pagesvc.

targetPage=-53343f7a_1279673d2a9_-78ad0a000136Doha Bank Q.S.C. (31 December 2013). “Consolidated financial statements for the year ended 31 December 2013.” Qatar Stock Exchange. Retrieved on 14 May 2015 from http://www.qe.com.qa/pps/qe/qe+english+portal/Pages/Company+Profile+Pages/Financial+Statements+Details?com.tibco.ps.pagesvc.action=updateRenderState&rp.currentDocumentID=2acdba71_143b91c7213_19d57f000001&rp.attachmentPropertyName=Attachment&rp.revisionNumber=2&com.tibco.ps.pagesvc.mode=resource&rp.

redirectPage=-53343f7a_1279673d2a9_-78b60a000136&com.tibco.ps.pagesvc.targetPage=-53343f7a_1279673d2a9_-78ad0a000136

Read More
Tags
Cite this document
  • APA
  • MLA
  • CHICAGO
(“Financial ratios Assignment Example | Topics and Well Written Essays - 500 words”, n.d.)
Financial ratios Assignment Example | Topics and Well Written Essays - 500 words. Retrieved from https://studentshare.org/finance-accounting/1694541-financial-ratios
(Financial Ratios Assignment Example | Topics and Well Written Essays - 500 Words)
Financial Ratios Assignment Example | Topics and Well Written Essays - 500 Words. https://studentshare.org/finance-accounting/1694541-financial-ratios.
“Financial Ratios Assignment Example | Topics and Well Written Essays - 500 Words”, n.d. https://studentshare.org/finance-accounting/1694541-financial-ratios.
  • Cited: 0 times

CHECK THESE SAMPLES OF Financial ratios

Understanding Concepts: Important financial ratios to a business

Understanding Concepts: Important financial ratios to a business Ratio Analysis helps the business manager to see trends in a business, and compare its condition and performance with that of like businesses in a similar industry.... This comparison of business ratios to those of other similar businesses will indicate the weaknesses or strengths within a business (Albrecht, 2011).... ratios important to a manager of a large corporation include return on investment (ROI), return on assets, (ROA), and debt-to-equity....
4 Pages (1000 words) Essay

Deep Water's Financial Ratios Analysis and Interpretation

Deep Water Experts financial ratios Analysis and Interpretation The task on hand is to compute for the company's financial ratios for 2010 and 2011.... After obtaining and analyzing the company's financial ratios, these were then compared to industry ratios, where available, in order to provide a benchmark with which to compare the company's performance.... Following the computation, an interpretation of the ratios obtained was done to analyze the financial position of the company, and to determine the overall performance with regard to its financial management....
7 Pages (1750 words) Assignment

Financial Ratios Analysis

Occupancy percentage: This is defined as a ratio of rooms sold to rooms available.... Total number of rooms sold is 7555.... Given this, the occupancy percentage works out as 24.... .... Normally, 60 to 70 is the average occupancy rate and hence the hotel has not performed well.... This… c....
3 Pages (750 words) Essay

Financial Ratios to Analyse Companies

financial ratios allow the management, shareholders and investors to compare the financial performance of the company with its performances in previous years or with the performances of… This report analyses the financial performances of Tesco in the last 2 years i.... Different financial ratios are calculated using the financial statements of the company for the year 2012 and 2011 and then analysis The gross profit margin of Tesco has declined by almost 4% as shown in Table 2: Gross profit margin....
5 Pages (1250 words) Essay

Financial Ratios Analysis and Comparison Paper

The financial ratios calculated from the financial statements of the organization helps to determine the liquidity, profitability and… A comparative analysis with a local healthcare organization namely, Health Management Associates have been conducted to determine the scope of improvement in the performance of healthcare services. The financial ratios play a The financial ratios for Universal Health Services have been calculated for the last three years which helps to understand the performance trend of the health care organization....
3 Pages (750 words) Essay

The Popularity of Financial Ratios in Multivariate Modeling

In this report, “The Popularity of financial ratios in Multivariate Modeling” the author will advise NENE limited on various projects they are hoping to take up.... Different appraisal methods will be used including NPV, ARR, Cash flow and Payback period methods.... hellip; The author explains that Internal Rate of Return is the method that gives the investors an easy way of estimating the quantity or rate of return that an investment is expected to offer....
16 Pages (4000 words) Essay

Financial Ratios Project

This ratio rises in both companies but the current ratio in Target Corp.... over the three years has been better than that of Wal-Mart Inc.... since it slightly higher.... hellip; The acid test shows the ability of the companies to offset their current debts with their current assets excluding inventories....
4 Pages (1000 words) Case Study

Interpret Financial Statements: Calculate and Interpret Financial Ratios

… Interpret Financial ments-Calculate & Interpret financial ratios” Contents Contents 2 Sainsbury: Financial ratio 3 3 Graphical comparison: Sainsbury and Morrisons 6 Rationale for selection of Morrisons 11 Recommendation 11 References 13 Appendix 14 Sainsbury: Financial ratio The financial ratio of Sainsbury has been given below in tabular form along with the trend analysis.... This have been represented in the next two graphs given below. Rationale for selection of Morrisons Morrisons have been selected for comparison with the business trends and financial performance with Sainsbury....
3 Pages (750 words) Assignment
sponsored ads
We use cookies to create the best experience for you. Keep on browsing if you are OK with that, or find out how to manage cookies.
Contact Us