StudentShare
Contact Us
Sign In / Sign Up for FREE
Search
Go to advanced search...
Free

Deep Water's Financial Ratios Analysis and Interpretation - Assignment Example

Cite this document
Summary
The paper "Deep Water's Financial Ratios Analysis and Interpretation"  presents an interpretation of the ratios obtained done to analyze the financial position of the company, and to determine the overall performance with regard to its financial management…
Download full paper File format: .doc, available for editing
GRAB THE BEST PAPER98.6% of users find it useful
Deep Waters Financial Ratios Analysis and Interpretation
Read Text Preview

Extract of sample "Deep Water's Financial Ratios Analysis and Interpretation"

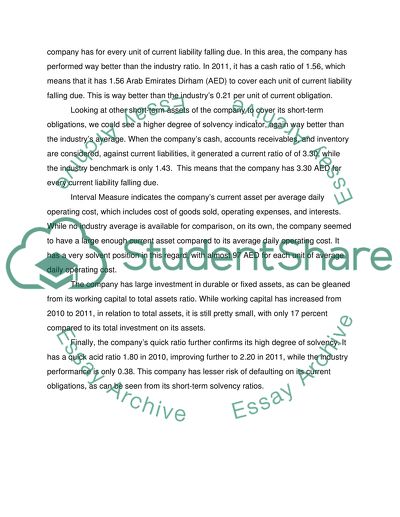
?Deep Water Experts Financial Ratios Analysis and Interpretation The task on hand is to compute for the company’s financial ratios for and Following the computation, an interpretation of the ratios obtained was done to analyze the financial position of the company, and to determine the overall performance with regard to its financial management. The company’s short-term and long-term liquidity, its asset management ratios, and profitability ratios were computed and analyzed. After obtaining and analyzing the company’s financial ratios, these were then compared to industry ratios, where available, in order to provide a benchmark with which to compare the company’s performance. Overall, the picture of the company’s financial health is quite promising, and a potential for expansion seemed to be a likely opportunity to explore. I. Short-term solvency or liquidity ratios Short-term solvency or Liquidity Ratios 2010 2011 Industry 1. Cash Ratio 1.08 1.56 0.21 2. Current Ratio 2.67 3.30 1.43 3. Interval Measure   96.92 n/a  4. Net working capital to total assets 0.12 0.17  n/a 5. Quick Ratio 1.80 2.20 0.38 Liquidity refers to the “availability of resources to meet short-term cash requirements” of the company (Larson and Jensen). In the case of Deep Water Experts’ finances, it refers to its ability to generate cash and cash-like assets to pay for its expenses as they come due, at least in the short-run horizon. Cash ratio indicates the amount of cash the company has for every unit of current liability falling due. In this area, the company has performed way better than the industry ratio. In 2011, it has a cash ratio of 1.56, which means that it has 1.56 Arab Emirates Dirham (AED) to cover each unit of current liability falling due. This is way better than the industry’s 0.21 per unit of current obligation. Looking at other short-term assets of the company to cover its short-term obligations, we could see a higher degree of solvency indicator, again way better than the industry’s average. When the company’s cash, accounts receivables, and inventory are considered, against current liabilities, it generated a current ratio of of 3.30, while the industry benchmark is only 1.43. This means that the company has 3.30 AED for every current liability falling due. Interval Measure indicates the company’s current asset per average daily operating cost, which includes cost of goods sold, operating expenses, and interests. While no industry average is available for comparison, on its own, the company seemed to have a large enough current asset compared to its average daily operating cost. It has a very solvent position in this regard, with almost 97 AED for each unit of average daily operating cost. The company has large investment in durable or fixed assets, as can be gleaned from its working capital to total assets ratio. While working capital has increased from 2010 to 2011, in relation to total assets, it is still pretty small, with only 17 percent compared to its total investment on its assets. Finally, the company’s quick ratio further confirms its high degree of solvency. It has a quick acid ratio 1.80 in 2010, improving further to 2.20 in 2011, while the industry performance is only 0.38. This company has lesser risk of defaulting on its current obligations, as can be seen from its short-term solvency ratios. II. Long-term solvency or financial leverage ratios Long-term solvency has been defined as the “company’s long-run financial viability and its ability to cover long-term obligations” (Larson and Jensen). Further, it is concerned more on the company’s capital structure, or the composition of the company’s sources of finances to support its business activities, whether in financing, investing, or operating activities. The company’s debt to equity ratio measures the proportion of the company’s assets contributed by its owners, and those assets that are supplied by its creditors. In 2011, the company has one unit of debt for each unit of equity. In 2010, it has a much lower debt per equity ratio, especially when compared to industry average. Industry benchmark indicates that a better job is having 1.08 unit of equity per unit of debt. Equity multiplier shows the company’s assets per unit of equity. An equity multiplier of 2, as indicated in the company’s 2011 performance, shows that the company has two unit of assets per unit of equity. This could be interpreted as well that the company’s assets is being financed equally by debt and by equity. Industry average is 2.08, indicating that the company is just close to industry practice. There is no available industry average for long-term debt ratio, an indicator of the company’s long-term debt proportion to its total financing. In 2010, the company has 37 percent debt vis-a-vis overall financing structure, increasing further to 46 percent in 2011. The total debt ratio, which measures the company’s total debt as a proportion of the company’s total assets, just confirmed the company’s financing structure, that is, almost 50 percent of its operations is being financed by creditors. It has 42 percent in 2010, incurring more exposure in 2011 with 50 percent debt financing, although a better performance than the industry’s 52 percent. Better means the company has less risk by having 50 percent debt financing, compared to industry’s reliance on debt to finance its operations at 52 percent over equity. III. Asset management or turnover ratios Asset management, or turnover ratios, are used to determine the efficiency of the company in terms of asset utilization (Larson and Jensen). These ratios indicate how much revenues are generated in relation to the utilization of assets. These ratios are obtained from two sources, the balance sheet and the income statement of the company. Cash coverage indicates the amount of cash available to pay for interest (www.accountingtools.com). While the company has substantial amount of cash to cover its interest payments at 5.52, it is way below the industry’s 8.43. When it comes to the company’s ability to earn what it has allotted for interest expense payment, it has also performed way below the industry average of 8.06, with only 3.30 times interest earned, based on 2011 performance. Inventory turnover ratio for the company indicates an unfavorable figure, 9.30 times compared to industry’s 6.15 times. This means that the company’s competitors are better in selling its products/services with a much faster turnover. On the average, it takes about 39 days for the company to convert its merchandise to cash. Receivables turnover measures the ability of the company to convert receivables into cash. It measures how quickly receivables are collected and converted into cash. The company is very efficient in this aspect, with a turnover of 23.35, compared to industry’s 9.82. It seems that it also has a shorter conversion date from receivables to cash, with only about 16 days before sales on account are collected, on the average. The company has used its assets quite efficiently when it comes to generating sales. Compared to industry’s 0.21 total asset turnover, the company has generated 1.09 sales for each unit of asset. NWC and fixed assets turnover are also quite high, although no industry average can be obtained for comparison purposes. IV. Profitability ratios Profitability Ratios 2011 Industry 1. Profit Margin 5.21% 6.98% 2. Return on Assets (ROA) 5.65% n/a 3. Return on Equity (ROE) 11.31% 16.54% Profitability refers to a company’s “ability to generate an adequate return on invested capital” (Larson and Jensen). Profitability ratios are therefore used to assess the earnings ability of the firm, relative to its utilization of resources, and sourcing of its financing. Profit margin ratio measures the company’s ability to generate income from its sales. It is computed by dividing net income over sales. Deep Water Experts’ profit margin is only 5.21 percent, compared to industry standard ratio of almost seven percent. The company generated 5.65 percent of net income when measured against total assets. Unfortunately, no industry average can be obtained to benchmark this figure. The company’s return on equity, on the other hand, is pegged at 11.31 percent, compared to industry’s 16.54 percent. Return on equity measures the company’s net income relative to its total equity. For 2011, therefore, the company generated only 11 percent, while industry benchmark is almost at 17 percent. This is an unfavorable figure, which can be interpreted as the company’s competitors earning more that Deep Water Experts’ owners. The company has to do a lot more to be at par with the industry’s average. In conclusion, there are favorable and unfavorable indicators generated by the company, especially when compared to industry averages. While the company seems to be very liquid in the short-run, it seems it is not very efficient in utilizing its resources, i.e., its assets. There is a lot of room for improvement, as competitors seem to be doing well and far better than the company. While its financial resources may warrant a possible expansion, its financial ratios indicate that it has not maximized its potentials yet within its current operations. Expanding at the current moment, while improving operations on its current position, might be a daunting task if both initiatives are undertaken simultaneously. While it is not completely insurmountable, the company might do well to postpone its expansion a bit later, and concentrate in maximizing first its potentials on its current activities. Works Cited Larson, Kermit and Tilly Jensen. Fundamental Accounting Principles. 13th edition. Mc Graw Hill, 2010. www.accountingtools.com. Accounting Tools. 2013. 31 May 2013. . Read More
Cite this document
  • APA
  • MLA
  • CHICAGO
(“Deep Water Experts Financial Ratios Assignment Example | Topics and Well Written Essays - 1500 words”, n.d.)
Retrieved from https://studentshare.org/finance-accounting/1479159-deep-water-experts-financial-ratios
(Deep Water Experts Financial Ratios Assignment Example | Topics and Well Written Essays - 1500 Words)
https://studentshare.org/finance-accounting/1479159-deep-water-experts-financial-ratios.
“Deep Water Experts Financial Ratios Assignment Example | Topics and Well Written Essays - 1500 Words”, n.d. https://studentshare.org/finance-accounting/1479159-deep-water-experts-financial-ratios.
  • Cited: 0 times

CHECK THESE SAMPLES OF Deep Water's Financial Ratios Analysis and Interpretation

Public Interest in Theories of Regulation

financial Accountancy Table of Contents: Sl.... Managers have a general responsibility of regulation and legitimacy towards financial accounting.... Public interest has made it mandatory that financial reporting has to adhere to the principles of corporate responsibility.... The gist of these sections is that financial reporting authorities have to prove their credibility very early by establishing detailed policy of financial security....
18 Pages (4500 words) Essay

Free Exchange: Zero Sum Debate

Messrs Piketty and Saez found out that the capital-output ratios were very stable over time despite the fluctuating tax rates.... This assignment "Free Exchange: Zero Sum Debate" relates to policymaking.... The policymakers consider the canons of taxation put forth by Adam Smith but some markets are so complex that it is almost impossible to achieve all the objectives of these canons: There are trade-offs....
11 Pages (2750 words) Assignment

Financial Policies and the Value of the Firm: The Role of Corporate Governance

he empirical analysis consists of the financials of 100 companies from the fiscal years 1985to 2012.... This dissertation "financial Policies and the Value of the Firm: The Role of Corporate Governance " discusses global trade, differences in values, motives, and political power that have established a major need for the financial strategies to survive on the markets.... Corporate responses are made according to a desire to avoid developing a financial deficit....
28 Pages (7000 words) Dissertation

Financial Management: Research focuses AMAREX Corporation

Investment decision making involves the elements of a classic cost-benefit analysis.... In June 2005 ARAMEX went public on the Dubai financial Market (DFM) as Arab International Logistics (ARAMEX) with its shares traded under ARMX.... Adler (2000) suggests that strategic investment decision making involves the process of identifying, evaluating, and selecting projects that are likely to have a big impact on a company's competitive advantage....
23 Pages (5750 words) Essay

Financial Statement Analysis in Kingfisher Plc

This report "Financial Statement analysis in Kingfisher Plc" explains the importance of a regulatory framework for companies producing financial reports in the international context.... As shown by the financial statements and the analysis of the financial statements above, the company was able to a) Consolidate the strong leadership positions of its more developed operations in the UK and France.... Financial Statement analysis shows different findings as follows: ...
13 Pages (3250 words) Book Report/Review

Evaluating the Performance of Oman Fisheries Company Ltd for the Managers' Decision-Making

The paper will further conduct a literature review on the above-mentioned financial ratios as well as an analysis of Oman Fisheries based on the calculated ratios.... he objective of this paper is to use the financial analysis in evaluating the performance of Oman Fisheries Company Limited and to give a clear vision to the investors and managers for appropriate decision-making.... This analysis helps management to take appropriate action particularly with respect to the direction to be pursued by the company....
16 Pages (4000 words)

Haya Water - Leadership Vision and Commitment

analysis of the SituationFrom a business expert perspective, staff turnover is one of the essential areas to keep an eye on during the financial period.... Turnover refers to the percentage of the company's workforce, which voluntarily quits during the financial year....
15 Pages (3750 words) Case Study
sponsored ads
We use cookies to create the best experience for you. Keep on browsing if you are OK with that, or find out how to manage cookies.
Contact Us