StudentShare
Contact Us
Sign In / Sign Up for FREE
Search
Go to advanced search...
Free

China Eastern Airlines Corporation Analysis - Essay Example

Cite this document
Summary
The essay "China Eastern Airlines Corporation Analysis" focuses on the critical analysis of the major issues in the China Eastern Airlines Corporation. China Eastern Airlines Corporation is a company in the airline sector. The company is of Chinese origin and is one of the key players…
Download full paper File format: .doc, available for editing
GRAB THE BEST PAPER94.6% of users find it useful
China Eastern Airlines Corporation Analysis
Read Text Preview

Extract of sample "China Eastern Airlines Corporation Analysis"

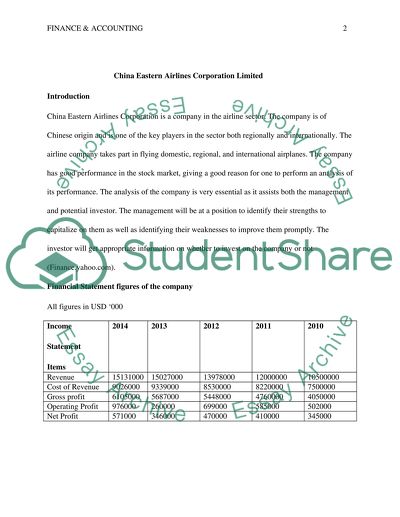
Finance & Accounting al Affiliation) China Eastern Airlines Corporation Limited Introduction China Eastern Airlines Corporation is a company in the airline sector. The company is of Chinese origin and is one of the key players in the sector both regionally and internationally. The airline company takes part in flying domestic, regional, and international airplanes. The company has good performance in the stock market, giving a good reason for one to perform an analysis of its performance. The analysis of the company is very essential as it assists both the management and potential investor. The management will be at a position to identify their strengths to capitalize on them as well as identifying their weaknesses to improve them promptly. The investor will get appropriate information on whether to invest on the company or not (Finance.yahoo.com). Financial Statement figures of the company All figures in USD ‘000 Income Statement Items 2014 2013 2012 2011 2010 Revenue 15131000 15027000 13978000 12000000 10500000 Cost of Revenue 9026000 9339000 8530000 8220000 7500000 Gross profit 6105000 5687000 5448000 4760000 4050000 Operating Profit 976000 260000 699000 585000 502000 Net Profit 571000 346000 470000 410000 345000 Balance Sheet Items 2014 2013 2012 2011 2010 Current assets 2941000 2083000 2034385 2005000 1950000 Receivables 623000 582000 475448 435045 405875 Inventory 364000 381000 335133 350000 302000 N.C assets 23788000 21054000 17850000 20000000 17500000 Total assets 26729000 23137000 19884863 18500000 18120000 C. liabilities 9853000 8768000 7804280 8050000 7650000 N.C liabilities 11755000 9648000 8591959 9400000 8150000 Equity 4831000 4444000 3243402 35000000 310000 Ratio Analysis Workings Gross Profit Margin = (Gross Profit / Revenue) * 100% In 2014: (6105000 / 15131000) * 100% = 40.35% 2013: (5687000 / 15027000) * 100% = 37.85% 2012: (5448000 / 13978000) * 100% = 38.98% 2011: (4760000 / 12000000) * 100% = 39.67% 2010: (4050000 / 10500000) * 100% = 38.57% Operating Profit Margin = (Operating Profit / Revenue) * 100% In 2014: (976000 / 15131000) * 100% = 6.45% 2013: (260000 / 15027000) * 100% = 1.73% 2012: (699000 / 13978000) * 100% = 5% 2011: (585000 / 12000000) * 100% = 4.88% 2010: (502000 / 10500000) * 100% = 4.78% Net Profit Margin = (Net Profit / Revenue) * 100% In 2014: (571000 / 15131000) * 100% = 0.38% 2013: (346000 / 15027000) * 100% = 2.3% 2012: (470000 / 13978000) * 100% = 3.36% 2011: (410000 / 12000000) * 100% = 3.42% 2010: (345000 / 10500000) * 100% = 3.29% Return on Assets = (Net Profit / Total Assets) * 100% In 2014: (571000 / 26729000) * 100% = 2.14% 2013: (546000 / 23137000) * 100% = 2.36% 2012: (470000 / 19884000) * 100% = 2.36% 2011: (410000 / 18500000) * 100% = 2.22% 2010: (345000 / 18120000) * 100% = 1.9% Debt Ratio = Total liabilities / Total assets In 2014: 21898000 / 26729000 = 0.82 2013: 18693000 / 23137000 = 0.81 2012: 16641461 / 19884863 = 0.84 2011: 15256598 / 18500000 = 0.82 2010: 17810000 / 18120000 = 0.98 Debt Equity Ratio = Debt / Equity In 2014: 11755000 / 4831000 = 2.43 2013: 9648000 / 4444000 = 2.17 2012: 8591959 / 3243402 = 2.65 2011: 9400000 / 3500000 = 2.69 2010: 8150000 / 3100000 = 2.63 Return on Equity = (Net Profit / Equity) * 100% In 2014: (571000 / 4831000) * 100% = 11.82% 2013: (546000 / 4444000) * 100% = 12.29% 2012: (470000 / 3243402) * 100% = 13.78% 2011: (410000 / 3500000) * 100% = 11.71% 2010: (345000 / 3100000) * 100% = 11.13% Inventory Turnover= (Inventory / Sales) * 100% In 2014: (364000 / 15131000) * 100% = 2.41% 2013: (381000 / 15027000) * 100% = 2.54% 2012: (335133 / 13978000) * 100% = 2.4% 2011: (350000 / 12000000) * 100% = 2.91% 2010: (302000 / 10500000) * 100% = 2.8% Fixed assets turnover = Sales / fixed assets In 2014: 15131000 / 23788000 = 0.64 2013: 15027000 / 21054000 = 0.71 2012: 13978000 / 17850000 = 0.78 2011: 12000000 / 18500000 = 0.65 2010: 10500000 / 18120000 = 0.58 Total assets turnover = Sales / total assets In 2014: 15131000 / 26729000 = 0.57 2013: 15027000 / 23137000 = 0.65 2012: 13978000 / 19884863 = 0.70 2011: 12000000 / 18500000 = 0.65 2010: 10500000 / 18120000 = 0.58 Receivables turnover = Sales / receivables In 2014: 15131000 / 62300 = 24.29 2013: 15027000 / 582000 = 25.82 2012: 13978000 / 475448 = 29.40 2011: 1200000 / 435045 = 27.58 2010: 1050000 / 40587 = 25.87 Current Ratio = Current Assets / Current Liabilities In 2014: 2941000 / 9853000 = 0.30 2013: 2083000 / 8768000 = 0.24 2012: 2034385 / 7804280 = 0.26 2011: 2005000 / 8050000 = 0.25 2010: 1950000 / 7650000 = 0.25 Quick Ratio = (Current Assets - Inventory) / Current Liabilities In 2014: (2941000 - 364000) / 98530000 = 0.26 2013: (2083000 - 381000) / 8768000 = 0.19 2012: (2034000 - 335133) / 7804280 = 0.22 2011: (2005000 - 350000) / 8050000 = 0.21 2010: (1950000 - 302000) / 7650000 = 0.22 Working Capital = Current Assets – Current Liabilities In 2014: 2941000 – 9853000 = -6912000 2013: 2083000 – 8768000 = -6685000 2012: 2034000 – 7804280 = -5769895 2011: 2005000 – 8050000 = -6045000 2010: 1950000 – 7650000 = -5700000 Profitability Ratios The Company has maintained a good gross profit margin over the five-year period. It had 38.57% in 2010, 39.67% in 2011, 38.98% in 2012, 37.85% in 2013, and 40.35%. The constant figure of gross profit margin, which the company maintained on the earlier periods, indicates that the prices were of their products and services, and purchases matched in increase and decrease (Barrow and Barrow, 2008). The fall in 2013 shows that there was a fall in prices but this was compensated by the sudden increase of the ratio in 2014 showing that the company is making profits from its sales. The Company’s operating profit margin was 4.78% in 2010, 4.88% in 2011, 5% in 2012, 1.73% in 2013, and 6.45% in 2014. This margin increased steadily over the five-year period with the exception of the sudden fall in 2013. The fall in operations was a result of operational difficulties, which the company experienced. The company had to incur extra costs to bring the situation back to normal (Berman, Knight and Case, 2006). The larger increase in the margin in 2014 shows the managements effort in correcting the problem experienced in 2013. The increase of the ratio over the five years indicates the management’s efficiency in generating profits from the operations of the company. China Eastern Airlines Corporation Limited’s net profit margin was 3.29% in 2010, 3.42% in 2011, 3.36% in 2012, 2.35% in 2013, and 0.38% in 2014. The company maintained a fair margin the earlier three years of the five-year period. The performance during those years was desirable as it indicated that the management’s efficiency in generating sufficient net profit from the sales of the company (Berman, Knight and Case, 2013). The fall of the margin in 2013 and 2014 put the managements’ efficiency into question. The fall in 2013 is quite understandable since both the operating profit margin and the gross profit margin in this year is low but the decrease in 2014 is questionable of the management’s performance (Bragg, 2002). This is because all the other profitability ratios in 2014 have been registering the highest figures in comparison with those of the previous years (Buffett and Clark, 2008). Management Ratios China Eastern Airlines Company had a fixed assets turnover of 0.60 in 2010, 0.60 in 2011, 0.78 in 2012, 0.71 in 2013, and 0.64 in 2014. The fixed assets turnover shows the amount of revenue earned by the company for every amount of fixed asset owned by the company. This ratio measures the management’s efficiency in utilizing the fixed assets to generate maximum revenue. The company had an increase in the ratio during the first three years showing an increase in management’s efficiency on utilizing the fixed assets. The company experienced a fall in this ratio in the latest two years. In 2013, the fall was quite understandable due to the economic lapse that hit the entire industry but there is no concrete reason for the fall in 2014. In contrary, there should be an incredible increase due to the rise in the economy and the increase in revenue and gross profit in the year. The Company had a total assets turnover of o.58 in 2010, 0.65 in 2011, 0.70 in 2012, 0.65 in 2013 and 0.57in 2014. The total assets turnover shows the amount of revenue the company earns from every amount of total assets owned by the company. This ratio measures the efficiency of a company’s management by determining its efficiency in utilizing the company’s total assets to generate maximum sales. The ratio took a similar trend as the one the fixed assets turnover took over the five-year period. There was a rise in the ratio in the earlier three years and decline in the last two years. This indicates fluctuation in the management’s efficiency over utilization of its total assets. The company’s receivables turnover was 25.87 in 2010, 27.58 in 2011, 29.40 in 2012, 25.82 in 2013, and 24.29 in 2014. The receivables turnover ratio determines the management’s efficiency in collecting its current debts. A high ratio implies the management is very efficient in collecting its receivables and therefore minimizing the chances of the company incurring bad debts. The ratio took a similar trend as the one the other efficiency ratios took by having an increase in the ratio in the earlier three years and a decline in the last two years. This common trend puts into question the management’s efficiency for the decline in efficiency currently witnessed. The Company’s return on assets was 1.9% in 2010, 2.22% in 2011, 2.36% in 2012, 2.36% in 2013, and 2.14% in 2014. The increase in the ratio from 2010 to 2013 shows the managements effectiveness in generating sufficient profits from the available total assets. The increase indicates an improvement in this efficiency. The fall of the ratio from 2013 to 2014 shows a reduction in the efficiency of the management. It raises questions of what might have happened during that time to cause this fall (Bull, 2008). The return on equity ratio of the company is 11.13% in 2010, 11.71% in 2011, 13.78% in 2012, 12.29% in 2013, and 11.82% in 2014. The increase in the ratio in the earlier three years of the five-year period is desirable as it indicates the management’s efficiency in generating sufficient profits from the shareholders equity. The increase in this ratio therefore implies that the management’s efficiency is improving. The decrease in the ratio in the year 2013 and 2014 show a fall in the management’s efficiency due to the fall in generating profits from shareholders equity. This implies that the shareholder will no longer earn as they have been earning from their investments (Ketz, Doogar and Jensen, 1990). The Inventory turnover of the company is 2.8% in 2010, 2.91% in 2011, 2.41% in 2012, 2.54% in 2013, and 2.41%. There is a general fall in this ratio all through the five years with minor fluctuations. This ratio indicates management’s efficiency in converting the inventory into revenue. A fall in the ratio as experienced in this case is not desirable as it shows that many products are piling up in the warehouses as inventory instead of being converted to revenue. If this trend continues, the company will incur high holding and inventory costs while making low revenue (Vance, 2003). Liquidity Ratios The current ratio of the company is 0.25 in 2010, 0.25 in 2011, 0.26 in 2012, 0.24 in 2013, and 0.30 in 2014. This ratio indicates the extent in which a company can offset its current liabilities using its current assets. The company has maintained a constant level of this ratio in the earlier four years of the five-year period. This low ratio shows that the company is not able to offset its current liabilities with its current assets. The liquidity of the company is into question due to the low current ratio it has. The increase in the ratio in 2014 shows an improvement on the liquidity of the company (Marketwatch.com). The quick ratio of the company is 0.22 in 2010, 0.21 in 2011, 0.22 in 2012, 0.19 in 2013, and 0.26. The trend in this ratio is similar to that of the current ratio despite the deduction of the inventories from the current assets. This ratio shows the liquidity of the company more accurately since the inventory is not easily converted to cash like the other current assets (Tennent, 2008). The company gets a figure of this ratio constantly for the five-year period. The low figure shows the company’s inability to offset its current obligations with its current liquid assets. The increase in the ratio on 2014 is a good improvement by the company and should be continued to raise the liquidity position of the company (Ross, Westfield, and Jordan, 2006). The working capital is -$ 5700000000 in 2010, -$ 6045000000 in 2011, -$ 5769895000 in 2012, -$ 6685000000 in 2013 and -$ 6912000000 in 2014. The working capital is also a measure of the company’s liquidity. It quantifies the extent in which the company is liquid. According to this ratio, the company’s liquidity is worsening over the five-year period. This indicates that the company finds it harder to offset its current obligations with its current assets (Thomsett, 2007). Investor Ratios China Eastern Airlines Corporation Limited has a debt equity ratio of 2.63 in 2010, 2.69 in 2011, 2.65 in 2012, 2.17 in 2013, and 2.43 in 2014. The high ratio experienced by the company in the earlier three years of the five-year period indicates that the company is relies more on debt than equity to finance its operations. Heavy reliance on debt as experienced on this years may discourage an investor from investing in the company since the investments is assumed as very risky (Goldstein, Kaminsky and Reinhart, 2000). A potential investor will therefore require high compensation to invest in the company in a bid to safeguard their wealth in case of bankruptcy. This is because the investor will be the last in the hierarchy of claiming wealth. The decrease in the ratio in the two final years of the five-year period is quite desirable as it shows the management’s desire in trying to reduce this ratio to reduce the gearing of the company (Fridson and Alvarez, 2002). The Company’s debt ratio was 0.98 in 2010, 0.82 in 2011, 0.84 in 2012, 0.81 in 2013, and 0.82 in 2014. The debt ratio compares the total debt the companies has with its total assets. A high ratio indicates that the company is heavily geared while a low ratio indicates that the company is has little debt in comparison with its debts. The company had a high ratio in the beginning of the five-year period but as time elapsed, the ratio declined apart from the slight fluctuation in 2012. The decline in the ratio means that the leverage level of the company goes down. This is a positive indicator for the investors as it means that investing the company is currently less risky. Many potential investors will be attracted to invest in the company due to this fact and as a result, the cost of equity will be low since the company will not have to compensate the investors against the risk of investing in the company. Conclusion The analysis of China Eastern Airlines Company covers the major areas, which determine a company’s performance. The company has a fair performance though it has experienced some challenges in performance in the last two years. These challenges were caused by various factors such as economic conditions, industry factors and managements efficiency. The application of the recommendations made to the management will see the company’s performance rising. Recommendations The management of the company should maintain the increase in gross profit margin and operating profit margin such as that of 2014. The management needs to investigate the cause of the sudden fall in net profit margin in the year 2014. This will give proper explanation of the problem since it currently shows that the company is not making sufficient profits. The management should also investigate the fall in the management ratios from 2013 to 2014. The investigation will help management to improve on its utility of the assets and equity to generate sufficient profits. To add on this, the management should try to reduce the debt level of the company by trying to increase its equity finance. This will enable the company to attract more investors. The increase of the debt ratio by the company should be maintained by the company as it counters the negative impression created by the poor debt equity ratio the company has. It is highly advisable that the company improves its liquidity position. This can be done by increasing investment in the current assets or practicing a good working capital management system. Practicing working capital management can be enhanced by collecting the receivables fast while delaying the payables taking good care to utilize the discounts and not to get fines. The management should research on the problem affecting their efficiency since the decline in efficiency for the last two years is highly undesirable. If the management’s efficiency continues with this downward trend, it will affect negatively the performance of the company. References Barrow, C. and Barrow, C. 2008. Practical financial management. London: Kogan Page. Berman, K., Knight, J. and Case, J. 2006. Financial intelligence. Boston: Harvard Business School Press. Berman, K., Knight, J. and Case, J. 2013. Financial intelligence. Boston, Mass.: Harvard Business Review Press. Bragg, S. 2002. Business ratios and formulas. Hoboken, N.J.: Wiley. Buffett, M. and Clark, D. 2008. Warren Buffett and the interpretation of financial statements. New York: Scribner. Bull, R. 2008. Financial ratios. Oxford: CIMA. Finance.yahoo.com, 2015.China Eastern Airlines Corporate Stock - Yahoo! Finance. [Online] Available at: http://finance.yahoo.com/q/bs?s=CEA [Accessed 12 May 2015]. Fridson, M. and Alvarez, F. 2002. Financial statement analysis. New York: John Wiley & Sons. Goldstein, M., Kaminsky, G. and Reinhart, C. 2000. Assessing financial vulnerability. Washington, D.C.: Institute for International Economics. Ketz, J., Doogar, R. and Jensen, D. 1990. A cross-industry analysis of financial ratios. New York: Quorum Books. Marketwatch.com, 2015. China Eastern Airlines Corp. Ltd. ADS. [online] Available at: http://www.marketwatch.com/investing/stock/cea/financials [Accessed 12 May 2015]. Ross, S., Westerfield, R. and Jordan, B. 2006. Fundamentals of corporate finance. Boston, Mass.: McGraw-Hill/Irwin. Tennent, J. 2008. Guide to financial management. London: Profile Books. Thomsett, M. 2007. The stock investors pocket calculator. New York: AMACOM/American Management Association. Vance, D. 2003. Financial analysis & decision making. New York: McGraw-Hill. Read More
Cite this document
  • APA
  • MLA
  • CHICAGO
(“Analysis the China Eastern Airlines Corporation Limited Essay”, n.d.)
Analysis the China Eastern Airlines Corporation Limited Essay. Retrieved from https://studentshare.org/finance-accounting/1693677-analysis-the-china-eastern-airlines-corporation-limited
(Analysis the China Eastern Airlines Corporation Limited Essay)
Analysis the China Eastern Airlines Corporation Limited Essay. https://studentshare.org/finance-accounting/1693677-analysis-the-china-eastern-airlines-corporation-limited.
“Analysis the China Eastern Airlines Corporation Limited Essay”, n.d. https://studentshare.org/finance-accounting/1693677-analysis-the-china-eastern-airlines-corporation-limited.
  • Cited: 0 times

CHECK THESE SAMPLES OF China Eastern Airlines Corporation Analysis

STRATEGIC SUPPLY MANAGEMENT

The corporation has even created Emirates Engineering department for its strategic SCM structure so that this division can ensure that the operations of the company are effectively managed and the latest IT systems are integrated with precision as well.... Strategic Supply Chain Management at Emirates Airline NAME: AFFILIATION: UNIVERSITY: Executive Summary As the developments take place at a continuous pace within the business environment, it is crucial for the organisations to remain well-informed about the latest changes within their respective sectors....
16 Pages (4000 words) Essay

Political Environment on Airline Industry in China

The paper " Political Environment on Airline Industry in china" states that it is essential to state that low load factors compounded china's aviation woes.... The international average is 70% to 75% while Chinese carriers operated at only 65% passenger loads.... ...
13 Pages (3250 words) Essay

Analytital ( compare northwest airlines and jet blue with american airlines

is the principal subsidiary of Northwest airlines corporation.... Northwest airlines regional flights are operated under the name Northwest Air link by Mesaba airlines, Pinnacle airlines, and Compass airlines.... Northwest airlines is currently a minority owner of Midwest airlines, holding a 40% stake in the company.... Northwest airlines tagline is "Now youre flying smart....
18 Pages (4500 words) Essay

The Sale of Travel Insurance

Until the establishment of Nas Air, Saudi Arabian airlines, the national carrier, was the only airline in the country.... As of December 2013, there were only two airlines operating in in Saudi Arabia: Saudi Arabian airlines, the national carrier, and Flynas, although plans were underway to licence more airlines in a bid to diversify the Saudi aviation industry and make it more competitive....
13 Pages (3250 words) Research Proposal

Challenges Faced by the Apple Company

"Challenges Faced by the Apple Company" paper analizes the evolution of the Apple Computer was one of the most notable in the history of the computer industry.... Since it was incorporated on January 3, 1977, Apple Computer proved to be one of the forces to reckon with.... ... ... ... The dropping of the word computer from the company's name is one of the best ways to guide the thinking of the public that Apple Inc....
6 Pages (1500 words) Case Study

Analysis of Civil Aerospace Market

The paper "analysis of Civil Aerospace Market" discusses that reductions in defence budgets for the aerospace industry, both in the US and other nations of the developed world, have decreased the needs for missiles, military aircraft, and other related machinery from US suppliers.... However, the fact remains that the open skies policy, pursued by many large airlines, has been successful to a large extent and has made air travel safer, secure and convenient for all....
8 Pages (2000 words) Case Study

Strategic Supply Chain Management at Emirates Airline

The corporation has even created Emirates Engineering department for its strategic SCM structure so that this division can ensure that the operations of the company are effectively managed and the latest IT systems are integrated with precision as well.... t has been stated by Seghal (2011) that the majority of the large corporations such as Unilever, P&G, Colgate-Palmolive, Emirates airlines, Sony, Apple, Microsoft, LG, Nokia, McDonald's, Pizza Hut and others have expanded their business operations in international markets....
16 Pages (4000 words) Case Study

The Aviation Industry in China and Hong Kong

The paper " The aviation industry in china and Hong Kong" tells us about stages of development of the aviation industry in china over the past 2000 years.... It was in china that the first man-made flying object in form of a kite was invented.... china has for a long time been recognized as a world leader is science and technology.... Over the years china has experienced a rapid growth and expansion in its economy....
34 Pages (8500 words) Coursework
sponsored ads
We use cookies to create the best experience for you. Keep on browsing if you are OK with that, or find out how to manage cookies.
Contact Us