StudentShare
Contact Us
Sign In / Sign Up for FREE
Search
Go to advanced search...
Free

The Income Statement and the Balance Sheet of the Company - Essay Example

Cite this document
Summary
The paper "The Income Statement and the Balance Sheet of the Company" tells that the company’s horizontal analysis has been provided where the 5-year trends are compared with each other and tors. The results are also analysed for the prospects of growth and the ability for further development…
Download full paper File format: .doc, available for editing
GRAB THE BEST PAPER92.1% of users find it useful
The Income Statement and the Balance Sheet of the Company
Read Text Preview

Extract of sample "The Income Statement and the Balance Sheet of the Company"

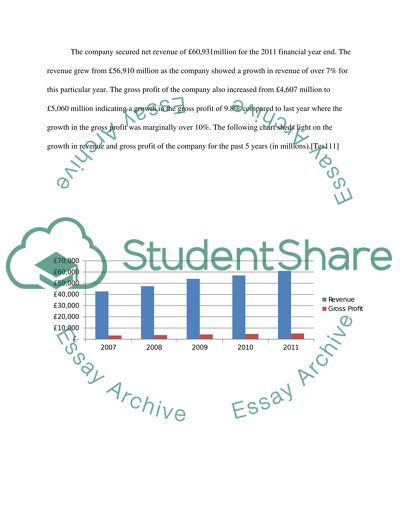
Financial Analysis of TESCO Plc The company has been analysed with respect to its performance, based on the results of the past five years where theincome statement and the balance sheet of the company have been examined and the relevant ratios have been computed to determine the strength, profitability and ability of the company to survive in the market and grow as a strong organization in the retail industry. The company’s financial year ends at the end of February, which for the most recent year ended on February 26, 2011. Horizontal Analysis The company’s horizontal analysis has been provided where the 5 year trends of the company are compared with each other as well as with its competitors. The results are also analysed for the prospects of growth and the ability of further development. The major competitors with which the company has been compared are J Sainsbury Plc, Morrisons and Marks and Spencer. Income Statement The company secured net revenue of £60,931million for the 2011 financial year end. The revenue grew from £56,910 million as the company showed a growth in revenue of over 7% for this particular year. The gross profit of the company also increased from £4,607 million to £5,060 million indicating a growth in the gross profit of 9.8% compared to last year where the growth in the gross profit was marginally over 10%. The following chart sheds light on the growth in revenue and gross profit of the company for the past 5 years (in millions). (Tesco Plc, 2011) The company was able to secure a net profit before tax of £3,535 million for the year ended February 2011, which rose from £3,176 million in 2010. The net profit after tax saw a considerable growth as the company sustained a net profit after tax of £2,655 million for 2011 which was an increase of 14% since 2010 from £2,327 million. The adjacent chart shows the trend of the net profit before and after tax for the past 5 years (in millions). The company declared a dividend of £0.14 per share (Money Central, 2011). Balace sheet The total current assets of the company amounted to £11,438 million which rose from £11,392 million for the previous year. On the other hand, the total current liabilities were £17,731 million which rose considerably from the previous year as they were £16,015 million in 2010. Current Assets (in millions) Current Liabilities (in millions) 2007 £ 4,168 £8,152 2008 £5,992 £ 10,345 2009 £13,081 £17,595 2010 £11,392 £16,015 2011 £11,438 £17,731 This shows that the company’s ratio of current assets to current liabilities indicates a lack of liquidity to finance the current liabilities. A trend of current assets and liabilities is shown which indicates that the current liabilities have always been over and above the current assets of the company, due to the nature of the company’s business which is a retail business. The long-term debts of the company are £9,689 million at the end of the 2011 financial year; these have decreased considerably in the past year as they stood at £11,744 million in 2010. The lowest standing of the long-term debts of the company during the past 5 years was seen in 2007, where the long-term debts were £4,146 million (Money Central, 2011). The total assets of the company stand at £47,206 million in 2011 of which property, plant and equipment have a considerable share of £26,261 million, while the second largest component is the goodwill of the company which is £3,316 million (Tesco, 2011). The total liabilities of the company are £30,671 million at the end of the financial year 2011, showing a decrease from £31,427 million in 2010. The major component is the long-term debts of the company. The retained earnings of the company stand at £11,210 million which have shown an increasing trend in the past 5 years. Ratio Analysis The major ratios of the company are calculated for the current year as well as the past few years, indicating the liquidity, profitability, return and also the earnings of the company from the investment point of view. Liquidity The liquidity ratios of the company, Tesco Plc, are shown, which include current and quick ratios. Current Ratio: Current Ratio = Current Assets = £11,438 = 0.65 Current Liabilities £17,731 The current ratio for the company stands at 0.65 for the year 2011. The ratio has deteriorated from last year as the same ratio was 0.71 in 2010. It was 0.74, 0.58 and 0.51 in years 2009, 2008 and 2007 respectively which indicates that the company performed well in terms of liquidity in 2009 but since then liquidity issues have struck the company. Other competitors such as J Sainsbury and Marks & Spencer have a current ratio of 0.58 and 0.78. This indicates that the company has a good current ratio compared to the retail industry. (MSN Money, 2011). Quick Ratio: Quick Ratio = Quick Assets = £7,737 = 0.44 Current Liabilities £17,731 The quick ratio of the company lies at 0.44 for the year 2011 which was 0.5 in 2010. The current ratio of J Sainsbury, one of the biggest rivals of the company, was 0.24 and 0.29 for 2011 and 2010 respectively. This indicates that the company has maintained better liquidity in terms of industry trend where the industry has a trend of low liquidity ratio due to high dependency of credit-based transactions of purchases (Business Week, 2011). It is a noticeable fact that a ratio of 1 or greater than 1 is deemed to be a positive sign for the company’s liquidity but here even a ratio of less than 1 indicates no issue of liquidity as the company is duly paying off its liabilities in both the short and long-term. Profitability The profitability ratios of the company are calculated and compared with the financial results of previous years for the company as well as for the competitors of the company. Gross Profit on Sales ratio: Gross Profit on Sales = Gross Profit = £5,060 = 8.3% Sales £60,931 The company’s gross profit for the current year was 8.3% which, for its competitors, namely J Sainsbury, Morrison and Marks & Spencer, was5.5%, 6.27% and 5.67% respectively. There was a considerable increase in the gross profit percentage of Tesco compared to last year as a growth of 3% was seen, indicating that the company, with its considerable size advantage, lies at the top with regard to its profitability. Net Profit on Sales Ratio: Net Profit on Sales = Net Profit = £2,655 = 4.36% Sales £60,931 The net profit ratio of the company was 4.36% for 2011 which increased from 4.09% in 2010, showing that the company has very low operating expenses and the company is highly profitable compared to its competitors. The chart above shows the net profit on sales of Tesco compared with its competitors. By the ratio comparison it is seen that there is little difference between the profitability of Morrison and Tesco but Tesco’s profit is almost 3.2 times that of Morrison in 2007(Money Central, 2011). Turnover, Debt and Equity-based ratios The turnover ratios along with the debt and equity-based ratios are presented with a comparison with previous years and the performance of the company is measured with regard to these ratios. Fixed Assets and Equity Turnover: Equity Turnover = Net Profit = £2,655 = 16.06% Equity £16,535 The Equity turnover of the company for the year 2011 was 16.06% while the fixed asset turnover of the company was 10.11%. This indicates that the company was able to provide a considerable return by utilizing the equity and the fixed assets of the company. The return on equity for the previous 4 years was 15.94%, 16.6%, 18.02% and 18.00%, respectively, indicating that the return has deteriorated since the 2008 financial crisis and the company has shown some improvement in the current year compared to 2010 (Business Week, 2011). Debt to Equity ratio: Debt to Equity = Long term debt = £9,689 = 0.59 Equity £16,535 The debt to equity ratio for the year ended February 2011 was 0.59 which indicates that the company is more dependent on equity compared to debt. This ratio has decreased considerably from the last 2 years where it was 0.80 and 0.96 respectively when the company carried out huge borrowings in the financial year 2008. Earnings Ratio The various ratios from the investors’ point of view are calculated, such as the earnings per share and the dividend yield ratio. Earnings per share: EPS =Net Profit =£2,655= 0.33 Weighted Average Shares8,020 One of the most important ratios from the investors’ point of view is the earnings per share ratio. The earnings per share for the year 2011 were 0.33 pence which increased from 0.29 pence in the previous year. The earnings per share of the competitors of Tesco, namely J Sainsbury, Morrison and Marks & Spencer, were 0.34 pence, 0.23 pence and 0.39 pence, respectively, for the year ended 2011. The graph shows the earnings per share of the four companies from 2007 to 2011(Sainsbury, 2011). Dividend One of the most important indicators from the investment perspective is the dividend which the company distributes. The company issued a dividend of 0.14 pence in 2011 which was 0.13 pence in 2010. The company has been comparatively low in the distribution of dividends compared to its competitors, as seen in the diagram below (Tesco Annual Report, 2011). Tesco J Sainsbury Morrison Marks & Spencer 2007 0.1 0.1 0.04 0.18 2008 0.11 0.12 0.05 0.23 2009 0.12 0.13 0.06 0.18 2010 0.13 0.14 0.08 0.15 2011 0.14 0.15 0.1 0.16 Conclusion It can be said that the company has performed exceptionally well compared to its competitors and has capitalized on the opportunities since the 2008 market slack. The company has also taken its size advantage and used it to maintain a positive growth strategy in terms of revenue, net profit and return on equity and fixed assets but it has lacked slightly in rewarding its shareholders in terms of dividends; however, this is also seen as developing and the company will be able to give away a fair amount of dividends in the near future. Recommendations Following are some useful recommendations which the management, lenders and the shareholders of the company should consider. ManAgement The management should consider the upcoming challenges in terms of maintenance of liquidity to meet the current obligations of the company. The company has managed to recover from the issues it faced during the 2008-09 financial years and over the next 5 years there is immense potential for it to expand throughout the globe in order to bring economies of scale into use. The company’s major challenge in respect of growth will be to compete with its competitors who are offering better return for their investors. Lenders The company has performed well in testing times and has been able to pay off the loans in due time. The company has maintained a healthy liquidity to pay off its current and long-term obligations in due time, keeping in view the low liquidity level a retail company usually maintains. The company’s going concern is also very stable and there is no doubt about the growth in profits of the company; therefore, there is no threat to the lenders in coming times. Shareholders The share price of the company on the reporting date rested at £406.18 per share and the company declared a dividend of 0.14 pence for the current year. The trend of growth in profits of the company and the return that the company has offered to the shareholders will not only remain stable but will also grow in the future as the company has shown signs of recovery from the 2008 market slump. The company has shown prospects of stability; therefore, it is always beneficial for the shareholders to hold the shares of the company (Stockopedia, 2011). References Business Week, 2011. [online] Available from: http://investing.businessweek.com/research/stocks/financials/ratios.asp?ticker=SBRY:LN [Retrieved December 8, 2011] Business Week. 2011. [online] Available from http://investing.businessweek.com/research/stocks/financials/ratios.asp?ticker=TSCDY:US [Retrieved December 8, 2011] Money Central, 2011. [online] Available from http://moneycentral.msn.com/investor/invsub/results/statemnt.aspx?lstStatement=Income&stmtView=Ann&symbol=GB%3aTSCO [Retrieved December 3, 2011] Money Central, 2011. [online], Available from http://moneycentral.msn.com/investor/invsub/results/statemnt.aspx?lstStatement=Balance&stmtView=Ann&symbol=GB%3aTSCO [Retrieved December 4, 2011] Money Central, 2011. [online] Available from http://investing.money.msn.com/investments/stock-price?symbol=MRWSF& [Retrieved December 6, 2011] MSN Money, 2011.[online] Available from http://investing.money.msn.com/investments/stock-price?symbol=JSNSF& [Retrieved December 6, 2011] Sainsbury, J., 2011. Annual Report. J Sainsbury. Stockopedia, 2011. [online] Available from http://www.stockopedia.co.uk/share-prices/tesco-LON:TSCO/financials/ [Retrieved December 8, 2011] Tesco Annual Report, 2011. [online], Available from http://ar2011.tescoplc.com/ [Retrieved December 2, 2011] Tesco Plc, 2011. [online], Available from http://www.tescoplc.com/ [Retrieved December 1, 2011] Tesco, 2011. Tesco Annual Report. Tesco. Read More
Cite this document
  • APA
  • MLA
  • CHICAGO
(“MANAGING FINANCIAL INFORMATION ( part 2 ) Essay”, n.d.)
MANAGING FINANCIAL INFORMATION ( part 2 ) Essay. Retrieved from https://studentshare.org/finance-accounting/1585614-managing-financial-information-part-2
(MANAGING FINANCIAL INFORMATION ( Part 2 ) Essay)
MANAGING FINANCIAL INFORMATION ( Part 2 ) Essay. https://studentshare.org/finance-accounting/1585614-managing-financial-information-part-2.
“MANAGING FINANCIAL INFORMATION ( Part 2 ) Essay”, n.d. https://studentshare.org/finance-accounting/1585614-managing-financial-information-part-2.
  • Cited: 0 times

CHECK THESE SAMPLES OF The Income Statement and the Balance Sheet of the Company

Income statement and balance sheet

The purpose of this paper is to analyze and describe the income statement and the balance sheet.... the income statement and the balance sheet are two interrelated statements.... The income statement is a financial report that provides information regarding the profitability of the company during an accounting period.... The sales of the company are subtracted by the cost of goods sold.... The outcome of the income statement affects the equity account of the balance sheet....
3 Pages (750 words) Essay

Financial statements

The three financial records are used to show the financial situation of the company.... First, a balance sheet is a financial statement that is used to show what a company owns and what it owes to others, in terms of the assets and the liabilities of the company (USEC, 2007).... 2013) The relationships between the income statement, balance sheet, and statement of cash Financial statements refer to the records that show the financial transactions of any given organization, dependent on the direction in which the transaction goes (USEC, 2007)....
4 Pages (1000 words) Research Paper

Diagram Common Financial Statements

For example, a common-size balance sheet will report all of the balance sheet amounts as a percentage of the "Total Assets" amount.... By having all of the balance sheet amounts as a percentage of Total Assets, you can compare your company's current asset percentage (and all other line items) to your industry's percentage or to any other company's percentages.... A common-size income statement will display all of the income statement sums as a percentage of net sales....
3 Pages (750 words) Research Paper

Finance Management for Business - Kingfisher Plc

7 Pages (1750 words) Assignment

Intellectual Capital of Microsoft Inc

Intellectual capital, therefore, can be assumed to be the fundamental aspects of the company's profit and loss statements, as well as its balance sheets.... As opposed to simply considering human capital management as a detail for the company's management, the paper looks at it from an accounting point of view.... It is very imperative to point out that intellectual capital is nothing but a combination of skills, The knowledge of an organization is what is at time referred to as the brain power; therefore, intelligent capital can be viewed as the intangible assets used by the company in the making of its services and products....
12 Pages (3000 words) Essay

Income Statement And Balance Sheet

The answer to the question that how well a company has performed during a particular accounting cycle is exhibited under the heading of an organization's net income within the income statement and the heading of retained earnings within the balance sheet of the organization Income ment And Balance Sheet Both the income ment as well as the balance sheet provides answers to two questions together.... The answer to the question that how well a company has performed during a particular accounting cycle is exhibited under the heading of an organization's net income within the income statement and the heading of retained earnings within the balance sheet of the organization (Ferrell 457)....
1 Pages (250 words) Article

Balance Sheet, Income Statement and Objectives of Accounting and Firms

Another objective is to prepare for the future of the company.... The management needs to know which parts of the company are functioning inefficiently or efficiently.... The author explains the rule of credits and debits varies for different accounts, based on the balance sheet and income statement.... ssumption: Cash would increase thus increasing the Cash account in the balance sheet, and Equity would increase thus increasing the Equity account in the balance sheet....
5 Pages (1250 words) Assignment

Financial Controls Used in Food and Beverage Operations

the balance sheet provides the financial situation of a company at any given time by stipulating the value of both its assets and liabilities.... Such contents of the balance sheet thus portray the size of a company influencing its investment decisions.... esides the balance sheet, a company must have an income financial statement.... A company's assets have financial value and the company can use such as collateral in obtaining loans from different financial institutions operating in the country....
6 Pages (1500 words) Report
sponsored ads
We use cookies to create the best experience for you. Keep on browsing if you are OK with that, or find out how to manage cookies.
Contact Us