StudentShare
Contact Us
Sign In / Sign Up for FREE
Search
Go to advanced search...
Free

Comparative Analysis of Tesco PLCs Financial with that of Industry - Case Study Example

Cite this document
Summary
The author of this case study "Comparative Analysis of Tesco PLC’s Financial with that of Industry" analyzes Tesco PLC. This paper provides information about profitability, liquidity ratios, efficiency ratios, comparative Ration analysis of Tesco PLC with the industry average, Gross Profit Margin…
Download full paper File format: .doc, available for editing
GRAB THE BEST PAPER97.3% of users find it useful
Comparative Analysis of Tesco PLCs Financial with that of Industry
Read Text Preview

Extract of sample "Comparative Analysis of Tesco PLCs Financial with that of Industry"

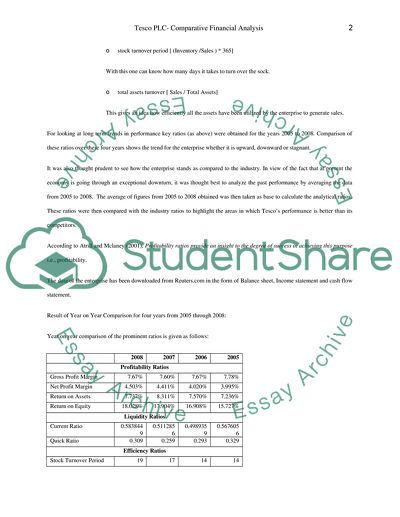
Comparative Analysis of Tesco PLC’s financial with that of Industry The performance analysis of Tesco PLC has been made by using following ratios: Profitability- Profitability ratios are considered as the most important financial ratios. Their significance stems from the fact that they reveal how effective has the management been in generating returns sales and investment (Atrill & Mclaney, 2001). Following main ones have been used: gross profit margin [(net sales-cost of goods sold) / net sales] This ratio helps bring out the adequacy of the profit margin to cover operating expenses and how it will have an effect the bottom-line of the enterprise. net profit margin [earnings after taxes / net sales] With this ratio the net profits are evaluated against the turnover. This gives an idea of the return after meeting the operating cost i.e., breakeven point. In other words once the operating costs are met profits rise in higher proportion to increase in sale. return on assets [Net Income / Total Tangible Assets] This ratio reveals how efficiently the assets have been utilized. In case the rate of return is different than the target rate of return corrective action can be initiated. return on equity [Profit After Tax / Share holders’ fund] With this the owners come to know how much their investment is generating profit for them. Liquidity – Liquidity ratios help in analyzing if the enterprise would be able to repay its short term liabilities. Higher the ratio, higher is the margin of safety for the creditors. Main ratios used in the analysis are: current ratio [Current Assets / Current Liabilities] quick ratio [(Current Assets – Inventory) / Current Liabilities] This alternate ratio gives better idea of the liquidity as it excludes inventory which at times might include items which are difficult to convert into cash and may distort the ratio Efficiency ratios stock turnover period [ (Inventory /Sales ) * 365] With this one can know how many days it takes to turn over the sock. total assets turnover [ Sales / Total Assets] This gives an idea how efficiently all the assets have been utilized by the enterprise to generate sales. For looking at long term trends in performance key ratios (as above) were obtained for the years 2005 to 2008. Comparison of these ratios over these four years shows the trend for the enterprise whether it is upward, downward or stagnant. It was also thought prudent to see how the enterprise stands as compared to the industry. In view of the fact that at present the economy is going through an exceptional downturn, it was thought best to analyze the past performance by averaging the data from 2005 to 2008. The average of figures from 2005 to 2008 obtained was then taken as base to calculate the analytical ratios. These ratios were then compared with the industry ratios to highlight the areas in which Tesco’s performance is better than its competitors. According to Atrill and Mclaney (2001), Profitability ratios provide an insight to the degree of success in achieving this purpose i.e., profitability. The data of the enterprise has been downloaded from Reuters.com in the form of Balance sheet, Income statement and cash flow statement. Result of Year on Year Comparison for four years from 2005 through 2008: Year on year comparison of the prominent ratios is given as follows: 2008 2007 2006 2005 Profitability Ratios Gross Profit Margin 7.67% 7.60% 7.67% 7.78% Net Profit Margin 4.503% 4.411% 4.020% 3.995% Return on Assets 7.737% 8.311% 7.570% 7.236% Return on Equity 18.028% 17.904% 16.908% 15.727% Liquidity Ratios Current Ratio 0.5838449 0.5112856 0.4989359 0.5676056 Quick Ratio 0.309 0.259 0.293 0.329 Efficiency Ratios Stock Turnover Period 19 17 14 14 Total Assets Turnover Ratio 1.5680281 1.71891 1.748615 1.6802778 Profitability- In terms of profitability Gross Profit Margin is range bound showing only a marginal decline of 0.11% over four year period from 2005 to 2008. Thus there is no significant change in terms of operating cost or sale price in the years under consideration. Net Profit Margin has shown slight improvement in the comparative analysis by half a percent i.e., 0.508. Thus even though gross profit ratio is almost stagnant there is slight upward trend in net profit, this could be due to higher turnover wherein the net profit tends to increase after reaching breakeven point for every increase in sales. The other two profitability ratios also indicate the effectiveness of management in managing the resources and they reveal a small but definite upward trend over the four years. Return on assets has grown by 0.501% from 2005 to 2008. Return on equity shows even better growth of 2.301%. Thus retained earnings seem to have yielded increased profit over the years. PROFITABILITY RATIOS:- The Liquidity Ratios on the other hand are just about stagnant and seem to be slightly alarming from creditors’ point of view. Current Ratio which is a rough guide to the short term solvency is around 0.5 thereby showing that at the moment the current assets are only 50% able to cover the short term liabilities. Quick Ratio where the inventories are discounted from current assets is even lower, hovering at 0.3. Hence the firm may have to finance its short term liabilities from long term sources of funds. According to Atrill and Mclaney (2001), Certain ratios may be calculated that examine the relationship between liquid resources held and creditors due for payment in the near future. These ratios in Tesco PLC are as follow. LIQUIDITY RATIOS:- The key efficiency ratios also show a slight decline. Inventory turnover days have gone up from 14 to 19. Thus it takes 5 more days to sell inventory in 2008 than it took to sell it in 2005. Total assets turnover ratio showed upward trend from 2005 through 2007 but declined again in 2008 and this time even below that of the first comparative year. The chart is given on the next page. EFFICIENCY RATIOS:- Comparative Ration analysis of Tesco PLC with industry average: The financials of four years were averaged and then the ratios were calculated. Ratios of the industry were downloaded from Reuters.com and where ever industry average was given the same has been taken. The comparison of Tesco with industry: Tesco (4 Year Average) Industry Profitability Ratios Gross Profit Margin 7.68 7.24 Net Profit Margin 4.26 5.34 Return on Assets 7.74 4.73 Return on Equity 17.24 10.25 Liquidity Ratios Current Ratio .54 0.15 Quick Ratio .30 0.10 Efficiency Ratios Stock Turnover Period 16 0.23 Total Assets Turnover Ratio 1.67 0.05 Over all Tesco PLC compares quite well with the industry ratios. In terms of Profitability – Gross Profit Margin of Tesco PLC is marginally higher than the industry ratio by 0.42. In terms of Net Profit Margin, Tesco’s margin is slightly lower by 1.08. It shows that there is room for further increase in profitability by increasing the turnover. Return on Assets is considerably higher being 3.01 more than industry ratio. It shows that the assets with Tesco are being utilized much more effectively than that by the competitors. Return on Equity is also much better being nearly 7 % higher than that of competitors’ ratio. Thus investors interested in retail trade are much better off investing in Tesco PLC than by investing in competitors belonging to the same industry. We had seen earlier that the liquidity ratios were not very impressive on their own but Tesco’s liquidity is much better than that of competitors as can be seen in the above table. Not only is the current ratio much better than the industry average being higher by 0.39 but even the quick ratio or the acid test ratio also compares very well with the industry average. It is 0.20 higher. Stock Turnover Period is the only ratio which is considerably inefficient being much higher than the industry ratios. In the industry it is less than a day where as it is around 16 days for Tesco PLC. Hence if the enterprise is able to concentrate on managing the inventories its efficiency would go up many fold and other ratios would also improve considerably. In contrast total asset turnover ratio is much better than the industry average which is nearly 3 times than that of competitors. Another view of looking at the operations could be to see the cash flow statements over the four year comparative period. Looking below we can see that the cash position of the firm has strengthened over the years it had even gone into negative territory in 2007 but has improved considerably at the end of 2008. Positive cash flow is seen from operating activities in all the years only financing activities show negative trend, but overall in 2008 the cash flow is positive which in light of current credit crunch an upward trend is. Comparative Cash Flow Statement for four years: In Millions of British Pounds 2008 2007 2006 2005 (except for per share items) 23/02/2008 24/02/2007 25/02/2006 26/02/2005 Period Length Period Length Period Length Restated 52 Weeks 52 Weeks 52 Weeks 25/02/2006 Period Length         52 Weeks Net Income/Starting Line 2,803.00 2,653.00 2,235.00 1,952.00 Depreciation/Depletion 992 878 838 743 Amortization -- -- -- -- Deferred Taxes -- -- -- -- Non-Cash Items 110 -10 100 -124 Changes in Working Capital -562 -910 -554 -395 Cash from Operating Activities 3,343.00 2,611.00 2,619.00 2,176.00 Capital Expenditures -3,600.00 -3,026.00 -2,700.00 -2,304.00 Other Investing Cash Flow Items, Total 646 683 738 803 Cash from Investing Activities -2,954.00 -2,343.00 -1,962.00 -1,501.00 Financing Cash Flow Items 9,333.00 -- -- -- Total Cash Dividends Paid -794 -467 -441 -448 Issuance (Retirement) of Stock, Net -621 -334 64 3 Issuance (Retirement) of Debt, Net -7,506.00 268 -115 -206 Cash from Financing Activities 412 -533 -492 -651 Foreign Exchange Effects -55 -18 16 22 Net Change in Cash 746 -283 181 46 Thus we have seen that Tesco PLC is broadly an efficiently managed enterprise and the only area of concern based on the above analysis is the inventory management. Which it should anyway be concentrating on, as retail industry thrives on proper inventory management. Inventory management denotes improvement in inventory turnover days. The numbers of days have been going up over the four year period and are considerably higher than industry. Logistics of managing inventory can be daunting but considering that inventory is the key item in retail industry, an increase in its efficiency will mean increase in overall efficiency of the enterprise leading to much higher levels of profitability not only in comparison to past performance but also as compared to industry ratios. Having gone through the analysis both for the historical performance over four years and comparison with industry numbers, it would be worthwhile to remember that the economy worldwide is going through a very rough phase thus if we were to extrapolate the historical data it might not reflect the current market conditions. Thus it would be advisable to keep the ears to the ground and look for signs in the current scenario to decide the future course of action. All the down loads from Reuters.com have been consolidated in an excel file by the name “Tesco”. This file contains 5 sheets showing income statement, balance sheets, cash flow statements, ratios of the industry and comparative ratios as derived for the above analysis. The sheets have been named respectively. All the statements show figures for four years from 2005 to 2008. Average for income statements and balance sheets has been extracted beside the relevant columns. Thus the formulae used in calculation can be easily seen by navigating to the cell containing the formula. References Atrill & Mclaney (2001) Accounting and Finance for Non Specialists, England, Pearson Education Ltd. Reuters.com web 20 December 2009 Read More
Cite this document
  • APA
  • MLA
  • CHICAGO
(Comparative Analysis of Tesco PLCs Financial with that of Industry Case Study, n.d.)
Comparative Analysis of Tesco PLCs Financial with that of Industry Case Study. https://studentshare.org/finance-accounting/1561346-b202-part-b-tma
(Comparative Analysis of Tesco PLCs Financial With That of Industry Case Study)
Comparative Analysis of Tesco PLCs Financial With That of Industry Case Study. https://studentshare.org/finance-accounting/1561346-b202-part-b-tma.
“Comparative Analysis of Tesco PLCs Financial With That of Industry Case Study”. https://studentshare.org/finance-accounting/1561346-b202-part-b-tma.
  • Cited: 0 times

CHECK THESE SAMPLES OF Comparative Analysis of Tesco PLCs Financial with that of Industry

Strategic Analysis of the UK Grocery Market

Internal analysis of tesco Tesco is primarily a food retailer with more than 2500 stores across the globe, a majority of which are in UK.... All these analyses have been carried out from the point of view of tesco.... SWOT analysis can be effectively used to carry out an internal assessment of tesco.... Strengths One of tesco's biggest strengths is its continuously increasing market share.... Executive Summary The report aims to carry out a strategic analysis of the UK grocery market with focus on Tesco which is one of the largest players in this segment in UK as well as on a global level....
6 Pages (1500 words) Assignment

The superior brand strength of Sainsburys

… Then the essay shows the corporate values of Sainsbury, combined with effective promotion, continue to bring this brand top performance in this dynamic industry.... Sainsbury is known in important revenue-building markets for its focus on corporate social responsibility, a comparative advantage not found in industry competition.... Sainsbury has also received many reputable and important awards for exceeding industry norms in many different areas....
11 Pages (2750 words) Essay

Business Model of Tesco Plc

Five- Year Report for Tesco PLC Table of Contents Executive Summary 3 Business Model of Tesco 3 Summary of Income Statement financials 6 Fundamental analysis of revenue and net profit 7 Fundamental analysis of other features of the Income Statement 7 Operating Margin 7 Profit after Tax 8 Numerical analysis of historic profitability 8 comparative analysis of tesco PLC with its core competitors 10 Summary of cash flow financials 13 Critical fundamental analysis of historic cash flows 14 References 15 Executive Summary Tesco plc is one among the largest retailers across the globe having over more than 2300 supermarkets and convenience stores....
10 Pages (2500 words) Essay

Fashion Marketing -Marks and Spencer

The Spanish based clothing company survives in the competitive global fashion industry upon an analytical survey of the market variables.... The competitors of Marks and Spencer in fashion industry include a wide range of potential competitors.... Competitors' analysis for Marks and Spencer Competitors' analysis is really worth when designing a lucrative marketing strategy....
4 Pages (1000 words) Essay

UK Annual Reports and Accounts

Annual report of tesco plc, a UK company, provides information under the categories of Chief Executive's Statement, Report of the directors that contain business review, general information, and report on corporate governance, Directors' Remuneration Report, and Financial Statements that include a statement of directors' responsibility, independent auditor's report, group financial statements including notes thereto, parent company's financial statements and independent auditor's report on that....
7 Pages (1750 words) Assignment

The Different Aspects of an Industry

It is often observed that an industry is greatly affected by various external influences.... These factors prove to be beneficial for certain firms in an industry or in some cases even enforce a company to change its… This study would be dealing with different aspects of an industry.... It would comprise of competitive strategies undertaken by different players in the industry and to the degree these innovative strategies has benefited the companies....
20 Pages (5000 words) Essay

Marks and Spencer Group PLC Performance Review

The objective is to make sure that the company has appropriate income in managing the financial obligations and to achieve the objective of the business.... The company has a single financial covenant which is the ration of the depreciation, earnings before interest and tax, rent payable, and the amortization plus the payable rent....
12 Pages (3000 words) Case Study

Tesco PLC and Ocado PLC Annual Report and Financial Statements

nbsp;… The recent growth in the retail market has succeeded in gaining the attention of diverse investment firms such as Mighty Investments which has decided to invest £ 100 millions in the industry.... The key focus during the analysis would be the prospective company's growth potential in specifically the UK grocery and food retailing this is considered because it's the food industry that is not been affected much by the economic meltdown and its progress is consistent, whereas it is witnessed that recession has reduced the buying power of the consumer and created a conservative client....
6 Pages (1500 words) Assignment
sponsored ads
We use cookies to create the best experience for you. Keep on browsing if you are OK with that, or find out how to manage cookies.
Contact Us