StudentShare
Contact Us
Sign In / Sign Up for FREE
Search
Go to advanced search...
Free

Balance Score and Strategy Map Analysis of Chevron - Essay Example

Cite this document
Summary
The paper "Balance Score and Strategy Map Analysis of Chevron" discusses that the balanced scorecard and strategy map of Chevron indicates that the lower order perspectives like the learning and growth perspectives and internal process perspectives are quite successful in meeting the objectives…
Download full paper File format: .doc, available for editing
GRAB THE BEST PAPER98.9% of users find it useful
Balance Score and Strategy Map Analysis of Chevron
Read Text Preview

Extract of sample "Balance Score and Strategy Map Analysis of Chevron"

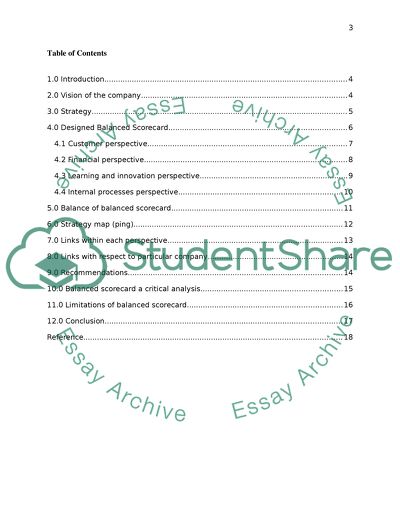
? BALANCE SCORE AND STRATGEY MAP ANALYSIS OF CHEVRON Executive summary Chevron perseveres to be one of the leading global energy producers in the world. The present research report prepares a strategic road map pointing out the various issues confronting the company, and the objectives it has set to confront those issues. Apart from setting the objectives, the research report evaluates each objective. The objectives are numerous in number and each objective shares a direct or indirect cause and effect relationship with the other objectives. For a better visualisation of the objectives`, balances score card is used. The balanced score card is used here as a strategic management tool and strategic control system. The balance score card is supplemented with a strategy map. The strategy map use a more direct approach to depict the cause and effect relationship between the various objectives across finance, customer, internal process and learning and growth. The research report also involves a detailed explanation of the link between each type of objective. Apart from that the strategies are also linked with the mission and objectives of Chevron. Based on the observations obtained from the balanced score card and the strategy map, a recommendation is prepared. A critical analysis of the balanced score card is also provided along with limitation and conclusion in this report. Table of Contents 1.0 Introduction 4 2.0 Vision of the company 4 3.0 Strategy 5 4.0 Designed Balanced Scorecard 6 4.1 Customer perspective 7 4.2 Financial perspective 7 4.3 Learning and innovation perspective 9 4.4 Internal processes perspective 9 5.0 Balance of balanced scorecard 10 6.0 Strategy map (ping) 12 7.0 Links within each perspective 13 8.0 Links with respect to particular company 14 9.0 Recommendations 14 10.0 Balanced scorecard a critical analysis 15 11.0 Limitations of balanced scorecard 16 12.0 Conclusion 16 Reference 18 1.0 Introduction Chevron is a global energy company which deals into various kinds of energy sources like oil, natural gas, oil sands, geothermal, solar energy. The company is catering to the growing demand of energy for the world and at the same time making sure that the nature and environment is kept safe for a healthier and greener tomorrow (Anthony et al., 2011). In the next 35 years, it is estimated that the energy demand will increase by 40% of what is today. In order to cater to the growing demand of the world, efforts are underway to find new means of energy resources. As such the energy resources are scarce and it is estimated that by 2035 more than 30% of the world population is going to survive on renewable sources of energy. Chevron continues to search the horizon for better cleaner and more efficient sources of energy. This endeavour is costly and time consuming and most of the time there are no pay offs from such endeavours. Besides conducting the search for better and cleaner energy and feeding the world with its energy demands, Chevron is also committed to provide a greener and cleaner environment. Various other endeavours involve expenses and Chevron needs to make sure that the ultimate payoff is able to compensate for the costs endured (Argyris, 2007). In order to prepare a road map that can lead to better strategic position in future a balanced score card along with strategic map is presented in this research topic. 2.0 Vision of the company Chevron envisions supplying the world with energy products that will help to create sustainable economic progress as well as human development all across the world. To create people and organisation equipped with excellent capabilities and commitment (Forza and Salvador, 2001). To built a strong brand image among customers, governments, employees as well as local communities. 3.0 Strategy The road to a sustainable future is structured by using balanced score card and subsequent creation of a strategy map to show the implementation of the balanced score card. The strategy is to improve the learning and growth indices. So that improved employee retention, employee, satisfaction and improved employee productivity will lead to improved internal processes like better chances of innovation, better operational excellence and better post-sales service (Hannah, 2000). With increased operational excellence and innovation, the external stakeholders of the organization will start experiencing better results. With improved customer satisfaction index, it is anticipated that the market share will improve by 34%, customer acquisition will increase by 27%, customer retention will increase by 11% and the customer profitability will increase by 39% (Martinsons and Davison, 2012). All the above figures are target set in the previous year. The balanced score card will help to map which targets have been achieved and which target could not be achieved (Kaplan and Norton, 2009). Based on the short comings of the target set in the previous year, new target will be set in the current year. 4.0 Designed Balanced Scorecard Fig 1: balanced score card 4.1 Customer perspective Customer Metrics                   Customer Objective Type Measures Targets Supporting Initiatives Q1 Q2 Q3 Q4 Annual Analysis Market share Measured by dollars Increase share of market from 16% to 30% by end of year. Targeted marketing campaign 14.00% 20.00% 25.00% 36.00% 30.00% Target achieved Customer acquisition Win rate Increase win rate from 16% to 27% Rebates and discounts for new customers 16 25  34 43  25.5 Target not achieved  Customer retention Retention of key account 50% increase in the retention of employees. Targeted customer retention strategy  32 40 55   64   47.5 Target not achieved  Customer profitability percentage of Customer profitability 40 to 65% increase in customer profitability Customer profitability 49 60 79 110 74.5 Target achieved  4.2 Financial perspective Financial Metrics                   ` Measures Targets Supporting Initiatives Q1 Q2 Q3 Q4 Annual Analysis Revenue growth and mix Growth in sales Quarterly growth of 8% Appointment of 50 new recruits in the sales force team 4.00% 5.00% 6.00% 5.00% 5.00% Target not achieved Cost reduction Revenue per employee Revenue per employee increased from $1000 to $2000. Reduction in the employee transportation allowance  1000 1250 1750  2050  312.5%  Target achieved Asset utilization Utilization of the research and development assets as percentage of sales Increase the amount of fund utilized in research and development as percentage of sales from 26% to 35%. Endeavour to increase the research and development in search of better and cleaner sources of energy 26 29 31 35 30% Not achieved Market performance Increase in economic value At least 9% increase in the addition of economic value Increase the market performance 2 7 12 15 9 Target achieved 4.3 Learning and innovation perspective Learning and Growth Metrics                   Learning Objective Type Measures Targets Supporting Initiatives Q1 Q2 Q3 Q4 Annual Analysis Employee retention Percentage of annual turnover Reduction o the percentage of annual turnover from 18 % to 15%. Better screening of the employees during the interview. 19.00% 18.00% 17.00% 16.00% 16.00% Target is not achieved though progress is made Employee satisfaction Participation in major decisions of the company Increase of the employee satisfaction index from 25% to 36%. Increased interaction of the employees and the management and encouraging the employees to participate more and more. 25 29 31 34 36 Target achieved. Employee productivity Increase in the training budget per employee Upon each employee the budgeted cost of training to be increased from $3000 to $5000. Introducing frequent employee training program. . 3000 3750 4500 5500 5500 Target achieved. 4.4 Internal processes perspective Internal Process Metrics                   Internal Objective Type Measures Targets Supporting Initiatives Q1 Q2 Q3 Q4 Annual Analysis Innovation Revenue generated from the sale of new products and services as percentage of whole sales revenue 5% of revenues will come from new products. New markets team will drive sales of new products through indirect channel. 1.00% 2.00% 4.00% 5.00% 5.00% Target achieved Operations Efficiency of machines Increasing the production capacity of the machines by 50% 34%  43%  54%  55%  50%  Target achieved  Post-sales service Costs incurred in warranty and repair Reducing the cost of repairs and maintenance by 25%. 13%  17%  21%  24%  24%   Target achieved 5.0 Balance of balanced scorecard The balance score card is just a method of understanding the way the various perspectives are linked together. It does not necessarily convey a cause and effect relationships between the various kinds of perspectives (Neely et al. 2005). Moreover the balance score card presented here is a way to understand which objectives have been met and which objectives are not met. This way it can be assessed if the company is going in the right track towards the fulfilment of its mission. 6.0 Strategy map (ping) Fig 2: Strategy map Financial Perspective Improved return on investment Increases market share Increased sales revenue Increase the market performance Internal Process Perspective 5% of revenues will come from the reduced wastage of raw materials due to increased employee efficiency and satisfaction Increasing the production capacity of the machines by 50%, due to increase in the work force base due to improved retention strategy. Reducing the cost of repairs and maintenance by 25% due to correct handling and better handling of machines due to improved training programmes, which further on leads to improved product and service quality. Learning process perspective Reduction of the percentage of annual turnover from 18% to 15%. Increase of the employee satisfaction index from 25% to 36%. Upon each employee the budgeted cost of training to be increased from $3000 to $5000. 7.0 Links within each perspective The ultimate aim is to improve the stakeholder satisfaction, since improved stakeholder satisfaction means the investors will be more willing to invest in Chevron. In order to improve the stakeholder satisfaction, the learning processes of the employees are improved. Improved learning process includes, reduced turnover expenses, increases employee retention and improvement of the overall employee satisfaction (Robert and David, 2004). The improved customer retention rate and improved customer satisfaction improves the work efficiency of the employees. Other than that the knowledge base of the employees are also improved. Improved efficiency of the employees is reflected in the improvement of internal processes. Improved internal processes lead to reduced loss of resources. The same resources when utilised will lead to addition of 5% of revenue. Improved internal processes also ensure that the maintenance cost and repairing cost of the machines are reduced (Rucci et al. 2008). With increased employee efficiency, the need to perform regular maintenance and repairing is reduced and wastage production is decreased and the production capacity of the various units increases rapidly. The improvement in the internal process leads to improved quality control of the product. The improvements in the quality of product and after sales service result in improved customer satisfaction (Martinsons and Davison, 2012). Improvement in the customer satisfaction is also evident from the fact that large numbers of customers are buying products, increased numbers of customers are retained and increased customer loyalty (Veen-Dirks and Wijn, 2006). The increased customer loyalty and customer satisfaction are also evident from the fact that larger numbers of customers are buying the products leading to increased generation of revenue (Veen-Dirks and Wijn, 2006). The increased revenue leads to improved ability to meet investor demands, improved rate of return. The other benefits are improved brand equity and improvement in the corporate image. 8.0 Links with respect to particular company Chevron perseveres to stand out as one of the pioneering global energy companies where achieving operational excellence is one of the foremost objectives of all functional units and department. Achieving an accident and injury free workplace is one of the foremost tasks and for this Chevron invests significantly in employee training and re-training which contains dedicated programme and modules on safety precautions (Malmi, 2000). This is indicated in the learning and growth perspective. It operates with the highest quality control and waste management programme. The waste management programme of Chevron has received accreditations from some of the leading Green Peace organisations. This is indicated in the operational perspective as operational excellence. It currently holds fourth positions among the competitors like BP, Exxon Mobil, Total SA (Neely et al. 2005). While others like Concon Phillips, Enil Spa have lower ranking. The strong market position is evident from the increased customer satisfaction and subsequent increase in rate of return on investment as evident in the customer perspective and financial perspective respectively. 9.0 Recommendations The recommendations are made with respect to the perspectives where Chevron failed to meet its objectives. In case of customer perspective, the customer acquisition can be improved if the rebates and discounts are made customer specific instead of product specific. All types of customer may not want to avail same rebate and same discounts it also depends upon the psychographic profile of the customer. In financial perspectives the assets utilization can be improved if the asset are maintained regularly in order to improve the life cycle of the assts. That way Chevron also does not have to resort to invest frequently in new machineries, thus reducing the expense significantly. In learning and growth perspective, Chevron could not achieve its targeted level of employee attrition of 18% to 15%, though this target could not be achieved. Improved employee screening at the recruitment and selection phase can help to point out the employees who are likely going to leave the job. 10.0 Balanced scorecard a critical analysis Balance score card has been used as a strategic management tool by the companies for the past few years. The balance score card contains the outcome of the measures and the performance drivers that produces the distinct and specific outcomes. The performance drivers and the performance outcomes are linked together in a cause and effect relationship. The relationship between the performance drivers and performance outcome can also be depicted as control system which is feed forward in nature (Hannah, 2000). The balance score card is used not only as a strategic measurement system but also used as strategic control system. Despite the fact that the balance score card has immense practical application in the field of strategic management as well as strategic control system, the cause and effect relationship between the performance drivers and the performance outcomes are put under severe criticism. The neo classical economic does not agree with the cause and effect relationship as assumed in balance score card. Under the neo classical theory of economics the relationship between the financial results and customer satisfaction is a logical relationship and not a direct cause and effect relationship as assumed in balance score card (Argyris, C., 2007). Apart from this there is another shortcoming that is the balance score card assumes the flow of cause and effect is unidirectional. Better training leads to better operational management, leading to better customer satisfaction, which finally results in increased revenue. In the first place it must be mentioned that better training comes at an increased cost, which dependents upon adequate funding. So balance score card can be at best used as a holistic strategic management tool but its applicability in tackling real life issues is limited. 11.0 Limitations of balanced scorecard First of all there is no causal relationship between the various perspectives rather there is presence of only logical relationship. The causal relationship defines the presence of a cause and effect relationship between the perspectives. For example it is logical to think that the rate of return will improve with improved sales revenue. Although it cannot be said for sure if at all the improved rate of return is the direct result of improved sales revenue. So it is not right to assume that there is a definite cause and effect relationship between sales revenue and rate of return (Kaplan and Norton, 2009). The balanced score card sometimes makes invalid assumptions into the cause and effect relationship of the different perspectives. Apart from this limitation, there is another type of limitation, which is balanced score card is not a valid strategic management tool. It is because of the reason that there is no organisational rooting as well as environmental rooting. This evidently points to the presence of gap between the strategy planned and the strategy undertaken. 12.0 Conclusion The balanced score card and strategy map of Chevron indicates that the lower order perspectives like the learning and growth perspectives and internal process perspectives are quite successful in meeting the objectives. There are two objectives in the financial perspectives that could not be met. Otherwise the balance score card indicates that Chevron is quite successful in meeting its yearly targets. The strategy map links the various objectives in each and every perspective with its precedent and subsequent perspective. The strategy indicates that despite elaborate plan to increase the employee satisfaction and customer satisfaction Chevron could not achieve its targeted return on investment. The poor performance in financial perspective can be attributed to different reasons, although in the present context, it cannot be know for sure for which particular strategy Chevron failed to achieve its return on investment. The balance score card at best presents a holistic view of the strategic measurements taken by Chevron but it does not imply a normal cause and effect relationship as in neo classical economics. The dismal financial performance can be attributed to poor customer satisfaction. Reference Anthony, R. N., Dearden, J. and Bedford, N. M., 2011. Management control systems. Journal of strategic management, 2(9), p.145. Argyris, C., 2007. Organizational learning and management information systems. Accounting, organizations and society, 11(3), p. 123. Forza, C. and Salvador, F., 2001. Information Flows for High-Performance Manufacturing. International journal of production economics, 7(1), p. 21. Hannah N., 2000. The balance on the balanced scorecard - a critical analysis of some of its assumptions. Management accounting research, 11(1), p. 65-88. Kaplan, R. S. and Norton, D. P., 2009. Transforming the balanced scorecard from performance measurement to strategic management: Part II. Accounting horizons, 14(7), p.160. Malmi, T., 2000. Balanced scorecards in Finnish companies: A research note. Management accounting research, 12(2), p. 207. Martinsons, M. R. and Davison, D., 2012. The balanced scorecard: A foundation for the strategic management of information systems. Decision support systems, 2(5), p. 71.  Neely A., Gregory M. and Platts K., 2005. Performance measurement system design, A literature review and research agenda. International journal of operations & production management, 15(4), p. 80. Reilly, G. P. and R. R. Reilly., 2010. Using a measure network to understand and deliver value. Journal of cost management, 21(2), p. 5. Robert, S. K. and David, P. N., 2004. Having trouble with your strategy? Then map it. Harvard business review, 78(5), p. 167. Rucci, A. J., Kirn, S. P. and R. T. Quinn., 2008. The employee-customer-profit chain at Sears. Harvard business review, 8(2), p. 97. Veen-Dirks, P. and Wijn, M., 2006. Strategic control: meshing critical success factors with the balanced scorecard. Long range planning, 35(4), p. 407. Read More
Cite this document
  • APA
  • MLA
  • CHICAGO
(“BALANCE SCORE AND STRATGEY MAP ANALYSIS OF CHEVRON Essay”, n.d.)
Retrieved from https://studentshare.org/finance-accounting/1480723-balance-score-and-stratgey-map-analysis-of-chevron
(BALANCE SCORE AND STRATGEY MAP ANALYSIS OF CHEVRON Essay)
https://studentshare.org/finance-accounting/1480723-balance-score-and-stratgey-map-analysis-of-chevron.
“BALANCE SCORE AND STRATGEY MAP ANALYSIS OF CHEVRON Essay”, n.d. https://studentshare.org/finance-accounting/1480723-balance-score-and-stratgey-map-analysis-of-chevron.
  • Cited: 0 times

CHECK THESE SAMPLES OF Balance Score and Strategy Map Analysis of Chevron

Managing Organisations in a Global Context. Chevron Corporation

The report analyses the structure, organizational culture and leadership of chevron to study its internal capabilities.... The principles of “The Chevron Way” that acts as a learning tool to communicate and reinforce the values and goals of chevron is a key artifact for its team and learning-based organization culture.... This report addresses the above factors in case of chevron Corporation, and... chevron Corporation.... This report studies and analyses chevron Corporation's preparedness and response to the changing external environment, driven by forces of globalization and emergence of knowledge-based economy....
14 Pages (3500 words) Essay

Marketing Strategy of Gucci

The paper "Marketing strategy of Gucci" highlights that generally, the seven P's of marketing include pricing, product, promotion, packaging, place, and position of the business.... nder the Ansoff mix, marketing development is also a strategy that involves seeking new markets for an existing product.... This is a marketing strategy of exploiting totally new markets without prior experience or knowledge of the market.... ince Gucci might have limited their market in terms of size, the company should consider increasing the market size for the product whose sales volume is on the decline so as to ensure a balance....
8 Pages (2000 words) Essay

Operations Management of BP Plc

The paper "Operations Management of BP Plc" describes that BP is one of the leading oil industry players.... In the recent past, the company has reinvented itself with an aim of increasing revenues and overcoming the emerging threats in the oil industry.... ... ... ... Substitute' threat is high when buyers consider substituting products or services especially due to the price performance of the substitutes....
9 Pages (2250 words) Essay

Understanding the Utility of the Balance Score Card in an Organization

Balance Score Card and strategy map Executive Summary The study has been prepared for understanding the utility and functioning of the balance score card in an organization.... Finally the study will be concluding with a critical analysis of the balance score card and the limitations of the balance score card.... The balance score card is a strategic management tool which helps in evaluating the performances related to the financial as well as non financial factors, used extensively in many industries, businesses and other non profit seeking organization....
12 Pages (3000 words) Coursework

Developing the Strategy: Key Elements of Performance Management System

This required an analysis of the external and internal environment of Virgin Trains.... The external analysis has been carried out using the theoretical frameworks of PESTEL and Porter's Five Forces.... The internal analysis takes into consideration the availability of resources and the core competencies of the company.... This analysis has helped in addressing the strategic issues faced by the organization.... This assignment "Developing the strategy: Key Elements of Performance Management System" presents Virgin Trains Company that is a UK-based railway organization....
18 Pages (4500 words) Assignment

Marketing Analysis of Vivienne Westwood

This paper "Marketing analysis of Vivienne Westwood " outlines one of the famous high-end fashion brands known as Vivienne Westwood.... analysis in the paper has been divided into three major parts such as external and internal analysis and competitive position.... The internal analysis comprises of strengths and weaknesses of the brand along with its resources and competencies.... The external analysis encompasses industry analysis as well as prevalent opportunities and threats....
12 Pages (3000 words) Case Study

The Gorgon Gas Project

The main question that this analysis seeks to answer is whether the media depiction of Gorgon's environmental effect has been such that it had led the public to believe that chevron Australia is not engaging in adequate sustainability efforts.... The reason that this question has been chosen is that chevron believes in forming lasting relationships with the Australian public and the company understands the importance of forming a positive image upon the minds of the people whose life the company's many business endeavors touch....
8 Pages (2000 words) Report

Concept of Glocalization and Its Relation to the Standardization-Adaptation Debate

Based on the literature review presented in the first part of the report there will be presented analysis and discussion of the extent to which two successful global companies operating in the food retail industry: McDonald's and Starbucks use a 'glocal strategy.... he term and definition of 'global strategy' have many different interpretations, which greatly vary in terms of the context applied.... Very often, the term is used with reference to the global strategy approach, whereas companies are referred to as either international or multinational....
11 Pages (2750 words) Assignment
sponsored ads
We use cookies to create the best experience for you. Keep on browsing if you are OK with that, or find out how to manage cookies.
Contact Us