StudentShare
Contact Us
Sign In / Sign Up for FREE
Search
Go to advanced search...
Free

Financial Analysis: Margate plc - Case Study Example

Cite this document
Summary
"Financial Analysis: Margate plc" paper presents an analysis of Margate plc’s financial performance in the past five years while comparing it with industry peer, Herne Bay Ltd. The report also presents an analysis of the cash flows of the company during the past 2 years…
Download full paper File format: .doc, available for editing
GRAB THE BEST PAPER95.9% of users find it useful
Financial Analysis: Margate plc
Read Text Preview

Extract of sample "Financial Analysis: Margate plc"

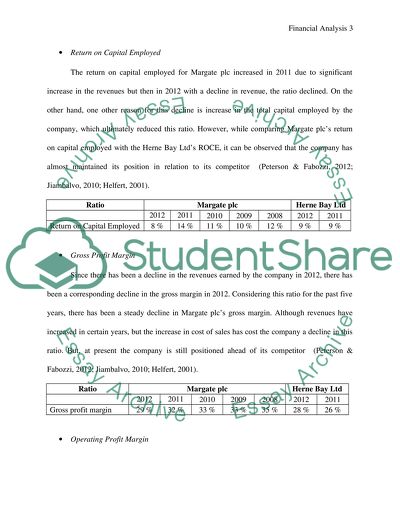
? Financial Analysis – Margate plc Financial Analysis – Margate plc Introduction Margate plc operates in the leisure industry in the South-East of England. The company has expanded rapidly in recent years mainly by the acquisition of other businesses. The wet weather in the summer of 2012 has affected sales. High Dean plc is considering making a substantial, long-term investment in Margate plc. High Dean plc operates across Europe in the leisure and hospitality industries. They are in a strong financial position with cash available to invest. This report presents an analysis of Margate plc’s financial performance in the past five years while comparing it with industry peer, Herne Bay Ltd. In addition to this, the report also presents an analysis of cash flows of the company during the past 2 years and at the same time states how financial ratio analysis may not be effective enough for presenting an accurate and useful financial analysis for analysts and investors. At the end of the report, conclusion and recommendations are presented for High Deen plc as far as investment in Margate plc is concerned. Financial Ratio Analysis Based on the information provided in relation to the financial performance of Margate plc in 2012 and 2011, following is an analysis of it performance through selected financial ratios. The financial ratios presented below also take into consideration the ratios determined for the company for the financial years 2010, 2009 and 2008. In addition to this, for conducting a comparative analysis of the company with its competitor, ratios for Herne Bay Ltd have also been determined for the years 2012 and 2011. Return on Capital Employed The return on capital employed for Margate plc increased in 2011 due to significant increase in the revenues but then in 2012 with a decline in revenue, the ratio declined. On the other hand, one other reason for this decline is increase in the total capital employed by the company, which ultimately reduced this ratio. However, while comparing Margate plc’s return on capital employed with the Herne Bay Ltd’s ROCE, it can be observed that the company has almost maintained its position in relation to its competitor (Peterson & Fabozzi, 2012; Jiambalvo, 2010; Helfert, 2001). Ratio Margate plc Herne Bay Ltd   2012 2011 2010 2009 2008 2012 2011 Return on Capital Employed 8 % 14 % 11 % 10 % 12 % 9 % 9 % Gross Profit Margin Since there has been a decline in the revenues earned by the company in 2012, there has been a corresponding decline in the gross margin in 2012. Considering this ratio for the past five years, there has been a steady decline in Margate plc’s gross margin. Although revenues have increased in certain years, but the increase in cost of sales has cost the company a decline in this ratio. But, at present the company is still positioned ahead of its competitor (Peterson & Fabozzi, 2012; Jiambalvo, 2010; Helfert, 2001). Ratio Margate plc Herne Bay Ltd   2012 2011 2010 2009 2008 2012 2011 Gross profit margin 29 % 32 % 33 % 33 % 35 % 28 % 26 % Operating Profit Margin The operating profit margin of the company has been improving since 2008 till 2011. However, the ratio declined in 2012, due to decrease in the revenues earned by the company. Ratio Margate plc Herne Bay Ltd   2012 2011 2010 2009 2008 2012 2011 Operating profit margin 10 % 14 % 12 % 11 % 11 % 9 % 9 % Although, operating margin has declined in 2012 for Margate plc but the company is still ahead of its competitor in this regard (Peterson & Fabozzi, 2012; Jiambalvo, 2010; Helfert, 2001). Inventory Days There is no significant increase is the number of days it takes for Margate plc to sell its inventories. In fact, there have been slight variations noted in this respect over the period of past five years. However, the company has remained highly efficient in this respect when compared against Herne Bay Ltd’s inventory days (Peterson & Fabozzi, 2012; Jiambalvo, 2010; Helfert, 2001). Ratio Margate plc Herne Bay Ltd   2012 2011 2010 2009 2008 2012 2011 Inventory days 8 days 7 days 10 days 9 days 11 days 28 days 25 days Trade Receivable Days There has been an increasing trend noted in trade receivable days for the company since 2008 and the same has not been controlled in 2012. At present it takes 20 days for the company to recover amounts owed to it by customers, whereas Herne Bay Ltd requires 18 days. Although it may not be a signal of inefficiency when compared to the number of days in which Margate plc settles payments it owes to third parties, but it shall remain stable or consistent (Peterson & Fabozzi, 2012; Jiambalvo, 2010; Helfert, 2001). Ratio Margate plc Herne Bay Ltd   2012 2011 2010 2009 2008 2012 2011 Trade receivables days 20 days 15 days 13 days 12 days 12 days 18 days 14 days Trade Payable Days There has been a continuous increase in the number of days in which Margate plc settles payments with its creditors, which is a good sign for investors. The increase has been marginal from 2008 to 2011, but in the last year the company managed to raise trade payable days to 65 days from 45 days. Ratio Margate plc Herne Bay Ltd   2012 2011 2010 2009 2008 2012 2011 Trade payable days 65 days 45 days 43 days 38 days 36 days 43days 38 days In this ratio too, Margate plc has a substantial advantage over its competitor (Peterson & Fabozzi, 2012; Jiambalvo, 2010; Helfert, 2001). Current Ratio As far as liquidity position of Margate plc is concerned, it can be observed that it is on a declining side since 2008. Whereas, Margate’s competitor, Herne Bay Ltd, has been able to improve its current ratio in the past two years. The main reason behind decline in current ratio for Margate plc is that the company has not been consistent with its current liabilities. There are overdrafts in its current liabilities in 2012 and significant fluctuations have been noted in other items under current liabilities and assets (Peterson & Fabozzi, 2012; Jiambalvo, 2010; Helfert, 2001). Ratio Margate plc Herne Bay Ltd   2012 2011 2010 2009 2008 2012 2011 Current ratio 0.5 : 1 0.6 : 1 0.7 : 1 0.8 : 1 0.8 : 1 1.4 : 1 1.1 : 1 Acid Test Ratio Similar to current ratio, the acid test ratio for Margate plc signifies no different story. There has been a declining trend noted in quick ratio of the company in the past five years due to the same reasons which have been noted earlier in current ratio’s section (Peterson & Fabozzi, 2012; Jiambalvo, 2010; Helfert, 2001). Ratio Margate plc Herne Bay Ltd   2012 2011 2010 2009 2008 2012 2011 Acid test ratio 0.3 : 1 0.4 : 1 0.4 : 1 0.6 : 1 0.7 : 1 1.1 : 1 0.8 : 1 Gearing Ratio The gearing ratio of the company has climbed up in the last two financial years quite significantly. The prime reason behind this is increased preference in raising finance through borrowing rather than equity option (Peterson & Fabozzi, 2012; Jiambalvo, 2010; Helfert, 2001). Ratio Margate plc Herne Bay Ltd   2012 2011 2010 2009 2008 2012 2011 Gearing 172 % 147 % 60 % 57 % 46 % 30 % 25 % Although, gearing level for Margate plc has been increasing steadily from 2008 to 2010, but with significant increase in long term borrowings by the company in 2011 and 2012, it has put question marks on solvency position of the business. The gearing level maintained by Margate plc present an opposite view when compared against its competitor Herne Bay Ltd (Peterson & Fabozzi, 2012; Jiambalvo, 2010; Helfert, 2001). Interpretation of Cash Flow Statement Following is the cash flow statement of Margate plc for the year ended 31 October 2012, which shows the inflows and outflows of cash with respect to three types of activities, i.e. operating, investing and financial activities. Statement of cash flows for the year ended 31 Oct 12   ?’000 ?’000 Cash flows from operating activities   Profit before tax 40,600 Adjustments for:   Depreciation 180,000   Interest expense 42,400 222,400   263,000 (Increase) in inventories -1,400   (Increase) in receivables -8,900   Increase in payables 30,400 20,100 Cash generated from operations 283,100 Interest paid -42,400 Income taxes paid -25,300 Net cash flow from operating activities 215,400     Cash flows from investing activities   Purchase of intangible assets -50,000   Purchase of property, plant and equipment -308,500   Net cash flow from investing activities -358,500     Cash flows from financing activities   Increase in bank loans 125,100   Dividends paid -6,000   Net cash flow from financing activities 119,100     Net increase / (decrease) in cash and cash equivalents -24,000 Cash and cash equivalents b/fwd 6,000 Cash and cash equivalents c/fwd   -18,000 As can be observed in the statement above, there are positive net cash flows from operating activities of the company. There is a significant amount of cash generated by the operating activities of the company in 2012, thus indicating a healthy sign as far as efficiency of operational activities is concerned. Amongst all outflow items in operating activities, depreciation is the most significant item which amounted to ? 180,000,000. On the other hand, net cash flows from investing activities came out to be negative due to significant amount of capital expenditures incurred by the company in 2012 (Purchase of property, plant and equipment: ? 308,000,000, Purchase of Intangible Assets: ? 50,000,000). Due to these significant capital expenditures, there has been a net cash outflow from investing activities, which is even greater than the net cash inflows from operating activities. Lastly, the company managed to report a net cash inflow from financing activities due to the borrowing it made in 2012 amounting to ? 125,100,000. However, the combined net cash inflows from operating and financing activities have been insufficient to set off the negative balance of net cash flow from investing activities, thus resulting in an overall cash outflow figure of ? 18,000,000, after adjusting for cash at hand (Peterson & Fabozzi, 2012; Jiambalvo, 2010; Helfert, 2001; Horngren & Harrison, 2009; Needles & Powers, 2010). Limitations of Ratio Analysis Although ration analysis is a helpful tool in evaluating a company’s operations, but at the same time it has certain limitations associated with it. These limitations are discussed as under: The first and foremost limitation associated with ratio analysis is that one cannot predict what will be the financial position of the company in future. This is due to the fact that ratio analysis is carried out while considering historical financial information which reflects performance, position and trends of past (Peterson & Fabozzi, 2012). Another limitation is that a company’s financial position cannot be always compared against industry averages. The reason being that a company may be operating in conditions which are significantly different from the circumstances faced by other competing companies. This limitation is such that investors may at times develop uncertainty as to whether financial performance of a company under consideration shall be compared against competitors or not. Moreover, the differences in comparison of two or more companies may also arise due to the fact that different companies use different accounting frameworks and policies (Peterson & Fabozzi, 2012). Moreover, investors may also find ratio analysis less useful when the analysis is not carried out in conjunction with the underlying financial information of the company under consideration (Peterson & Fabozzi, 2012; Horngren & Harrison, 2009; Albrecht et al., 2008). Conclusion and Recommendations From the analysis presented above, which includes financial ratio analysis and cash flow statement analysis, it has been concluded that the company’s profitability position is favorable for investors, but liquidity and solvency position of the company shows concern for potential investors. In addition to this, the efficiency in which the business of the company is conducted is favorable from investors’ point of view. As far as the cash flows of the company are concerned, it has been noted that operating and financing activities of the company signify a healthy sign as far as company’s liquidity position is concerned, but at the same time, due to increased capital expenditure, investing activities pose an unfavorable scenario for the company and for potential investors. Based on these conclusions, following are the recommendations for High Dean plc: The company has shown consistency as far as its profitability is concerned and therefore this signifies a factor which can be considered while deciding whether to invest in the company or not. However, increase in long term debts signify that the solvency position of the company is not good, which can deteriorate further, given the cash flow position of the company. On the other hand, investment in Margate plc appears to be a good one when management efficiency is taken into account. Reference List Albrecht, W.S., Stice, E.K. & Stice, J.D., 2008. Financial Accounting: Cocnepts and Applications. Mason: CENGAGE Learning. Helfert, E.A., 2001. Financial Analysis Tools and Techniques: A Guide for Managers. New York: McGraw-Hill. Horngren, C.T. & Harrison, W.T., 2009. Accounting. Upper Saddle River, NJ: Prentice Hall. Jiambalvo, J., 2010. Managerial Accounting. Hoboken: John Wiley & Sons, Inc. Needles, B.E. & Powers, M., 2010. Financial Accounting. Mason: Cengage Learning. Peterson, P.P. & Fabozzi, F.J., 2012. Analysis of Financial Statements. John Wiley & Sons, Inc.: New York. Appendix – I Ratio Analysis Ratio Margate plc Herne Bay Ltd   2012 2011 2010 2009 2008 2012 2011 ROCE 8% 14% 11% 10% 12% 9% 9% Gross profit margin 29% 32% 33% 33% 35% 28% 26% Operating profit margin 10% 14% 12% 11% 11% 9% 9% Inventory days 8 days 7 days 10 days 9 days 11 days 28 days 25 days Trade receivables days 20 days 15 days 13 days 12 days 12 days 18 days 14 days Trade payable days 65 days 45 days 43 days 38 days 36 days 43days 38 days Current ratio 0.5:1 0.6:1 0.7:1 0.8:1 0.8:1 1.4:1 1.1:1 Acid test ratio 0.3:1 0.4:1 0.4:1 0.6:1 0.7:1 1.1:1 0.8:1 Gearing 172% 147% 60% 57% 46% 30% 25% ROCE Operating Profit / Capital Employed Gross profit margin Gross Profit / Revenue Operating profit margin Operating Profit / Revenue Inventory days 365 / (Revenue / Inventory) Trade receivables days 365 / (Revenue / Trade Receivables) Trade payable days 365 / (Cost of Sales / Trade Payables) Current ratio Current Assets / Current Liabilities Acid test ratio (Current Assets - Inventory) / Current Liabilities Gearing Total Debt / Total Equity Read More
Cite this document
  • APA
  • MLA
  • CHICAGO
(“Analysis of Accounts Case Study Example | Topics and Well Written Essays - 2000 words”, n.d.)
Analysis of Accounts Case Study Example | Topics and Well Written Essays - 2000 words. Retrieved from https://studentshare.org/finance-accounting/1466929-analysis-of-accounts
(Analysis of Accounts Case Study Example | Topics and Well Written Essays - 2000 Words)
Analysis of Accounts Case Study Example | Topics and Well Written Essays - 2000 Words. https://studentshare.org/finance-accounting/1466929-analysis-of-accounts.
“Analysis of Accounts Case Study Example | Topics and Well Written Essays - 2000 Words”, n.d. https://studentshare.org/finance-accounting/1466929-analysis-of-accounts.
  • Cited: 0 times

CHECK THESE SAMPLES OF Financial Analysis: Margate plc

Financial Reporting Analysis: French Connection Group Plc

The paper "Financial Reporting Analysis: French Connection Group plc" discusses that the latest press releases about the French Connection group only bring good news.... French Connection Group plc specializes in fashion clothing and accessories for men, women and children as well.... The French Connection plc Board of Directors is made up of 3 executive Directors and 2 non-executive ones.... The Annual Report of French Connection Group plc outlines many duties of the Audit Committee....
10 Pages (2500 words) Essay

Analysis of Witan Pacific Investment Trust Plc- Fund Management

This project aims to provide an analysis of Witan Pacific, in terms of objectives, structure, operations, investment portfolio, investment performance and management of the fund by Aberdeen Asset Managers and Nomura Asset Management.... The company does not use foreign currency hedging instruments but regularly report the sensitivity analysis of each foreign currency exposure....
12 Pages (3000 words) Essay

Financial Management

This assignment "financial Management" shows that the researchers analyzed the current, forecasted, and budgeted performance of Synovate FZ-LLC.... High emphasis had been laid on studying the annual statements of the company, e-journals, financial books, and magazines.... Organizational Background Industry Background The market research industry has grown globally into several areas and sectors including financial research, business research, and marketing research....
15 Pages (3750 words) Assignment

Finance of The Company Maritsa Plc

This case study describes the finance of the company Maritsa plc.... It is also assumed that Maritsa plc will be depreciating its building using the straight-line method.... This paper demonstrates the cost of capital using the CAPM, the computation of NPV, investments, and shortcomings of the Capital Asset Pricing Model....
8 Pages (2000 words) Case Study

Maritsa Plcs Using the Capital Asset Pricing Model

An essay "Maritsa plc's Using the Capital Asset Pricing Model" reports that the method of capital budgeting is widely used because of its recognition of the time value of money.... Annual cash flows will be discounted order to arrive at their present values.... ... .... ... ... The capital asset pricing model (CAPM) is one of the most popular tools in finance which is used to determine a theoretically required rate of return of an asset, if that asset is added to an already well-diversified portfolio, given the asset's non-diversifiable risk....
7 Pages (1750 words) Essay

Advanced Financial Accounting - Economica Plc

The paper "Advanced Financial Accounting - Economica plc " states that accountants have only fixed ideas or approach of past and present figures and this actually jeopardize reporting through the financial statements.... The review and analysis of financial performance and position of Economica plc have been made in this report using ratio analysis technique in two parts.... Jointly considered, the gross and net profit margin ratios provide a valuable understanding of the cost and profit structure of Economica plc and enable to identify the source of the company's business efficiency....
12 Pages (3000 words) Essay

Financial Analysis for Margate Plc

The paper 'Financial Analysis for margate plc' is a detailed example of a finance & accounting report.... margate plc operates in the leisure industry in the South-East of England.... The paper 'Financial Analysis for margate plc' is a detailed example of a finance & accounting report.... margate plc operates in the leisure industry in the South-East of England.... High Dean plc is considering making a substantial, long-term investment in margate plc....
11 Pages (2750 words)

Financial Reporting and Analysis: AstraZeneca Company

The paper "Financial Reporting and analysis: AstraZeneca Company" is a perfect example of a case study on finance and accounting.... The paper "Financial Reporting and analysis: AstraZeneca Company" is a perfect example of a case study on finance and accounting.... The paper "Financial Reporting and analysis: AstraZeneca Company" is a perfect example of a case study on finance and accounting.... Ostensibly, the stock market facilitates the growth of an organization's diversification and expansion agenda that requires large financial muscles that the investor provides....
6 Pages (1500 words) Case Study
sponsored ads
We use cookies to create the best experience for you. Keep on browsing if you are OK with that, or find out how to manage cookies.
Contact Us