StudentShare
Contact Us
Sign In / Sign Up for FREE
Search
Go to advanced search...
Free

The Growth of Wall-Mart Stores - Essay Example

Cite this document
Summary
The paper "The Growth of Wall-Mart Stores " discusses that Walmart has improved from 2009 but the growth is sluggish. Wall-Mart needs to improve its profitability and work immensely to improve its market share. The share prices have been steady over the three years at $53…
Download full paper File format: .doc, available for editing
GRAB THE BEST PAPER98.4% of users find it useful
The Growth of Wall-Mart Stores
Read Text Preview

Extract of sample "The Growth of Wall-Mart Stores"

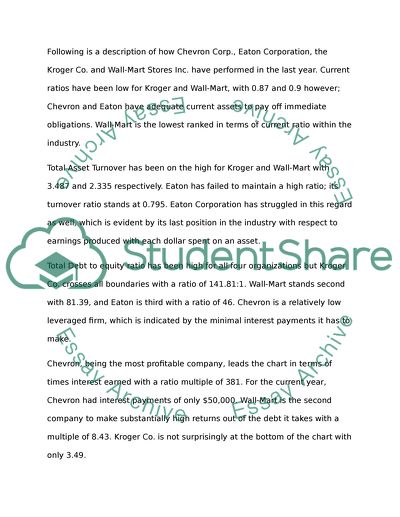
?Ratio Formula Chevron Corp. (CVX) Eaton Corporation (ETN) The Kroger Co. (KR) Wall-Mart Stores Inc. (WMT) Current Ratio 53 74 0.87 0.9 Total Asset Turnover 1.08 0.795 3.497 2.335 Times Interest Earned 381.48 7.83 3.49 8.43 Total Debt-Equity 9.89 46.01 141.81 81.39 Return on Sales 9.55% 6.77% 1.38% 3.885% Return on Asset 10.94% 5.46% 6.29% 8.91% Return on Equity 21.33% 15.9% 22.87% 23.44% P/E Ratio(trailing) 8.53 12.17 12.64 11.26 Market to Book Value Ratio 1.69 1.74 2.69 2.76 *Note= mrq = Most Recent Quarter (as of Apr 30, 2011)  trailing = Trailing Twelve Months (as of Apr 30, 2011) Following is a description of how Chevron Corp., Eaton Corporation, the Kroger Co. and Wall-Mart Stores Inc. have performed in the last year. Current ratios have been low for Kroger and Wall-Mart, with 0.87 and 0.9 however; Chevron and Eaton have adequate current assets to pay off immediate obligations. Wall-Mart is the lowest ranked in terms of current ratio within the industry. Total Asset Turnover has been on the high for Kroger and Wall-Mart with 3.487 and 2.335 respectively. Eaton has failed to maintain a high ratio; its turnover ratio stands at 0.795. Eaton Corporation has struggled in this regard as well, which is evident by its last position in the industry with respect to earnings produced with each dollar spent on an asset. Total Debt to equity ratio has been high for all four organizations but Kroger Co. crosses all boundaries with a ratio of 141.81:1. Wall-Mart stands second with 81.39, and Eaton is third with a ratio of 46. Chevron is a relatively low leveraged firm, which is indicated by the minimal interest payments it has to make. Chevron, being the most profitable company, leads the chart in terms of times interest earned with a ratio multiple of 381. For the current year, Chevron had interest payments of only $50,000. Wall-Mart is the second company to make substantially high returns out of the debt it takes with a multiple of 8.43. Kroger Co. is not surprisingly at the bottom of the chart with only 3.49. Return on Sales/Net profit margin has been impressive for Chevron with 9.55%. Eaton Co. also practices a higher return on the sale with 6.77%. The Kroger Co. again is at the bottom of the chart with 1.38% return on Sales. Return on Assets is the earnings made with each dollar spent on an asset. With the highest net income Chevron Co. again tops the list with a return of 10.94%. Wall-Mart takes the second spot with 8.91% and Eaton Co. being the last of the four with 5.46%. Moreover, the return earned on every dollar of equity is the highest for Wall-Mart. This means that Wall-Mart provides the highest return to a shareholder, which is the objective of a corporation. Kroger Co. takes the second spot with 22.87%. In addition to it, Chevron has an equity centric structure hence it takes the third spot out of the four with 21.33% while Eaton creates the lowest return for their shareholders with a return of 15.9% rests at the bottom. By comparing P/E ratio, one can analyze the market’s stock evaluation for a company. P/E is directly proportional to forecasted earnings hence a rise in P/E is a resultant of increased expectation for earnings (Besley and Brigham, 2000). The Kroger Co. tops the list with a P/E multiple of 12.64. It could be inferred that investors expect higher returns in the future for Kroger Co. Eaton Corporation follows with 12.17 and Chevron being the last with 8.53. Lastly, Market to Book Value ratio is used to compare company’s market worth to its book value. It gives an idea of whether an investor is paying adequate money for his investment or more (Levinson 2006). It is calculated by the company’s market capitalization divided by the value in company’s books. Wall-Mart tops the list with 2.76, followed by Kroger Co. with 2.69 and Chevron taking the last position. 1. Chevron is an oil and gas manufacturing and exploration company, Eaton Co. is a transport/truck manufacturer, whereas Kroger Co. and Wall-Mart are in the retail industry. I would rank Chevron as the leader of the four, followed by Eaton Corp. Kroger has performed better in comparison to Wall-Mart hence third spot rests with it and last place to Wall-Mart. The ranking is based on the above given ratios. Chevron Co. has performed extremely well in the last year and produced better than expected results for their shareholders. The net profit margin is the highest of the four, and growth has been steady, putting it in the top league of oil and gas companies. Eaton Corp. has been performing well consistently. It gained back its position after the 2009 fall due to recession and inflated input prices, making it suitable for the second spot. Wall-Mart and Kroger Co. works on volumes and an extremely low profit margin which lowers overall profitability in relation to the effort put in for it. There is not a significant difference in both the company’s operation yet Kroger adds more to shareholder’s wealth and utilizes its resources effectively to take the third place followed by Wall-Mart. 2. Financial performances differ due to the nature of the industry and factors affecting it. Oil and gas manufacturers have high risk considering the investment they have to make to get oil from the ground. And once, they discover reserves, earnings are expected to surge up. Eaton Co. depends heavily on their input cost. Considering the advancement and growing dependency on technology, Eaton has grown at a fair pace. Their focus is on delivering premium and quality service to their customer. Wall-Mart and Kroger Co. are in the retail industry where the focus is on consumers. They have to reduce their profit margins in order to gain a market share which affects their financial performance drastically. 3. P/E ratios depend on forecasted earnings of the respective company. Oil and gas companies have huge growth potentials considering the demand for their product. As is the case with other companies engaged in the business of exploration and production, Chevron’s results are directly exposed to oil and gas prices, which are inherently volatile and subject to complex market forces. Realized prices could differ significantly from the estimates, affecting the company s revenues, earnings and cash flows. Eaton Co. is highly dependent on their input costs. Steel and copper are their primary inputs and fluctuation in their prices may negatively impact margins. Kroger Co. being a giant in the retail industry is affected by economic downturn and heavy job losses which have transformed the way consumers used to shop. Cash-strapped consumers are now prioritizing their purchases, trading down to cheaper substitute brands and shopping for groceries at low-price. Yet, Kroger has shown better than expected earnings which will help the company portray better position amongst its competitors and lead to higher P/E. Wall-Mart has lower P/E than Kroger Co. because of their low profit margins and limited earnings growth. Although the perceived price in investor’s eye is more than the actual price yet Wall-Mart has failed to surpass Kroger Co. in its race for higher P/E. Wall-Mart Stores Inc. (WMT) Ratio Formula 2008 2009 2010 2009 % inc/dec. from 2008 2010 % inc/dec. from 2008 Current Ratio 0.88 0.86 0.9 (-2.27) 2.27 Total Asset Turnover 2.47 2.39 2.335 (3.23) 5.46 Times Interest Earned 7.13 7.96 8.43 11.6 18.23 Total Debt-Equity 1.47 1.383 1.59 (6.29) 15 Return on Sales 3.31% 3.52% 3.885% 6.3 17.37 Return on Asset 8.19% 8.43% 8.91% 2.93 8.8 Return on Equity 20.5% 20.4% 23.44% (0.48) 14.34 P/E Ratio 15.43 14.66 11.15 (4.99) (25.46) Market to Book Value Ratio 3.17 2.97 2.67 (6.3) (15.77) Note- Values taken are from annual report 2008, 2009 and 2010 to assure consistency. P/E ratio and Market to book ratio are calculated at Jan 31 of 2009, 2010 and 2011. (Wall-Mart Stores Inc. (WMT), 2010) II. Trends have not been impressive for Wall-Mart especially in terms of liquidity. All percentages are calculated by keeping 2008 as the base year. For 2009, its current ratio dropped by 2.27%. Although it is not a significant drop but Wall-Mart is already ranked the lowest in terms of liquidity and this further decrease will add to the pain. However, current asset increased a little more than current liabilities to give a positive 2.27% increase in 2010. For Total Asset Turnover, Wall-Mart has performed relatively well in comparison to the industry. In the year 2009, asset turnover decreased by 3.23% but showed positive increase of 5.46% for 2010. Due to substantial amount of sales, this ratio has always favored Wall-Mart in comparison to its competitors. Total Debt to Equity in 2009 dropped by 6.29%. However, circumstances changed when Wall-Mart took up more debt to give a 15% rise in the debt to equity ratio. Their return on sales or the profit margin has been growing throughout. In 2009, it grew by 6.3% and followed by 17.37% in 2010. It contributed heavily to the recovery of Wall-Mart from 2009. Wall-Mart works high sales volume which means that it has to lower its profit margin to increase market share. Time interest earned is another helpful indicator to judge debt's contribution to company’s earning. It grew by 11.6% in 2009 and further by 18.23% in 2010. This shows that Wall-Mart has used its growing debt effectively and the interest it has to pay is less than the benefit produced. Return on Asset employed is impressive for Wall-Mart. Wall-Mart has used its assets in an efficient manner. Every $100 spent on asset has yielded $9 of income. Its return has grown by 2.93% in 2009. Considering 2009 was not a good year for the industry due to the impact of recession, Wall-Mart’s return on asset still grew by 2.93%. In 2010, the increase was about 8.8% which shows positive signs for future growth of the company. The return provided to its shareholder’s has increased in 2010 by 14.34% which shows the positivity Wall-Mart has given to its shareholders. In 2009, Wall-Mart did not drop much and maintained its ROE to 20.4% compared to 20.5% in 2008. P/E ratio has been declining for Wall-Mart. In 2008, P/E ratio was 15.43 which dropped by 5% to 14.66 and further dropped to 11.15 in the current year. It ranks relatively low in comparison to the industry. Market to Book ratio has also failed impress. Its market capitalization has dropped due to steady market price and declining shares outstanding. It dropped by 6.3% in 2009 and a drop of 15.77% was seen in 2010. 5. Wall-Mart has its retail operations in 14 countries across the globe with total market capitalization of $179.84 billion. Its overall sales have grown by 1.3% from last year. I believe that Wall-Mart will continue to grow so in the upcoming years. The company’s hard cash has grown to $7,907 million in 2010 compared to $7,275 million in 2009. Top five competitors of Wall-Mart Stores Inc. are ‘Wal-Mart De Mexico SAB de CV’ with market capitalization of $543 billion, Target Corp. with $34.9 billion, Costco Wholesale Corporation with market capitalization of 35.56 billion, Controladora Comercial Mexicana with $20.58 billion and Carrefour with $12.51 billion. Yes, it does make sense because Wall-Mart is encompassed in Top Discount, Variety Stores Companies and all the other five companies share the same characteristic as Wall-Mart Stores Inc. Wall-Mart has been steady in certain departments but declined in others. In comparison to the industry leader Wall-Mart De Mexico SAB de CV it has not performed well in terms of P/E ratio. Out of the 21 companies in Top Discount, Variety Stores industry, Wall-Mart is ranked 18th. Revenue growth has not been substantial either. The market leader has a revenue growth of 23.7% and Wall-mart lacks behind substantially. Moreover, EPS has not raised either in relation to the market leader. The industry leader registered a growth of 23.7% in EPS. Wall-Mart ranks 16th in Revenue growth between 21 industry players. In addition to it, return on equity for the industry leader is 35.46% in relation to 23.44% of Wall-Mart. Conclusion: Overall, Wall-mart has improved from 2009 but the growth is sluggish. Wall-Mart needs to improve its profitability and work immensely to improve its market share. The share prices have been steady over the three years at $53. Therefore, I suggest an investor to hold for the next 3 months, and wait for Wall-Mart to declare its third quarter results. Bibliography Wall-Mart Stores Inc. (WMT). (2010). Wal-Mart Annual Report. Besley, S., & Brigham, E. F. (2000).Essentials of managerial finance. Washington, DC: South-Western College. Levinson, M. (2006).Guide to Financial Markets. New York, NY: Bloomberg Press. Read More
Cite this document
  • APA
  • MLA
  • CHICAGO
(“Companies Research Essay Example | Topics and Well Written Essays - 2000 words”, n.d.)
Retrieved from https://studentshare.org/finance-accounting/1430814-companies-research
(Companies Research Essay Example | Topics and Well Written Essays - 2000 Words)
https://studentshare.org/finance-accounting/1430814-companies-research.
“Companies Research Essay Example | Topics and Well Written Essays - 2000 Words”, n.d. https://studentshare.org/finance-accounting/1430814-companies-research.
  • Cited: 0 times

CHECK THESE SAMPLES OF The Growth of Wall-Mart Stores

Wall Mart stores

In the paper 'Wall Mart stores' the author analyzes a successful company started by Walton in Arkansas.... The author states that the organization's primary source of growth, numerous achievements, and customer satisfaction levels, get encouraged through their employees....
7 Pages (1750 words) Essay

Business Processes in Wal-Mart

It is engaged in the business of operating retail stores of various formats.... It operates restaurants, supermarkets, discount stores, hypermarkets, supercenters, etc.... The products offered in the stores of Wal-Mart include frozen foods, meat, dairy products, beverages, grocery items, electronic goods, household items, and so on.... Retail stores of various formats are operated by Wal-Mart in all 50 states of the US.... All these six merchandise units offer different categories of merchandise products through their various types of retail stores located in different parts of the US....
5 Pages (1250 words) Essay

Wal-Mart Stores, in Canada

Wal-Mart stores in Canada Name: Institution: In Canada, Wal-mart entered in the year 1994 when it bought 121 of the 144 wool co stores.... The purchased stores were not unionized.... For more than two decades, Wal-Mart in Canada has been fending off incursions from dollars stores with success (Roberts & Berg, 2012).... This is caused the Wal-mart Canada market stores to increase its market share annually.... This has caused the company to invest 750 million dollars into 74 stores....
4 Pages (1000 words) Essay

Wall-Mart and Information System

Wal-Mart stores are, therefore, designed in such a manner that the managers of the organization are the ones who allocate duties as well as monitor the activities of employees within the organization.... The managers also identify any changes that need to be implemented to the stores in order to ensure that all the production processes within the stores are in line with the goals of the entire organization (The Wall Street Journal, 2012).... The fact that Wal-Mart's products cost relatively low makes it very successful when introducing new products and services because after all, many customers will want to purchase in its stores to maximize the value for their money....
6 Pages (1500 words) Essay

Wal-Mart's Growth Plan in China

3) Small Town Locations - During the initial growth phase, Wal-Mart grew under the competition's radar.... Even after being in China for 10 years; Wal-Mart has not been able to obtain positive ROI.... This case analyses the strategy of Wal-Mart in China and the major issues being faced....
10 Pages (2500 words) Case Study

Wall Mart Mission

Customers of wall-mart are, therefore, the most influential stakeholders of the company.... Employees of wall-mart are highly treasured since they are the ones selling and marketing the products to consumers (Bonaich, 2004).... This paper ''Wall Mart Mission'' tells us that the company's mission and vision provide a tool for communicating the company's purpose and its entire values to the major shareholders (Bonaich, 2004)....
7 Pages (1750 words) Essay

Branded Space: Wal-Mart

Wal-Mart stores is an American retail giant that has been growing in popularity for its large discount department stores.... Customers, especially in today's recession economy, are considering buying their commodities from discount stores.... In this paper, the branded space of Wal-Mart is analyzed....
10 Pages (2500 words) Term Paper

Wal-Mart and Radioshack Management

What many people do not realize is that before Wal-Mart, Sam Walton owned and operated a number of variety stores in the 1950s.... What many people do not realize is that before Wal-Mart, Sam Walton owned and operated a number of variety stores in the 1950s.... What many people do not realize is that before Wal-Mart, Sam Walton owned and operated a number of variety stores in the 1950s.... As such, by 1962, he had expanded his stores to fifteen and coined the name Walmart....
10 Pages (2500 words) Case Study
sponsored ads
We use cookies to create the best experience for you. Keep on browsing if you are OK with that, or find out how to manage cookies.
Contact Us