StudentShare
Contact Us
Sign In / Sign Up for FREE
Search
Go to advanced search...
Free

Nautilus Incorporation - Research Paper Example

Cite this document
Summary
Financial Analysis – Nautilus Inc
Executive Summary
The financial analysis of Nautilus Inc. over a period five years from 2007 to 2011 has been conducted under this article by utilizing suitable ratios and computations. …
Download full paper File format: .doc, available for editing
GRAB THE BEST PAPER95.9% of users find it useful
Nautilus Incorporation
Read Text Preview

Extract of sample "Nautilus Incorporation"

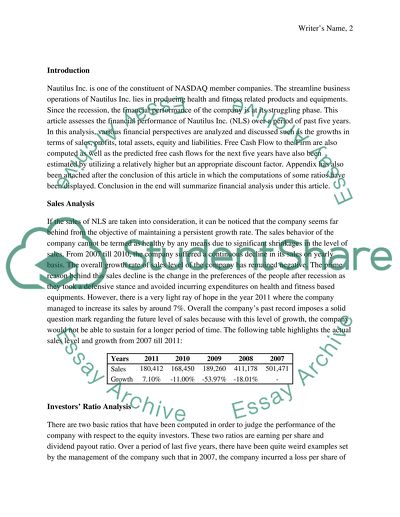
11th April, Financial Analysis – Nautilus Inc Executive Summary The financial analysis of Nautilus Inc. over a period five years from 2007 to 2011 has been conducted under this article by utilizing suitable ratios and computations. If the financial results of the company are analyzed in a summarized way, it can be concluded that the company has not performed in a sustainable and healthy manner. The summarized findings of the financial analysis are outlined below: 1. Sales level of the company has been on a declining trend and the company’s sales are reduced to $180 million from $517 million. 2. For investors, both earning per share as well as dividend payout ratio, have shown very disgusting results. 3. The profitability position of the company is quite disappointing as the company incurred losses in first four years, but generated some profits in 2011. 4. Total Assets of the company have been on a declining trend as well, but there is a slight improvement in 2011. 5. Leverage position of the company has reflected negative results such that debt ratio has increased from 50% to 60% and the level of debt is on an increasing trend which is an alarming sign for the company. 6. Equity position of the company has also shown some bitter results such that it is reduced by 6 times from 2007. 7. Operating cash flows have remained quite volatile during last five years. 8. Free cash flows to firm are predicted to be increased by 10% every year. 9. The risk position of the company is not good at all and the company still in high risk zone. 10. A discount rate of 35% is used to discount the free cash flows. Introduction Nautilus Inc. is one of the constituent of NASDAQ member companies. The streamline business operations of Nautilus Inc. lies in producing health and fitness related products and equipments. Since the recession, the financial performance of the company is at its struggling phase. This article assesses the financial performance of Nautilus Inc. (NLS) over a period of past five years. In this analysis, various financial perspectives are analyzed and discussed such as the growths in terms of sales, profits, total assets, equity and liabilities. Free Cash Flow to the Firm are also computed as well as the predicted free cash flows for the next five years have also been estimated by utilizing a relatively higher but an appropriate discount factor. Appendix has also been attached after the conclusion of this article in which the computations of some ratios have been displayed. Conclusion in the end will summarize financial analysis under this article. Sales Analysis If the sales of NLS are taken into consideration, it can be noticed that the company seems far behind from the objective of maintaining a persistent growth rate. The sales behavior of the company cannot be termed as healthy by any means due to significant shrinkages in the level of sales. From 2007 till 2010, the company suffered a continuous decline in its sales on yearly basis. The overall growth rate of sales level of the company has remained negative. The prime reason behind this sales decline is the change in the preferences of the people after recession as they took a defensive stance and avoided incurring expenditures on health and fitness based equipments. However, there is a very light ray of hope in the year 2011 where the company managed to increase its sales by around 7%. Overall the company’s past record imposes a solid question mark regarding the future level of sales because with this level of growth, the company would not be able to sustain for a longer period of time. The following table highlights the actual sales level and growth from 2007 till 2011: Years 2011 2010 2009 2008 2007 Sales 180,412 168,450 189,260 411,178 501,471 Growth 7.10% -11.00% -53.97% -18.01% - Investors’ Ratio Analysis There are two basic ratios that have been computed in order to judge the performance of the company with respect to the equity investors. These two ratios are earning per share and dividend payout ratio. Over a period of last five years, there have been quite weird examples set by the management of the company such that in 2007, the company incurred a loss per share of $1.76, yet the company somehow managed to pay dividends of around $0.30 (see appendix). But after that the company did not pay any sort of dividend in the next four years even though the company managed to earn profits in 2011. If the pattern of earning per share is observed, again there are disappointing results such that in the first four years, the company remained in a negative zone and incurred loss per share. However, the company started off bouncing back to a profit streamline and achieved earning per share of $0.05 after a series of continuous losses. On the other hand, if dividend pattern of the company is observed, the final dividend was paid out in 2007, till now there is no distribution made by the company in this regard. From an investor’s point of view, the things are not quite much satisfactory as the company has spent a bitter past in terms of its earnings and dividends. So equity investors should be very careful in including this stock into their investment portfolio as the financial results of the company are pretty much depressing and will need some time to show a consistent profit outlook. The following is the summarized table of earning per share and dividend payout statistics for NLS over last five years. Investors Ratios 2011 2010 2009 2008 2007 Earning Per Share 0.05 (0.74) (1.74) (2.91) (1.76) Dividend Payout Ratio 0.00% 0.00% 0.00% 0.00% -17.01% Profitability Analysis The profitability position of NLS is analyzed in two ways such that the level of profits and their growth rates are analyzed and then the analysis is conducted in the light of some of the common ratios. If the profitability level of NLS is taken into consideration, only losses have shown their dominance in the first four years such that the company incurred the biggest loss in 2008. After 2008, the level of losses are reduced to a greater extent such the company managed to start earning some profits in the year 2011. Overall, the growth rate of profitability of the company is negative, yet the company has made substantial efforts to decrease the losses as depicted by the year on year growth rates of the company. In 2011, the company performed tremendously such that it recovered the previous year’s loss, as well as generated some profits. The following is the summarized table of the profitability position of the company in terms of profitability level and growth. Years 2011 2010 2009 2008 2007 Profits/Losses 1420 (22,841) (53,297) (90,588) (55,613) Growth 106.22% 57.14% 41.17% -62.89% - In terms of profitability ratios, one pattern has remained common among all the five ratios, which is the negative returns of the company in first four years and in 2011, the company started generating positive returns. Net profit margin is an important indicator of the profitability such that the company has improved its net profit margin in 2011. Exactly similar patterns can also be observed for other four ratios. From investor’s point, their return on equity has improved which can be a positive sign for the company as more equity investors are likely to be attracted by such improved statistics. The following table outlines all five profitability ratios which are used in this analysis. Profitability Ratios 2011 2010 2009 2008 2007 Net Profit Margin 0.79% -13.56% -28.16% -22.03% -11% Operating Profit Margin 1.99% -5.68% -15.43% -20.29% -14% Return on Assets 1.71% -29.15% -46.28% -45.86% -14% Return of Fixed Assets 32.24% -601.87% -662.73% -275.49% -132% Return on Equity 4.44% -74.16% -101.55% -87.37% -28% Total Assets Analysis The performance of the company remained again disgusting in the first four years such that total assets remained on a declining trend with a persistent negative growth. This declining trend came to an end in the year 2011 when the company remained successful in generating additional 5.67% in its total assets as compared to the previous year. Overall, the performance of the company in this regard needs more improvements. Here is the summarized table for level of total assets and its growth rates: Years 2011 2010 2009 2008 2007 Total Assets 82,813 78,367 115,172 197,519 390,840 Growth 5.67% -31.96% -41.69% -49.46% - Leverage Analysis This analysis has been conducted in such a manner that the growth pattern of long term debt of company, as well as the debt ratio, are taken into consideration. If the long term debt of the company is closely looked at, the company had severe loan obligations in 2007, but the company successfully reduced them till 2009, at that time the long term debts of the company were at their lowest level. However, in 2010 the company issued a loan note of a relatively significant amount which increased the level of long term debt by around 217%. In 2011, the company issued more debt instruments and increased its debt level by around 9%. If the debt ratio of the company is taken into account, clearly it can be noticed that the half of the assets of the company were financed by long term debts from 2007 till 2009, however, due to issuance of loan note the debt ratio increased to some 61% which is an alarming sign for the company. The overall leverage position of the company can be observed in the following table. Years 2011 2010 2009 2008 2007 Long term Debt 5,598 5,141 1,619 3,203 6,919 Growth 8.89% 217.54% -49.45% -53.71% - Debt Ratio 0.61 0.61 0.54 0.48 0.50 Equity Analysis The equity position of NLS also shows a similar picture as displayed by the other areas of the company. The company experienced a significant wipe out of the equity in the initial four years such that equity of the company came to some $30,799 from $196,454 which is around 6 times. In the year 2011, the company started doing a fairly reasonable job by adding up some 3.75% in its equity. Overall, the equity level and its growth over a period of last five years have remained very disappointing. The company needs to take some serious measures in order to increase its level of equity otherwise the chances of going bankrupt will likely be increased. Here are the summarized results for the company in terms of its level of equity and its respective growth pattern. Years 2011 2010 2009 2008 2007 Total Equity 31,953 30,799 52,483 103,685 196,454 Growth 3.75% -41.32% -49.38% -47.22% - Operating Cash flow Analysis Operating cash flows is the key area that describes how well the company is performing its main business activities and operations. If the operating cash flow trend of NLS is considered, it can be observed that the company has performed in a haphazard manner such that in 2008, the company experienced a drop in its operating cash flows. However, in the very next year, the company bounced back marvelously and heavily increased its cash flows from operating activities. However, the company made the biggest slump in the year 2010 when the operating cash flows of the company became negative. Again, in 2011 the company has started producing positive operating cash flows. Overall, the operating cash flow position of the company remained quite volatile during the five years time horizon. Free Cash flows to Firm Analysis The amount of free cash flows to the firm reveals the amount of cash flows that are available to be distributed among the shareholders as well as the debt holders of the company. Free cash flows to firm are computing by adding after-tax interest payments and deducting the capital expenditures from operating cash flows of the company. It is important to mention here that since the company had been experiencing losses, therefore, the company was allowed some tax benefits as well. As a result, the tax rates of the company in last 2 years have remained nil. Free cash flows to firm also showed serious vulnerability over last 5 years such that it suffered a negative figure in 2010. It can be observed the free cash flows pattern of NLS have remained quite unsustainable during the past 5 years as a result of significant movements in the operating cash flows of the company. The following table outlines the detailed computation as well as the growth rates of free cash flows to firm. Years 2011 2010 2009 2008 2007 Operating Cash Flows 4,598 (10,659) 14,782 5,570 8,504 Interest 466 140 168 1,753 5,014 Tax Rate 0.00% 0.00% 5.74% 21.57% 14.36% After Tax Interest 466 140 158.3568 1374.878 4293.99 Capital Expenditure 2,506 222 4,024 3136 4564 Free Cash Flows 2,558 (10,741) 10,916 3,809 8,234 Growth 123.82% -198.39% 186.60% 53.74% - Riskiness of the Company The risk position of the company can be analyzed by all of the above mentioned points such that the debt position of the company has become worst as compared to previous years. At the same time the company has shown severe declines in its sales and profitability levels during the last five years. Operating cash flows as well as free cash flows to firm have remained quite fluctuating as well. These all elements prove that the company is quite risky and needs quite much time in generating positive and consistent financial results. Forecasted Free Cash Flows Since the free cash flows to the firms have shown a very volatile trend, therefore it is quite difficult to estimate a particular trend of future forecasts of free cash flows to firm. However, it is assumed that the free cash flows to firm will be increased every year by 10%. In order to compute the present value of all the free cash flows to firm, a discount factor of 35% is used. The rationale behind using this high discount factor is the fluctuating behavior of the stock such as the beta of NLS is around 3.8 which can be called as very high. Since the beta reflects the systematic risk of a company, therefore a higher beta suggests that the company is quite risky. Being a risky company, a higher cost of capital is estimated by utilizing the Capital Asset Pricing Model (CAPM) formula in which beta plays a significant role. The detailed computation of discount factor is presented in the appendix section. Here are the predicted free cash flows to firm for a period of next five years along with their discounted present values. Years 2016 2015 2014 2013 2012 2011 Free Cash Flows 4,120 3,745 3,405 3,095 2,814 2,558 Discount Factor (35%) 0.2230 0.3011 0.4064 0.5487 0.7407 1 PV of Cash flows 919 1,128 1,384 1,698 2,084 2,558 Conclusion This article analyzed the financial performance of the Nautilus Inc. over a period of five years. Various aspects of the company have been analyzed such as sales level, profitability level, leverage position, operating cash flows level, free cash flows and their present values etc. It can be concluded the company’s performance have remained extremely sluggish in almost all of these areas. However, the financial performance of the company remained a bit better in 2011 which is a bright prospect for Nautilus Inc. in the upcoming years. Profitability Ratios    2011 2010 2009 2008 2007 Net Profit Margin Profit After Tax 1,420 0.79% (22,841) -13.56% (53,297) -28.16% (90,588) -22.03% (55,613) -11%   Sales 180,412 168,450 189,260 411,178 501,471         Operating Profit Margin Operating Profit 3,599 1.99% (9,569) -5.68% (29,205) -15.43% (83,441) -20.29% (68,612) -14%   Sales 180,412 168,450 189,260 411,178 501,471         Return on Assets Profit After Tax 1,420 1.71% (22,841) -29.15% (53,297) -46.28% (90,588) -45.86% (55,613) -14%   Total Assets 82,813 78,367 115,172 197,519 390,840         Return of Fixed Assets Profit After Tax 1,420 32.24% (22,841) -601.87% (53,297) -662.73% (90,588) -275.49% (55,613) -132%   Total Fixed Assets 4,405 3,795 8,042 32,883 42,291         Return on Equity Profit After Tax 1,420 4.44% (22,841) -74.16% (53,297) -101.55% (90,588) -87.37% (55,613) -28%   Shareholders' Equity 31,953 30,799 52,483 103,685 196,454   Investors Ratios     Earning Per Share Net Income/Loss 1,420 0.05 (22,841) (0.74) (53,297) (1.74) (90,588) (2.91) (55,613) (1.76)   Number of Shares outstanding 30,776 30,744 30,664 31,117 31,538         Dividend Payout Ratio Dividend Per Share 0.00 0.00% 0.00 0.00% 0.00 0.00% 0.00 0.00% 0.30 -17.01%   Earning Per Share 0.05 (0.74) (1.74) (2.91) (1.76)   Leverage Ratio     Debt Ratio Total Liabilities 50,860 0.61 47,568 0.61 62,689 0.54 93,834 0.48 194,386 0.50   Total Assets 82,813 78,367 115,172 197,519 390,840   Appendix 2 Items Amounts Current Share Price 2.59 No. of Shares Outstanding 30,750,000 Rf 0.07% NASDAQ – Op. (9th Apr, 11) 2780.42 NASDAQ – Cl. (9th Apr, 12) 3047.08 Market Return 9.59% Risk Premium 9.52% Beta 3.8 Cost of Equity 36.25% MV of Equity 79,642,500 References Nautilus Inc., Annual Report 2012. n.d. Web. 11 April. 2012. Nautilus Inc., Annual Report 2011. n.d. Web. 11 April. 2012. Nautilus Inc., Annual Report 2010. n.d. Web. 11 April. 2012. Nautilus Inc., Annual Report 2009. n.d. Web. 11 April. 2012. Yahoo! Finance., Summary for Nautilus Inc. n.d. Web. 11 April. 2012. Read More
Cite this document
  • APA
  • MLA
  • CHICAGO
(“Nautilus Incorporation Research Paper Example | Topics and Well Written Essays - 1500 words”, n.d.)
Retrieved from https://studentshare.org/finance-accounting/1397141-nautilus-incorporation
(Nautilus Incorporation Research Paper Example | Topics and Well Written Essays - 1500 Words)
https://studentshare.org/finance-accounting/1397141-nautilus-incorporation.
“Nautilus Incorporation Research Paper Example | Topics and Well Written Essays - 1500 Words”, n.d. https://studentshare.org/finance-accounting/1397141-nautilus-incorporation.
  • Cited: 0 times

CHECK THESE SAMPLES OF Nautilus Incorporation

International Market Entry and Development

International Market Entry and Development Author Institution Abstract International market choice can be regarded as one of the most noteworthy choices made by organizations pursuing to involve in global business.... Commercial entities in the era of globalization have warmed up to, and necessitated a shift in the direction of the internationalization of companies....
6 Pages (1500 words) Essay

Business Prospects of Sony Corporation in the Emerging Economies

The study "Business Prospects of Sony Corporation in the Emerging Economies" indicates the company decided to expand its business branches in developing economies by increasing its FDI, entering to business mergers and strategic alliances to serve a strong competition to its rivals in the industry....
14 Pages (3500 words) Case Study

LLC Legal Analysis

The study "LLC Legal Analysis" discusses the corporation legal case of a Limited Liability Company (LLC) as a legal entity under Australian Law.... nbsp;Limited liability can be defined as a shareholder's liability in a company that is limited to the value of his or her shareholding in the company....
6 Pages (1500 words) Case Study

Microsoft Corporation Policy

The main purpose of this study is to analyze multinational corporation Microsoft.... The author concentrates on the structure of this company, makes PESTLE Analysis and SWOT Analysis of Microsoft Corporation pointing out its weaknesses, strengths, threats, and opportunities.... hellip; Founded by Bill Gates and Paul Allen on April 4, 1975, in Albuquerque(US) it is today a Multinational corporation which deals in computer software, computer hardware, research and development, gaming; a corporation that manufactures, outsources, licenses and supports a wide range of software products....
6 Pages (1500 words) Case Study

Why Prenatal Development Is a Delicate Period

This is a delicate period because any mistakes happening during this period may affect the life of the child to be born forever.... During this… This include formation of body parts like the hands, legs, head and later on during the prenatal period there is formation of internal organs like the lungs and brains among others....
4 Pages (1000 words) Term Paper

650 questions 1 and 2

Because a corporation usually has most of the legal advantages of a person and is considered to be “citizen of its state of incorporation”, quoting the textbook, it stands to reason that the firm would also be held to the same standards when it comes to illegal activity.... hellip; Enron is a perfect example of this in that CEO Jeff Skilling, Kenneth Lay, and CFO Andrew Fastow were also prosecuted for chiefly hiding the firm's financial Ethics and Firm's Goals....
2 Pages (500 words) Assignment

Financial Instrument Traded in the Stock Market

Thus, in this essay in order to determine appropriate investment plan for Brett Daly, two approaches of measuring the security pricing movement including Stock's relative strength index (RSI) and moving average method have been used for determining the nautilus security movement RSI, measures the speedily movement of pricing on the index of 0 to 100 whereas, moving average method is used to measure the pricing trend-followed as per security based on previous prices....
5 Pages (1250 words) Research Paper

Activity-Based Costing (ABC) in Service Industries

The BlueFly incorporation is one of the top online businesses in the United States of America.... The BlueFly incorporation is always using one of the modern technologies available thus it has developed electronic commerce innovations such as personalization of shopping services and the browse and search features are easy to use making even the illiterate customers able to use.... Doing shopping at the BlueFly incorporation is always absolutely fast and safe as there are systems of simple procedures, the credit transactions are very secure plus a convenient communication of customers through their e-mail addresses and the shipping of bulky goods is also done directly without any inconveniences...
5 Pages (1250 words) Case Study
sponsored ads
We use cookies to create the best experience for you. Keep on browsing if you are OK with that, or find out how to manage cookies.
Contact Us