StudentShare
Contact Us
Sign In / Sign Up for FREE
Search
Go to advanced search...
Free

Relationship between Heart and Body - Essay Example

Cite this document
Summary
The paper "Relationship between Heart and Body" suggests ample evidence in the literature that heart and body size are correlated3&15. It is believed that individuals with large body sizes will generally possess a larger heart than smaller individuals…
Download full paper File format: .doc, available for editing
GRAB THE BEST PAPER96% of users find it useful
Relationship between Heart and Body
Read Text Preview

Extract of sample "Relationship between Heart and Body"

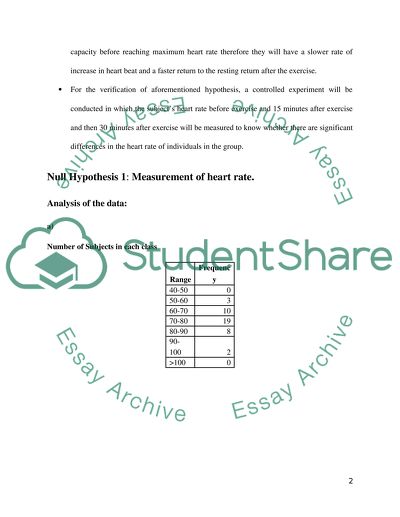
?Statistical Tests Introduction There is an ample amount of evidence in the literature that heart and body size are correlated3&15. It is believed that individuals with large body size will generally possess a larger heart as opposed to smaller individuals. The cardiovascular system functions by pumping blood to meet the metabolic requirements of the tissues. To fulfil these metabolic requirements it is suggested that the heart rate of smaller individuals should be greater than the heart rate of large people. This theory is based on the concept that a heart with small size will have smaller cardiac output as compared to the larger heart. Hence, this scientific theory proposes that the heart beat of the larger individual will beat slowly to meet the metabolic requirements. The above hypothesis will be examined by collecting a sample of short and tall individuals and identify whether there are significant differences in their heart beat rates. To prove this, an experiment will be conducted which will find out whether there are considerable differences in the heart rate of tall and short subjects. The experts in the field8 as have also emphasized that individuals who are physically fit have a higher stroke volume as compared to inactive individuals. This means that individuals having a poor physical condition will reach their maximum heart beat rate at a lower work level than individuals who are physically fit. Based on the above belief, a theory has been put forward that since physically fit individuals have a higher aerobic capacity before reaching maximum heart rate therefore they will have a slower rate of increase in heart beat and a faster return to the resting return after the exercise. For the verification of aforementioned hypothesis, a controlled experiment will be conducted in which the subject’s heart rate before exercise and 15 minutes after exercise and then 30 minutes after exercise will be measured to know whether there are significant differences in the heart rate of individuals in the group. Null Hypothesis 1: Measurement of heart rate. Analysis of the data: a) Number of Subjects in each class Range Frequency 40-50 0 50-60 3 60-70 10 70-80 19 80-90 8 90-100 2 >100 0 b) Histogram Figure 1: Histogram of Heart Beats per Minute Median = 76 Mode = 80 Both the median and mode lie in the 70-80 subject group of the variable. c) The data for the given variable is spread symmetrically around the central location. It has a modal class. I expect the data to be modal since most of the individuals will have a common heart beat rate with few exceptional cases. My expectations are supported by the graph of histogram as majority of the frequency of the data lies in the middle of set. d) Null Hypothesis: (There is no difference in the mean heart rate of the tall and short subjects) Alternative Hypothesis: (There is a difference in the mean heart rate of the tall and short subjects) Significance Level The hypothesis is to be performed at 5% significance level or 95% confidence level, so Critical Value The critical values for the two tailed test for with confidence level of are If the value of the t test statistic is lesser than -2.02 or greater than 2.02 than reject; otherwise do not reject. T-test Value: The data values for the small subject group and tall subject group are attached in the appendix (Table 1 and Table 2) Where By using formulas we calculate that (All the calculations are given in appendix) Where The value of t-test statistic is -0.339 and it does not fall in the rejection region thus we do not reject the null hypothesis. The test results are not statistically significant at the 5% level; that is, at the 5% significance level, the data do not provide sufficient evidence to conclude that there is difference in the mean heart rate of the tall and short individuals. Null Hypothesis 2 and 3: Heart rate and recovery after exercise. a) Mean heart rate These are the class mean heart rates (beats per minute) Before Exercise 75.2 Directly After Exercise 124.8 After 1 Minute 105.9 After 5 Minutes 90.1 After 15 Minutes 81.0 After 30 Minutes 75.1 Confidence Intervals Confidence interval can be calculated by the formula Where Sample Standard Deviation These are the sample standard deviation for each category Before Exercise 9.90 Directly After Exercise 18.72 After 1 Minute 18.64 After 5 Minutes 12.43 After 15 Minutes 11.32 After 30 Minutes 10.22 All of the below confidence level are constructed at 95% confidence level Confidence Interval of the Class before the exercise: Confidence Interval of the Class directly after the exercise: Confidence Interval of the Class after 1 minute of the exercise: Confidence Interval of the Class after 5 minutes of the exercise: Confidence Interval of the Class after 15 minutes of the exercise: Confidence Interval of the Class after 30 minutes of the exercise: b) Yes the above diagram shows that there are significant differences in the mean heart rate before the exercise and after the exercise and it shows that the mean heart approaches the before exercise heart rate nearly after 30 minutes. c) Null Hypothesis: (There is no difference in mean heart rate before exercise and 15 minutes after exercise) Alternative Hypothesis: (There is a difference in mean heart rate before exercise and 15 minutes after exercise) Significance Level The hypothesis is to be performed at 5% significance level or 95% confidence level, so Critical Value The critical values for the two tailed test for with confidence level of are If the value of the t test statistic is lesser than -2.02 or greater than 2.02 than reject; otherwise do not reject. T-test Value: Where By using formulas we calculate that d) The value of t-test statistic is -4.10 and it does fall in the rejection region thus we reject the null hypothesis. The test results are statistically significant at the 5% level; that is, at the 5% significance level, the data do provide sufficient evidence to conclude that there is a difference in mean heart rate before exercise and 15 minutes after exercise. e) Null Hypothesis: (There is no difference in mean heart rate before exercise and 30 minutes after exercise) Alternative Hypothesis: (There is a difference in mean heart rate before exercise and 30 minutes after exercise) Significance Level The hypothesis is to be performed at 5% significance level or 95% confidence level, so Critical Value The critical values for the two tailed test for with confidence level of are If the value of the t test statistic is lesser than -2.02 or greater than 2.02 than reject; otherwise do not reject. T-test Value: Where By using excel formulas we calculate that The value of t-test statistic is 0.095 and it does not fall in the rejection region thus we will not reject the null hypothesis. The test results are not statistically significant at the 5% level; that is, at the 5% significance level, the data do not provide sufficient evidence to conclude that there is a difference in mean heart rate before exercise and 30 minutes after exercise. Discussion: As per the literature and theory it was suggested that to fulfill the metabolic requirements, the heart rate of smaller individuals should be greater than the heart rate of larger people. This scientific theory proposed that the heart beat of the larger individual will beat slowly to meet the metabolic requirements and hence there will be a difference in the heart rates of short and tall subjects. However, our analysis revealed that there were no significant differences between the heart rate of short and tall subjects therefore the theory does not prove to be valid. However, if we had used weight instead of height as a variable since weight also determines the body size, there might have been different results. A research also proved that body surface area was the most important determinant of the size of cardiovascular structures than age, height and weight alone10. So the sample bias might have been inherent in our conclusion. The study conducted by Jegier3 with a different methodology could serve as a benchmark and can prove the theory valid. Their research included 77 subjects with each of them were divided into different age groups. There were different age groups and among them the most apparent ones were the range of 3 weeks to 4 years, 5 to 15 years and individuals who had an age between 20 to 52 years. In addition to that, the researchers were judicious in their approach as they incorporated all the three factors such as height, weight, and surface area of individuals to conduct the research. Furthermore, they also eliminated any extra-ordinary values from the sample to make it unbiased. For instance, they discarded individuals from their sample whose heart rate exceeded 84 beats a minute as they thought that it might have been due to the fact, that particular individual was suffering from a disease or he was an outlier for some or other reasons. Therefore, in our study we should have also set an upper limit for both the groups if we were to make a reasonable inference. The second theory was based on the idea that individuals who were physically fit should have a higher stroke volume as compared to inactive individuals. It was also put forward that since physically fit individuals have a higher aerobic capacity therefore they will have a slower rate of increase in heart beat and a faster return to the resting return after the exercise. Vander13 identified muscular activity as among the fundamental factors which affect the metabolic rate. Hence, the time it takes for each individual to reach the maximum heart rate should vary according to the healthiness of the individual. Similarly, according to Martini5 cardiovascular system’s performance is dependent upon training and that is why we find that athletes have a greater stroke volume which leads to a greater cardinal output as compared to non-athletes. The cardinal output of athletes can increase by 50% more than that of non-athletes if they wish to do so. Our analysis showed that there are significant differences in the heart stroke after 15 minutes within the class which implies that there are certain individuals who are physically fit than the others as they have a slower rate of increase in heart beat during the initial period. However, the third hypothesis was neither validating nor it was invalidating the theory. As per the results of the third hypothesis the whole class reached the normal heart beat after 30 minutes. Again we might have not used realistic data to reach any conclusion. Firstly, if we were to conduct a test to validate this theory we should have used two different controlled experiments to measure our results. The first controlled experiment should have consisted of physically fit individuals while the second experiment should have comprised of individuals who were inactive or lethargic. This might have validated our theory since we would have known that which group was physically fit while we were conducting the experiment. In this case, we didn’t know the characteristics of the individuals therefore the bias was again inherent in our sample. Conclusion According to Wilmore & David15, the cardiac output differs among individuals and depends on body size and fitness level. However, we have concluded from our analysis at the confidence level of 95% that the heart beat of short and small subjects did not differ significantly implying that the metabolism requirements are met by the cardiac output of respective samples. This might have been due to the fact that there were significant biases involved in our sample. The confidence interval over the period of time revealed that there are significant differences in the mean heart rate directly after the exercise, after 1 minute, after 5 minutes and after 15 minutes. However, the mean rate before the exercise and after 30 minutes did not show significant differences. The statistical analysis at 95% confidence level also revealed that individuals who were physically fit have different heart stroke volume since within the class there were significant differences in heart stroke volume after 15 minutes implying that some individual are physically more fit than the others. However, according to our discussion we have neither validated nor invalidated the scientific theories as there might have been certain errors in our methodology. Bibliography 1. Gaces, V. B., 2008, Factors Affecting Cardiac Output. Available at: [Accessed 12 Feb 2011] 2. Heart Rate and Physical Fitness. (n.a). Available at: [Accessed 12 Feb 2011] 3. Jegier, W., Sekelj, P., Auld, P., et al. 1963. The Relation between Cardiac Output and Body Size. Available at: [Accessed 13 Feb 2011] 4. London, G. M., Guerin A. P., Pannier, B.M., et al. 1995. Body height as a determinant of carotid pulse contour in humans. Hypertension. 10 (6), pp.514–519. 5. Martini, F. 2005, Fundamentals of Anatomy and Physiology (7th Edition). Pearson Education, San Francisco 6. Milmeister 2010, What Are the Benefits of Physical Fitness on the Cardiovascular System? Available at: [Accessed 12 Feb 2011] 7. Mohrman, D. E. & Heller, L. 2006, Cardiovascular Physiology (Sixth Edition), McGraw- Hill Companies, USA 8. Pocock. G. & Richards, C. 2004. Human physiology: The basis of medicine, Oxford University Press, London 9. Size Principle of the Heart in Mammals (n.a). Available at: [Accessed 12 Feb 2011] 10. Sluysmans, T. & Colan, S. D. 2005. Theoretical and empirical derivation of cardiovascular allometric relationships in children. Journal of Applied Physiology. 99 (2), pp.445-457 11. Spatz, H. C., 1991, Circulation, metabolic rate, and body size in mammals, Journal of Comparative Physiology, 161(3), pp.231-236 13. Vander, et al. 2001. Human Physiology: The Mechanism of Body Function (Eighth Edition), McGraw Hill Companies, USA 14. Weiss, N. A. 1995, Introductory Statistics, Addison-Wesley Publishing, New York, USA. 15. Wilmore, J. H. & Costill, D. L. 2004. Physiology of sport and exercise. Human Kinetics, USA Appendix Table 1: Heart beat of short subjects Tall Subjects Height (cm) Heart Beats per Minute 169.0 72.0 169.5 84.0 169.7 56.0 169.9 88.0 171.0 68.0 171.4 80.0 171.6 76.0 172.1 80.0 172.3 100.0 173.5 80.0 174.0 74.0 176.0 79.0 176.5 76.0 178.0 76.0 180.0 72.0 181.0 72.0 182.5 56.0 186.1 64.0 188.7 62.0 189.3 96.0 190.8 80.0 Table 2: Heart beat of tall subjects Heart Beats per Minute Mean Heart Rate Difference Difference from mean squared 72.0 75.76190476 -3.76 14.15 84.0 75.76190476 8.24 67.87 56.0 75.76190476 -19.76 390.53 88.0 75.76190476 12.24 149.77 68.0 75.76190476 -7.76 60.25 80.0 75.76190476 4.24 17.96 76.0 75.76190476 0.24 0.06 80.0 75.76190476 4.24 17.96 100.0 75.76190476 24.24 587.49 80.0 75.76190476 4.24 17.96 74.0 75.76190476 -1.76 3.10 79.0 75.76190476 3.24 10.49 76.0 75.76190476 0.24 0.06 76.0 75.76190476 0.24 0.06 72.0 75.76190476 -3.76 14.15 72.0 75.76190476 -3.76 14.15 56.0 75.76190476 -19.76 390.53 64.0 75.76190476 -11.76 138.34 62.0 75.76190476 -13.76 189.39 96.0 75.76190476 20.24 409.58 80.0 75.76190476 4.24 17.96  Sum of Squared Variance for tall subjects (SS2 ) 2511.81 Data for Null Hypothesis 2: Heart rate before exercise (Beats/Minute) Heart rate 15 minutes after exercise (Beats/Minute) Differences in heart beat rate Mean Difference Difference Difference from mean squared 68.0 80.00 -12.00 -5.81 -6.19 38.32 81.0 110.00 -29.00 -5.81 -23.19 537.80 84.0 80.00 4.00 -5.81 9.81 96.23 80.0 92.00 -12.00 -5.81 -6.19 38.32 84.0 84.00 0.00 -5.81 5.81 33.75 68.0 64.00 4.00 -5.81 9.81 96.23 84.0 75.00 9.00 -5.81 14.81 219.32 56.0 60.00 -4.00 -5.81 1.81 3.27 68.0 72.00 -4.00 -5.81 1.81 3.27 80.0 85.00 -5.00 -5.81 0.81 0.66 80.0 92.00 -12.00 -5.81 -6.19 38.32 64.0 60.00 4.00 -5.81 9.81 96.23 76.0 76.00 0.00 -5.81 5.81 33.75 80.0 88.00 -8.00 -5.81 -2.19 4.80 64.0 76.00 -12.00 -5.81 -6.19 38.32 88.0 92.00 -4.00 -5.81 1.81 3.27 72.0 76.00 -4.00 -5.81 1.81 3.27 68.0 68.00 0.00 -5.81 5.81 33.75 68.0 68.00 0.00 -5.81 5.81 33.75 84.0 84.00 0.00 -5.81 5.81 33.75 72.0 72.00 0.00 -5.81 5.81 33.75 72.0 84.00 -12.00 -5.81 -6.19 38.32 84.0 96.00 -12.00 -5.81 -6.19 38.32 56.0 60.00 -4.00 -5.81 1.81 3.27 88.0 92.00 -4.00 -5.81 1.81 3.27 68.0 68.00 0.00 -5.81 5.81 33.75 80.0 80.00 0.00 -5.81 5.81 33.75 76.0 76.00 0.00 -5.81 5.81 33.75 80.0 88.00 -8.00 -5.81 -2.19 4.80 100.0 92.00 8.00 -5.81 13.81 190.70 80.0 100.00 -20.00 -5.81 -14.19 201.37 74.0 78.00 -4.00 -5.81 1.81 3.27 79.0 74.00 5.00 -5.81 10.81 116.85 76.0 88.00 -12.00 -5.81 -6.19 38.32 76.0 72.00 4.00 -5.81 9.81 96.23 72.0 80.00 -8.00 -5.81 -2.19 4.80 72.0 84.00 -12.00 -5.81 -6.19 38.32 56.0 90.00 -34.00 -5.81 -28.19 794.70 64.0 84.00 -20.00 -5.81 -14.19 201.37 62.0 80.00 -18.00 -5.81 -12.19 148.61 96.0 100.00 -4.00 -5.81 1.81 3.27 80.0 84.00 -4.00 -5.81 1.81 3.27 Sum of squared Variances 3450.48 Data for Null Hypothesis 3: Heart rate before exercise (Beats/Minute) Heart rate 30 minutes after exercise (Beats/Minute) Differences in heart beat rate Mean Difference Difference Difference from mean squared 68.00 74.00 -6.00 0.10 -6.10 37.15 81.00 100.00 -19.00 0.10 -19.10 364.63 84.00 80.00 4.00 0.10 3.90 15.25 80.00 80.00 0.00 0.10 -0.10 0.01 84.00 76.00 8.00 0.10 7.90 62.49 68.00 64.00 4.00 0.10 3.90 15.25 84.00 70.00 14.00 0.10 13.90 193.34 56.00 56.00 0.00 0.10 -0.10 0.01 68.00 68.00 0.00 0.10 -0.10 0.01 80.00 78.00 2.00 0.10 1.90 3.63 80.00 88.00 -8.00 0.10 -8.10 65.53 64.00 60.00 4.00 0.10 3.90 15.25 76.00 78.00 -2.00 0.10 -2.10 4.39 80.00 76.00 4.00 0.10 3.90 15.25 64.00 72.00 -8.00 0.10 -8.10 65.53 88.00 88.00 0.00 0.10 -0.10 0.01 72.00 72.00 0.00 0.10 -0.10 0.01 68.00 64.00 4.00 0.10 3.90 15.25 68.00 72.00 -4.00 0.10 -4.10 16.77 84.00 88.00 -4.00 0.10 -4.10 16.77 72.00 68.00 4.00 0.10 3.90 15.25 72.00 68.00 4.00 0.10 3.90 15.25 84.00 84.00 0.00 0.10 -0.10 0.01 56.00 56.00 0.00 0.10 -0.10 0.01 88.00 88.00 0.00 0.10 -0.10 0.01 68.00 72.00 -4.00 0.10 -4.10 16.77 80.00 88.00 -8.00 0.10 -8.10 65.53 76.00 76.00 0.00 0.10 -0.10 0.01 80.00 84.00 -4.00 0.10 -4.10 16.77 100.00 76.00 24.00 0.10 23.90 571.44 80.00 80.00 0.00 0.10 -0.10 0.01 74.00 76.00 -2.00 0.10 -2.10 4.39 79.00 74.00 5.00 0.10 4.90 24.06 76.00 72.00 4.00 0.10 3.90 15.25 76.00 72.00 4.00 0.10 3.90 15.25 72.00 72.00 0.00 0.10 -0.10 0.01 72.00 78.00 -6.00 0.10 -6.10 37.15 56.00 60.00 -4.00 0.10 -4.10 16.77 64.00 64.00 0.00 0.10 -0.10 0.01 62.00 64.00 -2.00 0.10 -2.10 4.39 96.00 100.00 -4.00 0.10 -4.10 16.77 80.00 80.00 0.00 0.10 -0.10 0.01 Sum of squared Variances 1741.62 Read More
Cite this document
  • APA
  • MLA
  • CHICAGO
(“Population Distributions - statistics lab report Essay”, n.d.)
Retrieved from https://studentshare.org/environmental-studies/1407946-population-distributions-statistics-lab-report
(Population Distributions - Statistics Lab Report Essay)
https://studentshare.org/environmental-studies/1407946-population-distributions-statistics-lab-report.
“Population Distributions - Statistics Lab Report Essay”, n.d. https://studentshare.org/environmental-studies/1407946-population-distributions-statistics-lab-report.
  • Cited: 0 times

CHECK THESE SAMPLES OF Relationship between Heart and Body

Descartes Mind Body Dualism in 6th Meditation

Evaluation of Descartes's Mind body Dualism in the 6th Meditation The mind-body phenomenon refers to the way an individual's processes and states of mind like cool, anger, thinking and beliefs are linked to his/her bodily features, states and tendencies.... He was the first one to initiate the debate about the mind's and the body's interaction with each other.... Descartes proposed that human mind is a non-bodily entity, so it can work independent of the body....
6 Pages (1500 words) Essay

The Tell-Tale Heart by Edgar Allan Poe

The story does not clearly mention the identity of the narrator nor does it clarify the relationship between the murderer and the victim.... The story culminates with confession when the narrator believes in hearing the continuous sound of the heartbeat of the old man under the floorboards where the body has been hidden.... It was for this reason that the narrator mentioned that he had cut the body into pieces before burying it under the floorboards....
6 Pages (1500 words) Research Paper

The Relationship between Weather Temperature and the Incidence of Myocardial Infarction

The author of the essay " The relationship between Weather Temperature and the Incidence of Myocardial Infarction " states that Coronary heart disease, more specifically, myocardial infarctions (MI) are reportedly more common among the elderly during the colder temperatures of winter.... What has been difficult to assess, however, is precisely the relationship between specific cardiac events, such as myocardial infarction, and specific weather temperatures.... Numerous studies have indicated the event of myocardial infarctions in the elderly during colder temperatures based on mortality rates of individuals: 'Seasonality in coronary heart disease (CHD) events, with a winter peak and summer nadir, has been recognized for many decades and across diverse populations' (Gerber, Jacobsen, Killian, Weston, & Roger, 2006)....
6 Pages (1500 words) Essay

Tales from West Africa by Martin Bennett

I wished to take a bath, and the monkeys do not take their hearts to the bathroom and I kept my heart in the mango-basket.... In hurry to jump on your back, I forgot the basket as well as my heart!... This is a story told to me from my Mom.... She had a fond hope that I should graduate from a good school and turn out to be an intelligent boy....
4 Pages (1000 words) Essay

Holistic Health Care - Mind to Body Relationships

They are intrinsically linked to mind and body and emphasize on the mental and spiritual wellbeing also.... The relationship between mind and body is intricate but interesting and is treated separately as two different entities by Descartes.... ne can therefore conclude that understanding the wider ramifications of the mind and body relationship, the efficacy of holistic healthcare becomes more real and effective.... The paper "Holistic Health Care - Mind to body Relationships" asserts that the holistic approach to healthcare has become popular in Western society....
2 Pages (500 words) Essay

Sacred Wilderness by Susan Power

This essay "Sacred Wilderness by Susan Power" is dedicated spiritual significance of the natural world of 'Sacred Wilderness'.... The novel is taking up the central cultural and spiritual traditions.... We are getting cognizance with four women: Gladys Swan is enjoying the mansions on St.... Paul's Avenue....
6 Pages (1500 words) Essay

Effects of Unresolved Conflict on Marital Satisfaction

The aim of this report is to investigate the impact of unresolved conflicts on marriage.... This paper was able to establish that unresolved conflicts create anger, dissatisfaction, pain, hurt, disappointments, and physiological problems for the couple.... .... ... ... Marriage is one of the most sacred institutions of the Christian life....
14 Pages (3500 words) Research Paper

Dilution and Absorbance of Blue Dextran, Heart Rate

eart rate and body characteristic relationshipAbstractThe problem investigated is whether there is a relationship between heart rate and body characteristics such as age, BMI and percentage fats in the body.... It has been necessary to determine the relationship between heart rate and other characteristics of the body.... In this study, an experiment was conducted to determine the relationship between heart rate or exercise level and body characteristics such as % fats in the body and basal metabolic rate (BMI)....
6 Pages (1500 words) Lab Report
sponsored ads
We use cookies to create the best experience for you. Keep on browsing if you are OK with that, or find out how to manage cookies.
Contact Us