StudentShare
Contact Us
Sign In / Sign Up for FREE
Search
Go to advanced search...
Free

Chicago as Global City: Census Analysis - Dissertation Example

Cite this document
Summary
This dissertation "Chicago as Global City: Census Analysis " evaluetes neoliberal transformation of the U.S. urban landscape was an integral part of the economic restructuring that began in the 1980s and have been lasting till today…
Download full paper File format: .doc, available for editing
GRAB THE BEST PAPER92.1% of users find it useful
Chicago as Global City: Census Analysis
Read Text Preview

Extract of sample "Chicago as Global City: Census Analysis"

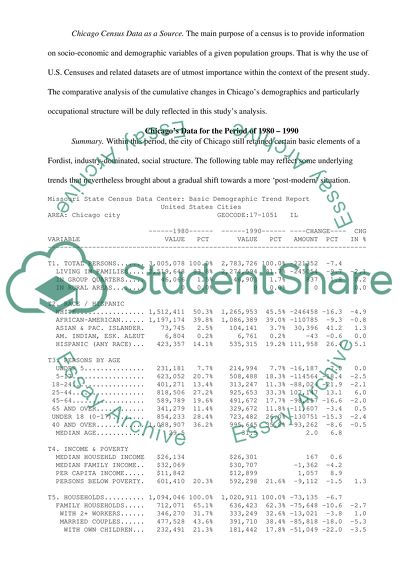
?Chicago as Global Census Analysis The neoliberal transformation of the U.S. urban landscape was an integral part of the economic restructuringthat began in the 1980s and have been lasting till today. The purpose of this chapter is, therefore, to analyze the exact impact of neoliberal transformations on the class and occupational structure of the U.S. urban population, with the example of Chicago City being used. Within the context of the present narrative, the following issues will be dwelt on: (a) A decline of traditional Fordist class structure and of the industrial working class as its principal agent; (b) The rise of precarious labor and the new middle class as the new social agents of a neo-liberal age; (c) Geographical dimensions of Chicago’s transformations: the ‘beneficiary’ and ‘loser’ areas; (d) An example of the Loop as the urban area of a ‘new Chicago’. Methodological Framework. For the purposes of the present study, a problematique of urban restructuring serves as its principal object. With this in mind, two core aspects will be highlighted. The first one is connected with the occupational shift brought about by neoliberal globalization, which is inescapably followed by the emergence of the “dual city” (Mollenkopf and Castells) class structure, i.e. the development of the new professional-managerial class, on the one hand, and the growth of the ranks of service worker-composed underclass, on the other. The latter aspect is, in fact, adjacent to the former one, resulting from the need to cope with the problem of the formation of new consumption models that are directly tied to the newest changes in production/occupational patterns. For that reason, the research in post-modern urban geography, with a specific focus on its relationship with capitalism, is of utmost importance – as demonstrated, inter alia, by the pivotal works by David Harvey. That said, an examination of the intricacies of the neoliberal transformation of Chicago in the decades from the 1980 on is scarcely possible without taking into account the results of the censuses that document the demographical changes that transpired in the city for the duration of this period. That is why it is necessary to turn the attention of a researcher to these data. Chicago Census Data as a Source. The main purpose of a census is to provide information on socio-economic and demographic variables of a given population groups. That is why the use of U.S. Censuses and related datasets are of utmost importance within the context of the present study. The comparative analysis of the cumulative changes in Chicago’s demographics and particularly occupational structure will be duly reflected in this study’s analysis. Chicago’s Data for the Period of 1980 – 1990 Summary. Within this period, the city of Chicago still retained certain basic elements of a Fordist, industry-dominated, social structure. The following table may reflect some underlying trends that nevertheless brought about a gradual shift towards a more ‘post-modern’ situation. Missouri State Census Data Center: Basic Demographic Trend Report United States Cities AREA: Chicago city GEOCODE:17-1051 IL ------1980------ ------1990------ ----CHANGE---- CHG VARIABLE VALUE PCT VALUE PCT AMOUNT PCT IN % ------------------------------------------------------------------------------- T1. TOTAL PERSONS....... 3,005,078 100.0% 2,783,726 100.0% -221352 -7.4 LIVING IN FAMILIES.... 2,519,648 83.8% 2,274,594 81.7% -245054 -9.7 -2.1 IN GROUP QUARTERS..... 46,066 1.5% 46,903 1.7% 837 1.8 0.2 IN RURAL AREAS........ 0 0.0% 0 0.0% 0 0.0 T2. RACE / HISPANIC WHITE................. 1,512,411 50.3% 1,265,953 45.5% -246458 -16.3 -4.9 AFRICAN-AMERICAN...... 1,197,174 39.8% 1,086,389 39.0% -110785 -9.3 -0.8 ASIAN & PAC. ISLANDER. 73,745 2.5% 104,141 3.7% 30,396 41.2 1.3 AM. INDIAN, ESK. ALEUT 6,804 0.2% 6,761 0.2% -43 -0.6 0.0 HISPANIC (ANY RACE)... 423,357 14.1% 535,315 19.2% 111,958 26.4 5.1 T3. PERSONS BY AGE UNDER 5............... 231,181 7.7% 214,994 7.7% -16,187 -7.0 0.0 5-17.................. 623,052 20.7% 508,488 18.3% -114564 -18.4 -2.5 18-24.................. 401,271 13.4% 313,247 11.3% -88,024 -21.9 -2.1 25-44.................. 818,506 27.2% 925,653 33.3% 107,147 13.1 6.0 45-64.................. 589,789 19.6% 491,672 17.7% -98,117 -16.6 -2.0 65 AND OVER............ 341,279 11.4% 329,672 11.8% -11,607 -3.4 0.5 UNDER 18 (0-17)........ 854,233 28.4% 723,482 26.0% -130751 -15.3 -2.4 40 AND OVER............ 1,088,907 36.2% 995,645 35.8% -93,262 -8.6 -0.5 MEDIAN AGE............ 29.5 31.5 2.0 6.8 T4. INCOME & POVERTY MEDIAN HOUSEHLD INCOME $26,134 $26,301 167 0.6 MEDIAN FAMILY INCOME.. $32,069 $30,707 -1,362 -4.2 PER CAPITA INCOME..... $11,842 $12,899 1,057 8.9 PERSONS BELOW POVERTY. 601,410 20.3% 592,298 21.6% -9,112 -1.5 1.3 T5. HOUSEHOLDS.......... 1,094,046 100.0% 1,020,911 100.0% -73,135 -6.7 FAMILY HOUSEHOLDS..... 712,071 65.1% 636,423 62.3% -75,648 -10.6 -2.7 WITH 2+ WORKERS...... 346,270 31.7% 333,249 32.6% -13,021 -3.8 1.0 MARRIED COUPLES...... 477,528 43.6% 391,710 38.4% -85,818 -18.0 -5.3 WITH OWN CHILDREN... 232,491 21.3% 181,442 17.8% -51,049 -22.0 -3.5 FEMALE HEAD, NO HUSB. 192,309 17.6% 197,631 19.4% 5,322 2.8 1.8 W. OWN CHILDREN..... 119,983 11.0% 109,107 10.7% -10,876 -9.1 -0.3 1-PERSON HOUSEHOLDS.... 337,077 30.8% 323,822 31.7% -13,255 -3.9 0.9 AVG. PERSONS PER HH.... 2.7 2.7 -0.0 -0.9 T6. EDUCATION, POP 25 +. 1,749,574 100.0% 1,746,997 100.0% -2,577 -0.1 HIGH SCHOOL DIPLOMA... 496,397 28.4% 430,618 24.6% -65,779 -13.3 -3.7 COLLEGE DEG. (4+ YRS). 242,053 13.8% 339,862 19.5% 97,809 40.4 5.6 T7. CIVILIAN LABOR FORCE 1,370,485 100.0% 1,361,339 100.0% -9,146 -0.7 FEMALE................ 614,982 44.9% 637,810 46.9% 22,828 3.7 2.0 EMPLOYED.............. 1,235,865 90.2% 1,207,108 88.7% -28,757 -2.3 -1.5 MANAGERIAL, PROF. OCC. 245,887 17.9% 300,246 22.1% 54,359 22.1 4.1 SERVICE OCCUPATIONS... 177,727 13.0% 182,737 13.4% 5,010 2.8 0.5 T8. HOUSING UNITS....... 1,174,028 100.0% 1,133,039 100.0% -40,989 -3.5 OCCUPIED.............. 1,093,410 93.1% 1,025,174 90.5% -68,236 -6.2 -2.7 OWNER OCCUPIED....... 426,610 39.0% 425,411 41.5% -1,199 -0.3 2.5 AVERAGE VALUE....... $80,642 $94,072 13,431 16.7 RENTER OCCUPIED...... 666,800 61.0% 599,763 58.5% -67,037 -10.1 -2.5 MEDIAN CONTRACT RENT $366 $445 79 21.5 SINGLE-FAMILY......... 288,829 24.6% 295,507 26.1% 6,678 2.3 1.5 MOBILE HOMES.......... 1,527 0.1% 1,090 0.1% -437 -28.6 -0.0 MEDIAN YEAR BUILT..... 1938.9 1944.0 5.1 0.3 NOTES: 1. Income figures for "1980" are actually for 1979 and have been converted to 1989 dollars using CPI inflation factor of 1.708. 2. Average value of housing units and median contract rent for 1980 have been converted to 1990 dollars using CPI inflation factor of 1.586 Source: 1980 and 1990 summary tape files 3, U.S. Bureau of the Census Table 1: Demographic Trends in Chicago Area between 1980 and 1990. As one may note, the occupational structure underwent certain changes in the period under consideration. The managerial and professional strata increased their representation in the city’s total laboring population from 17.9% (245,887) for the year of 1980 to 22.1% (300,246) in 1990 (Missouri State Census Data Center). At the same time, service occupations still played a relatively minor role in the city’s economy; the number of service workers barely increased for the duration of the decade (from 177,727 in 1980 to 182,737 in 1990 – or from 13.0% to 13.4%), while unemployment remained generally under control: the employment figures show that the city managed to maintain a situation of almost full employment (90.2% of civilian labor force in 1980; 88.7 in 1990), which meant that a neoliberal restructuring still had to affect Chicago’s occupational structure. 2000 Chicago: Occupation and Income Data (See file DEC_00_SF4_DP3 for exact data) The 2000 census data demonstrate an entrenchment of a ‘new economy’ within Chicago City. According to its data, the vast majority of the city’s workforce has now belonged to various service workers’ categories, with the ‘middle-class’ managerial and professional strata likewise playing an important role. Of 1,357,461 individual that comprised Chicago’s civilian labor force in the year of 2000, merely 137,421 were officially registered as unemployed. Yet, at the same time, 38.7% of population 16 years or over were not in labor force, which signified a high level of welfare system pressure that has become typical for post-1980 America. In a more specific way, Chicago’s labor force may be considered generally service-oriented now; occupations designated as ‘service’ attracted 202,335 people, while sales and office occupations drew in 329,718 of the city’s labor force. In contrast, production, transportation and material moving occupations encompassed mere 198,148 workers, while 80,245 persons worked in construction, extraction and maintenance (U.S. Census Bureau, “Census 2000 Summary”). This meant that in the terms of labor market, Chicago’s industries were decisively outranked by its services. Another side of a post-Fordist class structure increased its numbers as well. According to 2000 Census data for Chicago, the number of employees working in management, professional and related occupations reached the mark of 408,446 – thus comprising 33.5% of the labor force’s total (U.S. Census Bureau, “Census 2000 Summary”). When one takes into account the industrial dimension, a situation may appear even more one-sided. In 2000, altogether 17.5% of Chicago’s workers were employed in construction and manufacturing, while educational, health and social services alone accounted for 19.0% of labor force’s employment. The other major services sub-sectors at that time included: Professional, scientific, management, administrative, and waste management services – 166,094 (13.6%); Finance, insurance, real estate, and rental and leasing – 111,130 (9.1%); Retail trade – 108,245 (8.9%), and; Arts, entertainment, recreation, accommodation and food services – 103,263 (8.5%). Such sectors as information and public administration services, nonetheless, still played relatively minor roles, accounting for 3.4% and 4.8% of Chicago’s labor force, accordingly. Income structure of the year of 2000 was similarly much more skewed toward the ‘middle-class’ core than it was usually the case in the 1990s. 13.8% of total household numbers were categorized as obtaining an income of less than $10,000 annually, while merely 2.5% of the city’s population belonged to households possessing annual income of more than $200,000 (U.S. Census Bureau, “Census 2000 Summary”). Between these two statistical extremities, 8 more income categories were specified, with the most populous one encompassing those groups of the population that usually gained between $50,000 and $74,999 per annum (188,700 – 17.9%). Nevertheless, median household income was estimated at $38,625 per household. In general, the occupation and income variables typical for a 2000 Chicago population point at an important shift towards the overwhelmingly service-based, ‘white-collar’, economy that stood in a dramatic contrast with the pre-1980 social and industrial organization patterns. This may be directly related with the city’s ongoing neoliberal transformation. 2006-2010 American Community Surveys In the period of 2006 to 2010, a number of Community Surveys were taken in the City of Chicago, as well as in the other cities of the USA. While their data are generally relative and lack the rigor of Census methodology, it is still important enough to analyze the Community Surveys’ findings. (Refer to file OCCUPATION BY SEX AND MEDIA EARNINGS IN THE PAST 12 MONTHS… AND INDUSTRY BY OCCUPATION FOR THE CIVILIAN EMPLOYED POPULATION… IN THE DRAFT FILE) The following key conclusions may be made out of this dataset: The full-time civilian occupation among persons aged 16 or over had really declined in the period of 2006-2010. Among male workforce, it did not exceed 54.9%, while among females the situation was even starker, approaching mere 45.1%. Such finding sits well with the basic suppositions of the post-Fordist paradigm of studies of economic restructuring, for it is first and foremost the result of the shift towards precarious and casualized employment that these changes may be attributed to (Theodore). The more specific occupational structure of the city’s laboring population continued its steady evolution toward the service-based post-Fordist model. Estimates inferred from the 2006-2010 American Community Surveys show that of the total of 1,252,656 Chicago’s civilian labor force, only 125,947 workers were employed in manufacturing, with the other 60,502 having found their employment in construction. One may contrast those figures with the ones given for educational services, health care, and social assistance (267,005). All the other services that were mentioned above in an analysis of the 2000 Census results, likewise, secured their dominant situation in the general occupational structure. This may point to the enduring nature of these processes at hand. The gender structure of Chicago’s labor force in this period exhibited both fairly ‘conservative’ elements (e.g., 97.1% of workers in construction and extraction occupations were male, while 60.9% of community and social services workers being female) and some innovative trends, pointing at the shift occurring in gender relations at workplace. For instance, according to 2006-2010 ACS estimates, 50.6% of management, business, science, and arts employees were female, with 49.6% of business and financial operations positions being occupied by female workers. Among legal sphere employees, 47.0% were now female. These figures demonstrate conclusively that certain prestigious occupations that were previously male-dominated were now open to female members of the middle-class. 2010 Census Data and Their Significance The unemployment comparison for Chicago Metropolitan Area and the U.S. in general, made in 2012, demonstrates the relatively high level of unemployment in Chicago. This development may be explained by continuing impact of the 1980s de-industrialization, which hit Chicago, with its historical dependence on manufacturing, far sharper than some other areas of the U.S. (Rast). Table 3: Chicago’s Labor Force High Education Statistics These data demonstrates a basically post-Fordist makeup of Chicago’s labor force in current historical period. Note that in term of number of labor force, manufacturing (410,800) fell behind not even professional and business services (694,300), but even public services (referred to as ‘government’; 544,900). On the other hand, financial services and information sector do not play such a high role they took in other metropolitan areas (e.g. New York City and Los Angeles). Despite the fall in manufacturing activities, Chicago’s per capita income is still higher than the national average. However, such data may mask rather significant structural inequalities among labor force at large. Source: U.S. Census Bureau (2010). As it may be seen from this table, the percentage of persons in poverty remained virtually unchanged for the period between 1990 and 2009. However, this may be a consequence not of maintenance or reduction in poverty rate, but rather of more pronounced regional distribution of the latter. For instance, the county of Lake experienced the significant rise in poverty rate (from 5.2.% in 1990 to 7.2.% in 2009), while the county of McHenry virtually doubled this variable (from 3.5.% to 7.0%, accordingly). Map 1: Poverty Rates Distribution among Chicago’s Region On the other hand, median salaries for top CEOs and similar categories are clearly on the rise. Their relative increase in comparison with the U.S. average may be taken as a sign of a more corporate-friendly climate that came to characterize Chicago – and, coupled with the greater unemployment rate (see above), of a greater social differentiation. Table 5: Chicago’s Regional Economy Shifts from Manufacturing to Service-Based Model, 1980-2010 Works Cited (in this text) Dual City: Restructuring New York. Ed. by Mollenkopf, John H., and Castells, David. New York, N.Y.: Russell Sage Foundation, 1992. Print. Harvey, David. Spaces of Global Capitalism. London: Verso, 2006. Print. Missouri State Census Data Center. Basic Demographic Trend Report: Area of Chicago.” Mcdc.missouri.edu, 1999. Web. 20 August 2012. Rast, Joel. “Manufacturing Decline: The Politics of Economic Change in Chicago, 1955-1998.” Journal of Urban Affairs 23.2 (2001): 175-190. Print. Theodore, Nik. “Political Economies of Day Labor: Regulation and Restructuring of Chicago’s Contingent Labour Markets.” Urban Studies 40.9 (2003): 1811-1828. Print. U.S. Census Bureau. “Profile of Selected Economic Characteristics (Chicago, Illinois), 2000.” Factfinder.census.gov, 2008. Web. 17 August 2012. Bibliography (to provide further guidance on the work; the text from Bibliography will be sent in additional archive in PDFs) Bennett, Larry, Bennett, Michael, and Koval, John. “Communities and Community Development in Chicago: Past, Present, and Future.” The Conference on Chicago Research and Public Polcy “The Change Face of Metropolitan Chicago”, May 2004. Web. 15 August 2012. Giloth, Robert, and Betancourt, John. “Where Downtown Meets Neighborhood: Industrial Displacement in Chicago, 1978-1987.” Journal of the American Planning Association 54.3 (1988): 279-290. Print. Lloyd, Richard. “Neo-Bohemia: Art and Neighborhood Redevelopment in Chicago.” Journal of Urban Studies 24.5 (2002): 517-532. Print. Neckerman, K.M. “Out of the Loop? A Comment on David Reingold’s Analysis of Inner-City Employment.” Economic Development Quarterly 13.4 (1999): 315-317. Print. Nyden, Philip, Edlynn, Emily, and Davis, Julie. “The Differential Impact of Gentrification on Communities in Chicago.” Chicago: Center for Urban Research and Learning, Loyola University. Web. 22 August 2012. Oakley, Deirdre, and Burchfield, Keri. “Out of the Projects, Still in the Hood: The Spatial Constraints on Public-Housing Residents’ Relocation in Chicago.” Journal of Urban Studies XX.X (2009): 1-26. Print. Perez, Gina M. “The Other “Real World”: Gentrification and the Social Construction of Space in Chicago.” Urban Anthropology and Studies of Cultural Systems and World Economic Development 31.1 (2002): 37-68. Print. Sutles, Gerald D. The Man-Made City: The Land-Use Confidence Game in Chicago. Chicago, IL: University of Chicago Press, 1990. Print. Talen, Emily. “The Context of Diversity: A Study of Six Chicago Neighborhoods.” Urban Studies 47.3 (2010): 486-513. Print. Wilson, David, and Wouters, Jared. “Successful Protest-Community Discourse: Spatiality and Politics in Chicago’s Pilsen Neighborhood.” Environment and Planning 36.A (2004): 1173-1190. Print. Wolf, Garrett. “A City and Its River: An Urban Political Ecology of the Loop and Bridgeport in Chicago.” MA Thesis Lousiana St. U., 2012. Web. 5 August 2012. Wyly Elvin K., and Hammel, Daniel J. “Capital’s Metropolis: Chicago and the Transformation of American Housing Policy.” Geografiska Annaler 83B.4 (2000): 181-206. Print. Zielenbach, Sean. “Understanding Community Change: A Look at Low-Income Chicago Communities in the 1990s.” Urban.org. Urban Institute, 1 February 2005. Web. 1 August 2012. Zhang, Yue. “Boundaries of Power: Politics of Urban Preservation in Two Chicago Neighborhoods.” Urban Affairs 47.4 (2011): 511-540. Print. Read More
Cite this document
  • APA
  • MLA
  • CHICAGO
(“Chicago as global city_Census analysis_1980, 1990, 2000, 2010 Dissertation”, n.d.)
Retrieved from https://studentshare.org/e-commerce/1400003-chicago-as-global-citycensus
(Chicago As Global city_Census analysis_1980, 1990, 2000, 2010 Dissertation)
https://studentshare.org/e-commerce/1400003-chicago-as-global-citycensus.
“Chicago As Global city_Census analysis_1980, 1990, 2000, 2010 Dissertation”, n.d. https://studentshare.org/e-commerce/1400003-chicago-as-global-citycensus.
  • Cited: 0 times

CHECK THESE SAMPLES OF Chicago as Global City: Census Analysis

The Market Analysis and the Company Analysis of the University of Chicago Medical Center

The report will describe the market analysis as well as the company analysis of University of Chicago Medical Center and its strengths and weaknesses in the health care industry of Chicago, its competitors and market environment.... Situation analysis 4 3.... Company analysis 4 3.... Customer analysis 5 3.... Competitor analysis 5 3.... Environmental analysis 9 3.... Situation analysis 3....
9 Pages (2250 words) Essay

Reverse White Flight

iterature Review A close analysis of the statistics from the census bureau produces intriguing implications on the changing ratios of different cities and suburbs.... The statistics from the census bureau reflect that the reverse flight is a reality.... This resarch paper "Reverse White Flight" discusses dynamics in the demographics of some regions in America that reflect the realities of the increasing racial differences....
6 Pages (1500 words) Research Paper

Racial and Ethnic Differences: African Americans

The essay "Racial and Ethnic Differences: African Americans" focuses on the critical analysis of the racial and ethnic differences in the US and how race and ethnicity are perceived in the US context.... The African-American ethnic group is selected to analyze an American society....
11 Pages (2750 words) Essay

Brazil as an emerging market

Brief analysis of Brazil's market history and evolution Brazil as an emerging market possesses a history that is rooted in the preference for robust domestic activity as against export demands.... Brazil GDP Growth Rate, 2008 to 2012 Source: Trading Economics (2013) Significant characteristics of the market, its evolution, and changes Young and Growing Labor Population Right from the history of the country when the first population census was held after colonization in 1872, Brazil has kept a very high population growth rate of 2....
4 Pages (1000 words) Assignment

Development of a Conference Centre in London

The paper "Development of a Conference Centre in London" states that the analysis of the political, economic, social and technological factors for a London-based conference center has revealed a series of opportunities and threats for such an undertaking.... ... ... ... Decisions related to technology acquisition should be carefully taken....
8 Pages (2000 words) Case Study

15 topics about sociology

The United States and Canada soon followed in the wake of their European counterparts as At present, a majority of the world's population has or is living in a city; and yet, it was only about 100 years ago when there were only about 12 cities in existence.... And “we now live in an urban world where the mega-metropolises: Tokyo-Yokohama and greater Mexico city have populations of over 20 million” (Palen, p....
12 Pages (3000 words) Essay

Efficacy of Three Modes of Weight Loss Intervention

Obesity as a global health problem is widely recognized.... While the world sees the significance of obesity as a global epidemic, there seems to be less recognition that the prevalence of obesity is higher among women and that obesity presents differential health risks in women....
9 Pages (2250 words) Essay

Melbourne Water and Werribee Sewage System

The "Melbourne Water and Werribee Sewage System" paper highlights the water needs in Melbourne city because of the growing population.... Specifically, there is a growing need for sewage systems in the Werribee suburbs because of the ever-increasing population to improve the health status of the suburb....
7 Pages (1750 words) Case Study
sponsored ads
We use cookies to create the best experience for you. Keep on browsing if you are OK with that, or find out how to manage cookies.
Contact Us