StudentShare
Contact Us
Sign In / Sign Up for FREE
Search
Go to advanced search...
Free

Analysis of Chimeric Proteins by Fluorescence Microscopy and Western Blotting - Lab Report Example

Cite this document
Summary
This work called "Analysis of Chimeric Proteins by Fluorescence Microscopy and Western Blotting" describes western blotting, processing of the blot, development of the membrane. The author takes into account that during this experiment the EYFP protein was a functional protein since it fluoresced…
Download full paper File format: .doc, available for editing
GRAB THE BEST PAPER92.6% of users find it useful
Analysis of Chimeric Proteins by Fluorescence Microscopy and Western Blotting
Read Text Preview

Extract of sample "Analysis of Chimeric Proteins by Fluorescence Microscopy and Western Blotting"

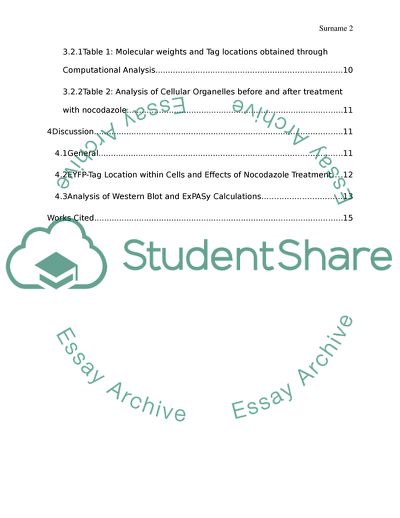
Analysis of Chimeric Proteins by Fluorescence Microscopy and Western Blotting Contents 1Materials 3 2Methods 4 2.1SDS-PAGE 4 2.2Western Blotting 5 2.3Processing of the Blot 5 2.4Development of the membrane 6 2.5Analysis of the Localization of EYFP protein 6 3Results 7 3.1Determining EYFP Chimera Molecular Weights using the Western Blot 7 3.1.1Figure 1: Image of blot showing Tubulin, Actin, Golgi, and Mitochondrial proteins 8 3.1.2Figure 2: Curve produced from precision plus molecular weight standard 9 3.2Computational Analysis using the ExPASy tool 9 3.2.1Table 1: Molecular weights and Tag locations obtained through Computational Analysis 10 3.2.2Table 2: Analysis of Cellular Organelles before and after treatment with nocodazole 11 4Discussion 11 4.1General 11 4.2EYFP-Tag Location within Cells and Effects of Nocodazole Treatment 12 4.3Analysis of Western Blot and ExPASy Calculations 13 Works Cited 15 1 Materials 4 chimeric protein samples that have been transfected: Mitochondrial (MIT) Golgi (GOL) Actin (ACT) Tubulin (TUB) Non-transfected Hepa-1 cells as negative control 18-well Biorad 10% polyacrylamide gel. Precision Plus Protein Standard Molecular Weight Marker 6 microfuge tubes 1X Running Buffer (0.192 M glycine, 0.25 M Tris, 0.1% SDS) 1X Transfer Buffer (0.048 M Tris, 0.039 M glycine, 0.037% SDS, 20% methanol, pH 8.3) Laemmli Buffer Heating block Centrifuge Vortex Deionized H2O Pipetman micropipette (200 ul and 1000ul) Electrophoresis gel apparatus Micropipette tips for SDS-PAGE Transfer clamp Nanopure distilled H2O 1 Nitrocellulose paper 4 pieces Whatmans 3MM®blotting paper Scotchbrite® pads 2 pipette tip box lids (one small, one large) Rocking platform 5% dry milk solution PBS solution (0.137 M NaCl, 2.7 mMKCl, 10 mM NaHPO4, 2 mM KH2PO4, pH 7.4) TBS-T (0.027 M KCl, 0.137 M NaCl, 0.05 M Tris, 0.03% Tween-20) TBS (0.1M NaCl, 0.5 M Tris) Primary Antibody (Living Colors EYFP Rabbit; 1:100 dilution) Secondary Antibody (Jackson Immunoresearch anti-rabbit, goat; 1:1000 dilution) BCIP/NBT solution 2 Methods 2.1 SDS-PAGE An SDS-PAGE gel 9-10 % containing 18 wells was obtained from the TA by cutting the package while wearing gloves. The gel cassette was then rinsed with de-ionized water. The tape at the bottom of the gel was removed and the gel put into the apparatus, which was then filled with 1X running buffer (0.192 M glycine, 0.25 M Tris, 0.1% SDS). The samples were then heated for one minute and centrifuged before loading. 20 ug of the six protein samples were loaded onto each of the lanes by underlaying them into the well. After loading was complete, the gel was then run at 200 volts untill the dye front reached the bottom of the gel (for about 1 hour). The apparatus was disassembled and the gel carefully removed to avoid its destruction. 2.2 Western Blotting A piece of nitrocellulose membrane labeled the lab group name (when wet) was submerged in nanopure water and left until it was ready for use. The nitrocellulose membrane was removed from the water and carefully laid on top of the gel to contact the side with the writing. The transfer blot was assembled by layering each of the components as follows: bottom Scotchbrite 3MM® pad, blotting paper, polyacrylamide gel, nitrocellulose membrane, another piece of blotting paper, and the top Scotchbrite 3MM® pad. The components were placed carefully so that no bubbles formed between them. One side of the transfer clamp was placed in the bottom of the tray, which was then filled with the buffer (0.048 M Tris, 0.039 M glycine, 0.037% SDS, 20% methanol, pH 8.3). The orientation of the sandwich was such that it allowed the transfer of protein to the nitrocellulose side of the sandwich (+ pole). The top was put on and the transfer run at 100mA for about 1 hour. 2.3 Processing of the Blot The sandwich was disassembled and placed in a tray. Ponceau S dye solution was added to cover the blot and then swirled for a few seconds. The solution was dumped back into the bottle and the blot rinsed with distilled water to destain it, which allowed for the bands in each of the lanes to be observed. The observations of the patterns were recorded immediately before the bands faded. After washing the dye off, the blot was blocked with 5% dry milk solution and then incubated for 30 minutes. It was then washed several times using a PBS solution (0.137 M NaCl, 2.7 mMKCl, 10 mM NaHPO4, 2 mM KH2PO4, pH 7.4). The sandwich was placed in a tray with 15mL TBS solution (TBS;0.1M NaCl, 0.5 M Tris) for a few minutes and then a primary EYFP-binding antibody (1:100 dilution ratio of antibody to milk) added to submerge the membrane. It was then left incubated for 45 minutes to allow for staining to complete. 10mL of TBST solution (0.027 M KCl, 0.137 M NaCl, 0.05 M Tris, 0.03% Tween-20) was used to wash the membrane. It was then washed two times with 20mL TBST solution at an interval of 8 minutes. A secondary antibody solution was added after the removal of the TBST and then left for 35 minutes to stain. It was then rinsed using TBST with the same procedure and after the final wash it submerged in TBS. 2.4 Development of the membrane The blot was developed using a BCIP/NBT solution to produce a dark blue pigment. The pigment was produced due the metabolism of the EYFP antibodies by the alkaline phosphatase enzyme. From the TBS solution, the membrane was transferred to container with 8mL BCIP/NPT solution. The container was swirled until banding patterns were produced in the lanes. It was then rinsed with distilled water for a few minutes so as to stop the reaction and the bands measured immediately. 2.5 Analysis of the Localization of EYFP protein The ExPASy isoelectric point, molecular weight calculator and the BLAST (amino acid and nucleotide sequence analyzing tool) were in used in the analysis. The molecular weight of each of the four EYFP chimeras (experimental value) was compared with the theoretical values. The amino acid progression (which was used to calculate the molecular mass) of the chimeras was determined using the ExPASy tool. The GFP nucleotide sequence was used in the BLAST analysis to identify the source of GFP protein and also to determine the protein’s amino acid sequence. This order was also run in BLAST to find the relative position of the EYFP protein on the mitochondrial chimera. The difference between the mass of the EYFP and each of four chimeras was calculated to determine the actual molecular weight of the cellular components before adding the tags. 3 Results 3.1 Determining EYFP Chimera Molecular Weights using the Western Blot Figure 1 below displays the immunoblot labeled with molecular weights (Kilodaltons). The banding patterns are highlighted in different colors in each of the lanes to allow for ease in visualization and determining the weights. The Mitochondrial lane produces bands with the higher band producing 25kDa. The tubulin had the highest weight at 75kDa. The actin and golgin produced weights of 65 and 30kDa respectively. 3.1.1 Figure 1: Image of blot showing Tubulin, Actin, Golgi, and Mitochondrial proteins The blot was done on an 18-wellBiorad (10% polyacrylamide gel) running at 200V for one hour. It was then mixed in an EYFP binding primary antibody, secondary antibody, and a solution of NBT/BCIP, which produced the banding pattern as shown in the above figure. A standard Protein Precision Plus molecular weight marker with a range of 10-250 kDa was used, but the proteins only produced bands between 37-150 kDa. 3.1.2 Figure 2: Curve produced from precision plus molecular weight standard The blot was done on an 18-wellBiorad (10% polyacrylamide gel) running at 200V for one hour. It was then mixed in an EYFP binding primary antibody, secondary antibody, and a solution of NBT/BCIP. The curve was produced from the range of 10-250kDa. The Rf values were obtained by diving the distance travelled by the bands with the dye front. 3.2 Computational Analysis using the ExPASy tool The nucleotide series of the wild-type GFP was achieved using the ExPASy translation tool. The molecular weights were then calculated from the sequence using the isoeletric point tool on ExPASy. The results were recorded in table 1 below. The location of the tag on the peptide was also determined using the sequence. The actin and tubulin tags were positioned at the N terminus, while the mitochondrial and golgi tags at the C terminus. Chimera Experimental Molecular Weight Computational Molecular Weight Molecular Weight with noEYFP-tag Tag Location (N or C terminus) EYFP - 26.87 - - Mito 28.72 30.76 3.890 C terminus Golgi 35.14 36.02 9.150 C terminus Actin - 69.44 42.57 N terminus Tubulin - 77.75 50.88 N terminus 3.2.1 Table 1: Molecular weights and Tag locations obtained through Computational Analysis The blot was done on an 18-wellBiorad (10% polyacrylamide gel) running at 200V for one hour. It was then mixed in an EYFP binding primary antibody, secondary antibody, and a solution of NBT/BCIP .The molecular weights were obtained through the ExPASy tool using the relative sequences for the chimeras. The Tag location was determined through comparison of the translational of original GFP protein Analysis of the Cell lines Cellular Responses to the Treatment with Nocodazole Pictures of the Hepa-1 and A7 cells were provided by the TA. Both hepa-1 and A7 cells were separated after addition of Nocodazole. Nocodazole is a reagent, which influences the polymerization of microtubules (Pollenz et al, 2008). On exposure to the reagent, both organelles underwent changes as listed in the table below. The alterations were as a result of transfecting the cells with plasmids that contained chimera. The chimera encoded for chimeric proteins with the attached EYFP tag. According to Pollenz et al. (2008), EYFP differs from the wild-type GFP since it has six substitutions of amino acids that change the emission of light to yellow hue. Hepa-1 Hepa-1 (with nocodazole) A7 A7 (with nocodazole) Mitochondria The mitochondria cannot be seen The mitochondria are discernible since they are scattered throughout the cell The mitochondria are collected together The mitochondria can easily be discerned Golgi Apparatus The Golgi Apparatus was accumulated in only one area near the nucleus The makeup of Golgi Apparatus was disrupted and scattered through the cell The Golgi Apparatus are accumulated in one area of the cell near the nucleus The makeup of Golgi Apparatus was disrupted and scattered through the cell 3.2.2 Table 2: Analysis of Cellular Organelles before and after treatment with nocodazole The Mitochondria and Golgi were observed using the fluorescence microscopy and cells that were transfected with plasmids containing EYFP tags. This table describes the changes to the organelles before and after adding the reagent. 4 Discussion 4.1 General 1. The gel sandwich was aligned in the specified position so as to place the gel closer to the negative end of the power source and also the nitrocellulose nearer to the positive end. The choice of the arrangement was because the proteins were induced with a negative charge due to the treatment with SDS, Sodium dodecyl sulfate. It too allowed the proteins to move towards the cathode against the tissue layer. If the apparatus was set up in the opposite orientation, the proteins would have shifted to the blotting paper, so giving the experiment without meaningful consequences. 2. The blocking solution was employed to foreclose non-specific binding. It warded off the binding of immunoblot with various cellular membrane constituents so as to separate the target proteins on the stain. 3. A homogenate of non-transfected Hepa-1 cells were included as a negative control to prevent them from producing a banding pattern that could be misinterpreted when analyzing the other lanes that had been transfected with the plasmid. If a banding pattern was brought out in the negative control, lane, it would suggest that the primary antibody did not show specific binding to the EYFP-tags. This would render the data not be practicable. Still, no banding pattern was brought out in the negative control, lane, which proved that the data was free of fault. 4. It is important to load the same measure of proteins for each of the samples so as to guarantee a uniform concentration in the proteins respective lanes. This allowed for deviations between the banding patterns to be understood. 4.2 EYFP-Tag Location within Cells and Effects of Nocodazole Treatment 1. The form of expression between the protein samples was different. Equally it is evidenced in Figure 1/Table 1, tubulin had the greatest molecular weight, which was followed by actin, geology, and mitochondria. It is not possible to make connections between the degree of fluorescence with the calculated molecular weights for all four proteins, since chimeras for actin and tubulin were not usable. Nonetheless, it is acknowledged that tubulin makes up the alpha and beta dimmers that compose microtubules (Campbell & Reece, 2008). It is therefore cogent for tubulin to have the greatest molecular weight 2. It is not possible to compare mitochondrial and golgi expression in terms of fluorescence versus the amount detected on the blot to that of tubulin and actin. This is because actin and tubulin chimeras were not analyzed in a western blot. Between mitochondrial and Golgi expression, the cells seem to fluoresce more in the images of the mitochondria Hepa-1 cells than that of the Golgi Hepa- 1 cells; still, the blot revealed that the Golgi had a higher molecular weight than that of the mitochondria as shown in table 1. This is because mitochondria are hollow pipes and deliver a big surface area by which to fluoresce; Golgi is more localized, with dense structures, and the data prove that Golgi has a larger molecular weight. 3. A form of expression was picked out in the two cell lineages and their relative cellular function. It was noted that the EYFP-tags in both the Golgi and mitochondria were more concentrated in Hepa-1 cells than that of the A7 cells. It was also observed that the Hepa-1 cell images resolved much more clearly than that of the images produced from the A7 cells. These patterns are likely due to the anatomical location from which the cells were isolated. It is understood that hepatoma cells derived from a mouse liver tumor using the golgi in the production of lipids and enzymes, and also the mitochondria in the production of ATP, more so than that of smooth muscle myoblasts from rat smooth muscle (Zamzani et al., 1998). 4. The western blot images observed forboth mitochondria and golgi in Hepa-1 cells before and after treatment with nocodazole, responded similarly to the reagent. Nocodazole was used to settle delocalization of sub-cellular components, which occurred after the cell was treated with shown in table 1. 5. There was a potential difference in the position of the EYFP chimeras in the presence and absence of the nocodazole reagent in Hepa-1 cell line and A7 cell line due to the fact that microtubules play a part in regulating the proportional distribution of both the mitochondria and the Golgi. Since nocodazole largely affected the mitochondria and Golgi, it is speculated that these organelles are dependent upon microtubules due to the fact that nocodazole causes microtubules to depolymerize and dissociate. 4.3 Analysis of Western Blot and ExPASy Calculations This experiment showed that the EYFP protein was a functional protein since it fluoresced; however. Proteins can be rendered dysfunctional when tagged with other proteins such as EYFP (Shaner, Paul and Roger 905). This phenomenon is likely because the protein can experience structural changes as a consequence of chemical signaling. Therefore, if the protein tag disables the protein from undergoing structural changes, then the protein will lose its purpose. If the absorption of the EYFP actin and tubulin proteins were half that of the EYFP mitochondria and Golgi levels in the Hepa-1 cells, the outcome would be a crucial function that both the geology and mitochondria serve within hepatoma cells in a mouse liver tumor. One of the primary functions of the mitochondria is the output of ATP, and the Golgi generates lipids, then the liver tumor requires the output of these organelles to be to a greater extent than that of actin and tubulin proteins (Zamzani et al., 1998). The translation of the mitochondrial proteins and Golgi proteins are therefore amplified so as use their wares. Works Cited Campbell, Neil and Jane Reece. Biology. New York: Pearson, 2008. Shaner, Nathan, Paul Steinbach, and Roger Ytsien. "A guide to choosing fluorescent proteins." Nature Methods 2.12 (2005). Web. . Zamzami N, Brenner C, Marzo I, Susin SA, Kroemer G.Oncogene 16 (1998): 2265– 2282. Article | PubMed. Read More
Cite this document
  • APA
  • MLA
  • CHICAGO
(Analysis of Chimeric Proteins by Fluorescence Microscopy and Western Blotting Lab Report Example | Topics and Well Written Essays - 2500 words, n.d.)
Analysis of Chimeric Proteins by Fluorescence Microscopy and Western Blotting Lab Report Example | Topics and Well Written Essays - 2500 words. https://studentshare.org/biology/1846810-analysis-of-chimeric-proteins-by-fluorescence-microscopy-and-western-blotting
(Analysis of Chimeric Proteins by Fluorescence Microscopy and Western Blotting Lab Report Example | Topics and Well Written Essays - 2500 Words)
Analysis of Chimeric Proteins by Fluorescence Microscopy and Western Blotting Lab Report Example | Topics and Well Written Essays - 2500 Words. https://studentshare.org/biology/1846810-analysis-of-chimeric-proteins-by-fluorescence-microscopy-and-western-blotting.
“Analysis of Chimeric Proteins by Fluorescence Microscopy and Western Blotting Lab Report Example | Topics and Well Written Essays - 2500 Words”. https://studentshare.org/biology/1846810-analysis-of-chimeric-proteins-by-fluorescence-microscopy-and-western-blotting.
  • Cited: 0 times

CHECK THESE SAMPLES OF Analysis of Chimeric Proteins by Fluorescence Microscopy and Western Blotting

How to use a Microscope

A microscope is a biological instrument designed to give finer details of an object that an observer could not see using naked eyes or a hand lens.... An object under observation is a specimen.... There are several types of microscopes including the light microscope.... hellip; This microscope is also called the optical microscope uses light to illuminate a specimen....
5 Pages (1250 words) Essay

Topics in pharmacology and biomedical science

Bezolla,1992) Case study 2: Growth plate cartilage for fluorescent based cell volume analysis Methanol will be best suited because there is no necessity to preserve the cytoplasmic or nuclear details and at the same time they will precipitate the proteins and preserve the glycogen for analysis of cell volume.... Case study 4: Human kidney to be bisected and used as an anatomical demonstration Model Formalin and Glutaraldehyde would be ideally suited to keep the integrity of the tissue more than acetone or methanol which will make the tissue brittle and frozen sections can be used because there is no quantitative analysis of the cell volume....
3 Pages (750 words) Essay

Immunolocalization of the microtubule cytoskeleton

The most prominent methods are: western blot, spectrophotometry, enzyme assay, immunoprecipitation and immunostaining.... Fluorescent molecules can be visualised using fluoresence microscopy.... proteins are probably the most diverse substances found in the cells found in both the single and multicellular organisms.... Estimated around 10 000 different proteins, each protein has its specific function.... Cellular functions are often localized in specific compartments of the cell, and being able to localize the unknown proteins may provide important information in determining the function of the proteins....
5 Pages (1250 words) Essay

Peroxisomes research

The cells were resuspended in 1mL low fluorescence media (YNB).... tatistical analysis: Each sample were measured six times and standard deviation was determined.... Yeast strains were grown in 5 ml YPD for 18h at 30°C.... The cells were spin down and were washed twice with 1ml low fluorescent media (YNB)....
5 Pages (1250 words) Article

Immunoassay Techniques: Fluorescence Resonance Energy Transfer and Western Blotting

When using the IgG immunoglobulin proteins in western blotting electrophoretically separated standard proteins are used to estimate the size of the IgG protein.... A vertical slab gel apparatusNitrocellulose paper and filter paper, blotting paper cut to sizeBlotting electrodesBlotting buffer -20% methanol and pH above 7.... Another method is the western Blot.... (Rybicki 1996) For the enzyme-assisted immunoelectroblotting (IEB) or western blot the following equipment is typical....
7 Pages (1750 words) Essay

Basic Tissue Processing for Routine Light Microscopy

(Histotechniques)Light microscopy is the most common type used in the biological lab for tissue processing.... A great advantage of light microscopy compared to acoustical microscopy is the fixation; sectioning and the staining techniques are optimized.... Automated tissue processing has been achieved in the 'technical' tissue processor but it does not allow the light microscopy tissues to be processed in a fully automated environment....
1 Pages (250 words) Article

The Overall Characteristic of the Microtubules

The speed of spoilage of the microtubules is influenced by factors like proteins that bind along their... They are composed of subunits.... They have a propensity for dynamic instability.... Hence, they have a characteristic random growth nature.... Various aspects spoil microtubules such as the rate of dehydrolisation....
6 Pages (1500 words) Essay

Western Blotting which is Used to Isolate Myosin Light Chain

The paper 'western blotting which is Used to Isolate Myosin Light Chain' presents protein blotting that is a potent as well as an important technique for the immunodetection of proteins subsequent to electrophoresis, especially proteins that are present in low quantities/ abundance.... In this technique, proteins separated on sodium dodecyl sulfate-polyacrylamide gel electrophoresis What is more, western blotting helps scientists isolate specific proteins, e....
5 Pages (1250 words) Research Paper
sponsored ads
We use cookies to create the best experience for you. Keep on browsing if you are OK with that, or find out how to manage cookies.
Contact Us