StudentShare
Contact Us
Sign In / Sign Up for FREE
Search
Go to advanced search...
Free

Obesity and Hunger - Assignment Example

Cite this document
Summary
The main objective of the following assignment "Obesity and Hunger" is to investigate whether the perception of hunger is different for overweight people. The results suggested that an individual’s stomach condition (empty or full) and weight have a significant effect on individuals eating behavior…
Download full paper File format: .doc, available for editing
GRAB THE BEST PAPER92.4% of users find it useful
Obesity and Hunger
Read Text Preview

Extract of sample "Obesity and Hunger"

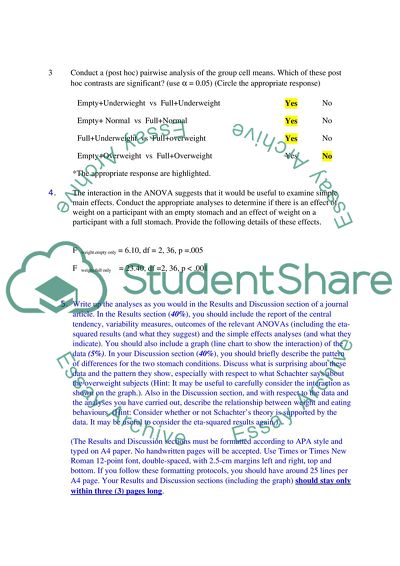
Section A Part 1: Background In 1968, Schachter published one of the first studies on obesity and eating behaviour. The theory that emerged from this literature was that overweight individuals do not respond to their internal, biological signals of hunger in the same way that normal weight and underweight people do. In other words, people who are overweight tend to eat regardless of whether or not they are hungry. In Schachter’s paradigm, participants were told that they were participating in a “taste test”. Each participant came to the laboratory after fasting for 12 hours. Just before the “taste test”, half the participants were given a full meal and could eat as much as they wanted, and half were not given any food at all. One hour later, a range of hors d’oeuvres were spread out on a table in front of the participant. The participant was asked to provide a rating on a scale of 0 (yucky) to 5 (extremely delicious) for each type of hors d’oeuvre. The experimenter then left the room so that the participant could “taste test” in private. After the participant finished their task, Schachter measured the amount of food (in grams) eaten by the participants. The data are provided in an SPSS file named >P1Background. Part 2: Assignment Task Conduct the appropriate SPSS analyses to answer the following questions. 1. Complete the following Summary Table. Source SS df MS F Stomach 2229.35 1 2229.35 114.53 Weight 281.26 2 140.63 7.22 Stomach x Weight 824.54 2 412.27 21.18 Error 1401.54 72 19.47 Total 4736.68 77 2. Calculate 2 for the main effects and the interaction in the space below. In doing so, do not rely on the SPSS output which provides different values to what are typically reported. 3 Conduct a (post hoc) pairwise analysis of the group cell means. Which of these post hoc contrasts are significant? (use  = 0.05) (Circle the appropriate response) Empty+Underwieght vs Full+Underweight Yes No Empty+ Normal vs Full+Normal Yes No Full+Underweight vs Full+overweight Yes No Empty+Overweight vs Full+Overweight Yes No *The appropriate response are highlighted. 4. The interaction in the ANOVA suggests that it would be useful to examine simple main effects. Conduct the appropriate analyses to determine if there is an effect of weight on a participant with an empty stomach and an effect of weight on a participant with a full stomach. Provide the following details of these effects. F weight.empty only = 6.10, df = 2, 36, p =.005 F weight.full only = 23.40, df =2, 36, p < .001 5. Write up the analyses as you would in the Results and Discussion section of a journal article. In the Results section (40%), you should include the report of the central tendency, variability measures, outcomes of the relevant ANOVAs (including the eta-squared results (and what they suggest) and the simple effects analyses (and what they indicate). You should also include a graph (line chart to show the interaction) of the data (5%). In your Discussion section (40%), you should briefly describe the pattern of differences for the two stomach conditions. Discuss what is surprising about these data and the pattern they show, especially with respect to what Schachter says about the overweight subjects (Hint: It may be useful to carefully consider the interaction as shown on the graph.). Also in the Discussion section, and with respect to the data and the analyses you have carried out, describe the relationship between weight and eating behaviours. (Hint: Consider whether or not Schachter’s theory is supported by the data. It may be useful to consider the eta-squared results again.). (The Results and Discussion sections must be formatted according to APA style and typed on A4 paper. No handwritten pages will be accepted. Use Times or Times New Roman 12-point font, double-spaced, with 2.5-cm margins left and right, top and bottom. If you follow these formatting protocols, you should have around 25 lines per A4 page. Your Results and Discussion sections (including the graph) should stay only within three (3) pages long. Results A Factorial ANOVA was conducted on the amount of food eaten by the participants for empty and full stomach conditions and with three weight groups underweight, normal and overweight. Figure 1: Plot of amount of food eaten by stomach condition and weight of the participants Figure 1 shows the plot of amount of food eaten by stomach condition and weight of the participants. There appear differences in the amount of food eaten based on the stomach condition and the weight of the participants. From the overall ANOVA, there was a significant main effect of the stomach condition of the participants, on the amount of food (in grams) eaten by the participants, F(1, 72) = 114.53, p < .001. There was a significant main effect of the weight of the participants, on the amount of food eaten by the participants, F(2, 72) = 7.22, p = .001. There was a significant interaction between the stomach condition and the weight of the participants, on the amount of food eaten by the participants, F(2, 72) = 21.18, p < .001. Overall, the factor of stomach condition accounted for 47.1% of the total variance, the factor of weight accounted for 5.9% of the total variance; and the effect of stomach condition and weight interacted to contribute to 17.4% of the total variance. Pairwise comparisons ((Tukey’s HSD tests, ps < .05).) indicated that ‘Empty and underweight’ (M = 24.92, SD = 5.33) reported significantly higher amount of food eaten as compared to ‘full and underweight’ (M = 14.00, SD = 2.52) and ‘full and normal’ (M = 12.00, SD = 1.47) and lower amount of food eaten as compared to ‘empty and normal’ (M = 30.54, SD = 1.98). ‘Full and underweight’ reported significantly lower amount of food eaten as compared to all except ‘full and normal’. ‘Empty and normal’ reported significantly higher amount of food eaten as compared to all. ‘Full and normal’ reported significantly lower amount of food eaten as compared to all except ‘full and underweight’. An ANOVA was conducted on the amount of food eaten by the participants for weight groups for empty stomach. ANOVA indicated a significant effect of weight on a participant with an empty stomach, on the amount of food eaten by the participants, F(2, 36) = 6.10, p = .005. Further, An ANOVA was conducted on the amount of food eaten by the participants for weight groups for full stomach. ANOVA indicated a significant effect of weight on a participant with a full stomach, on the amount of food eaten by the participants, F(2, 36) = 23.40, p < .001. Discussion The results suggested that individual’s stomach condition (empty or full) and weight have significant effect on individuals eating behaviour. With empty stomach, individuals’ tries to eat much as compared to full stomach. Further, results suggested that overweight individuals with full stomach conditions try to eat more as compared to normal and underweight individuals and overweight individuals with empty stomach condition try to eat less as compared to normal individuals. However, results suggested that there is not much difference in eating behaviour for overweight individuals with empty or full stomach conditions. A surprising finding of the analysis is that normal individuals with empty stomach condition eat more as compared to underweight and overweight individuals. The relationship between weight and eating behaviours is moderate as weight only explains about 6% variation in eating behaviours. However, there was a large effect of weight with full or empty stomach conditions on eating behaviours as weight with empty and full stomach conditions explains about 25% and 57% variation, respectively in eating behaviours. This partially supports the Schechter study that people who are overweight tend to eat regardless of whether or not they are hungry that is overweight individuals do not respond to their internal, biological signals of hunger in the same way that normal weight and underweight people do. The reason for this that it is not true for the case of empty stomach condition of individuals. The limitation of this study is that it is not clear whether participants actually fasted for 12 hours before coming to “taste test”, as this can effect the outcome of the results. Section B Part 1: Background Dr. Feelgood, a prominent marriage counsellor, was interested in the association between length of marriage and marriage satisfaction over time. Over the course of her 20-year career, the recent divorcée collected data using the Worry Expression Scale (WES). The WES is a well known scale which purportedly measures how much a person expresses their concerns or worries to their partner by asking them to respond to a series of sensitive questions that are known to cause concerns within marriage, as well as how they would respond in a range of role-play scenarios in which their ethics may be challenged. In the WES, the higher the score the more that a person is likely to express their worries or concerns to their partner. Dr. Feelgood’s research involved some of her clients who attended Dr. Feelgood’s practice on a regular basis to receive help with couples’ conflict resolution. Dr Feelgood’s sample included husbands who took the WES when they initially got married (time0) and then at their 2nd (time1), 4th (time2), and 6th (time3) wedding anniversaries. Her sample included 12 married men who made it to their 6th wedding anniversary. Her WES scores are listed in Table 1 below. Dr Feelgood recently appeared on the Dr Phil show discussing her research. She said that her findings showed that the longer a couple was married, the less likely men were able to express their worries and concerns to their wife. She also suggested that, over time, the lower the WES score, the less likely the couple was satisfied with their marriage and were in danger of divorcing. Due to time constraints (and lack of intellectual rigour), Dr Phil nodded and seemed to agree with Dr Feelgood’s conclusions. Part 2: Assignment Task 1) Conduct a repeated-measures ANOVA by hand on the data and complete the following summary table. Source SS df MS F Subjects 2670.06 11 Time 389.90 3 129.97 15.004 Error 285.85 33 8.66   Total 3345.81 47 2) Conduct Tukey’s HSD analyses to make pairwise comparisons between all of the cell means. What is the q-comparison value required for the Tukey’s HSD test (assume = 0.05)? Show your manual calculations here. Fill in the following table with the appropriate numbers that reflect the pairwise comparisons for the Tukey’s HSD tests. Put a * next to the comparisons that are statistically significant. One Two Three Four Time One 0.08 1.83 7.00* Two 1.75 6.92* Three 5.17* Four 3. Write up the analyses as you would in the Results section of a journal article, including the report of the central tendency and variability measures and the outcome of the analyses (20%). Include a graph of your data (5%) and make sure you report the percentage of variability in WES scores that is accounted for by the ‘time’ variable (5%). Follow this up with a Discussion section (40%) in which you: (a) present some conclusions about the relationship between length of time of marriage and how much men express their worries and concerns to their partners (b) discuss the shortcomings of Dr. Feelgood’s design and the possible confounds (c) discuss what additional data you would have liked to have collected to clarify the meaning of the present results, especially in light of Dr Feelgood’s conclusions. (The Results and Discussion section must be formatted according to APA style and typed on A4 paper. No handwritten assignments will be accepted. Use Times or Times New Roman 12-point font (Times is the font used in this assignment), double-spaced, with 2.5-cm margins left and right, top and bottom. Your Results and Discussion section should should stay only within TWO (2) pages long. The graph must be formatted in APA style, with an appropriate APA-formatted title and may be either hand-drawn or computer-drawn. As mentioned above, the graph must be formatted within the Results and Discussion section, just like it would appear in a journal article.) Results A Repeated Measures ANOVA was conducted on the husband’s Worry Expression Scale (WES) scores of the partners for four time periods, when they initially got married then at their second, fourth, and sixth wedding anniversaries. Figure 1: Plot of WES scores of husbands by time Figure 1 shows the plot of WES scores of husbands by time. The graph suggests that as the time passes WES scores of husband’s decreases. The results of ANOVA indicated a significant effect of time on Worry Expression Scale (WES) scores of the partners, F(3, 33) = 15.00, p < .001. Overall, the percentage of variability in WES scores that is accounted for by the ‘time’ variable is about 57.7%. The result suggested that there is an association between length of marriage and marriage satisfaction over time. Pairwise comparisons ((Tukey’s HSD tests, ps < .05).) indicated that the WES scores for husbands for the sixth wedding anniversary (M = 59.67, SD = 7.54) was significantly lower as compared to when they initially got married (M = 66.67, SD = 7.62), at their second wedding anniversary (M = 66.58, SD = 8.82) and at their fourth wedding anniversary (M = 64.83, SD = 8.73). Discussion The results suggested that there is a significant effect of time on WES and as the time passes husbands WES scores decreases that is the longer a couple was married, the less likely men were able to express their worries and concerns to their wife. In other words, there is an association between length of time of marriage and marriage satisfaction over time. The one main limitation of this study is that it had considered only husband WES scores. In addition, it is not clear how Dr. Feelgood suggested that, over time, the lower the WES score, the less likely the couple was satisfied with their marriage and were in danger of divorcing. The possible confounds for the study is that people tend to less worries to their partners as time passes because they made some adjustments as per their partner liking and disliking and hence the WES score have an effect of this as the time of marriage passes. In addition, the sample only consists of clients who attended Dr. Feelgood’s practice on a regular basis to receive help with couples’ conflict resolution, thus there may be strong possibility that WES scores decreased because of regular counselling. Therefore, additional data from other husbands’ (or wives) who have not attended counselling will be needed to clarify the meaning of the present results. Appendix 1: Repeated-Measures ANOVA Calculations by Hand dfsubjects = n – 1 = 12 – 1 = 11 dftime = k – 1 = 4 – 1 = 3 dfsubjects*time = dferror = (n – 1)(k – 1) = (12 – 1)(4 – 1) = 33 dftotal = 12*4 – 1 = 47 (or = 11 + 3 + 33 = 47) CF = = 30932/48 =199305.188 SST = = (652 + 692 + 602 +…612 + 702 + 512) – 199305.1875 = 202651-199305.188 = 3345.813 SS (subjects) = = (1/4)[2572 + 2622 + 2422 + …+ 2302] – 199305.188 = 807901/4 – 199305.188 = 201975.25 – 199305.188 = 2670.063 SS (Time) = = (1/12)[8002 + 7992 + 7782 + 7162] – 199305.188 = 2396341/12 – 199305.188 = 199695.083 – 199305.188 = 389.896 SSE = SST – SS (Subjects) – SS (Time) = 3345.813 - 2670.063 - 389.896 = 285.854 MS(Time) = 389.896/3 = 129.965 MS(Error) = 285.854/33 = 8.662 F = 129.965/8.662 = 15.004 2 (Time) = SStime /( SStime + SSerror) = 389.896/(389.896 + 285.854) = 389.8958/675.75 = 0.577 or 57.7% Read More
Cite this document
  • APA
  • MLA
  • CHICAGO
(Obesity and Hunger Assignment Example | Topics and Well Written Essays - 1500 words, n.d.)
Obesity and Hunger Assignment Example | Topics and Well Written Essays - 1500 words. Retrieved from https://studentshare.org/biology/1741043-research-methodology
(Obesity and Hunger Assignment Example | Topics and Well Written Essays - 1500 Words)
Obesity and Hunger Assignment Example | Topics and Well Written Essays - 1500 Words. https://studentshare.org/biology/1741043-research-methodology.
“Obesity and Hunger Assignment Example | Topics and Well Written Essays - 1500 Words”, n.d. https://studentshare.org/biology/1741043-research-methodology.
  • Cited: 0 times

CHECK THESE SAMPLES OF Obesity and Hunger

Why are we so fat

It should be noted that blocking of fatty foods not only prevented the ketosis process but also it caused increased hunger.... Low blood sugar can increases hunger and appetite for food and the final outcome could be overweight.... obesity or over weight is one of the major health problems in many countries and America is also not an exception.... obesity or over weight is one of the major health problems in many countries and America is also not an exception....
4 Pages (1000 words) Essay

Human Obesity is not Caused Merely by a Weak Will

The primary neurons have cells that can stimulate hunger via production of agouti-related peptide or AgRP and neuropeptide or NPY.... It is also comprised of cells that can supress hunger by production of proopiomelanocortin or POMC.... Therefore, either activation of AgRP or NPY or stopping the production of POMC can bring about a feeling of hunger (Smith, 1998).... One such hormone is ghrelin, which activates NPY/AgRP and stimulates hunger....
6 Pages (1500 words) Essay

The Implications of Obesity on Health

The goal of this short essay "The Implications of Obesity on Health" is to concern the issue of obesity and evaluate its implication on one's overall health.... The fast food lacks essential nutrients and therefore, while the hunger of body is fulfilled, the lack of proper diet adversely impacts the health of the persons.... The experiment of eating three meals of fast food from McDonald's' on a regular basis for a month resulted in depression, obesity, adverse impact on the liver, heart and high level of sugar....
1 Pages (250 words) Essay

Hunger in America

The… The movie defines a starting point for social change since it defines hunger as a problem that requires political and social input.... Ironically, the movie starts with scenes of helicopters peering down on hunger in America al Affiliation) hunger in America The documentary, “A place at the table” by magnolia pictures allows the analysis of hunger from a political and government perspective.... The movie reignites my feelings about the persistent danger of hunger in America....
2 Pages (500 words) Coursework

Obesity

There is a need for the health stakeholders to create awareness programs on obesity and provide a solution to the poor people.... "From Child hunger to Obesity: Brazils New Health Scourge |Global Development Professionals Network | The Guardian.... The poor people in Brazil have previously had the hunger challenge, and after the problem was solved, they now have to deal with obesity.... Every year cases of child hunger are brought to the media....
2 Pages (500 words) Annotated Bibliography

The US Food Stamp Program - Evil or Good

hellip; The federal US government established a food stamp program to alleviate hunger incident in the nation.... The program is aimed at promoting healthy eating and alleviating hunger, its beneficiaries can use it to purchase sweetened foods and soda.... In the United States, the federal government established America's food stamp program to alleviate hunger incident in the nation, especially among the poor in the society.... Even though food stamp program is aimed at promoting healthy eating and alleviating hunger, especially among the poor, beneficiaries of food stamp program can use it to purchase sweetened foods and soda....
1 Pages (250 words) Essay

My Philosophy of Eating

The author's current philosophy of eating can be described as it is better to eat something only at times when we experience hunger....  There are many people who eat something even if they don't feel hunger, in order to give the company to others.... Our body has the ability to remind us of the necessity of energy in the form of hunger.... Therefore extra energy or calorie will never be accumulated in our body if we take normal food at the time of hunger....
7 Pages (1750 words) Essay

Human Development - Families in Poverty Score of True and False Questions

Place at the Table puts its emphasis on social, economic and cultural repercussions of Obesity and Hunger in the United States and is an appropriate professional development resource that can be vital to educators while being a tool that can facilitate community dialogue and increase awareness on issues of hunger and obesity....
3 Pages (750 words) Admission/Application Essay
sponsored ads
We use cookies to create the best experience for you. Keep on browsing if you are OK with that, or find out how to manage cookies.
Contact Us