StudentShare
Contact Us
Sign In / Sign Up for FREE
Search
Go to advanced search...
Free

Data Collection and Analysis Paper - Statistics Project Example

Cite this document
Summary
The paper "Data Collection and Analysis Paper" describes that the error analysis exposes the effect of measurement and the treatment of the measurement from which this project proposes an error reduction, by increasing the number of decimal places used in the measurement…
Download full paper File format: .doc, available for editing
GRAB THE BEST PAPER97.9% of users find it useful
Data Collection and Analysis Paper
Read Text Preview

Extract of sample "Data Collection and Analysis Paper"

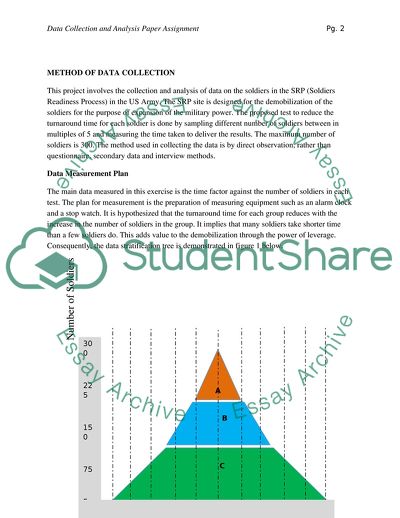
Statistics Project, Statistics Data Collection and Analysis Paper Assignment METHOD OF DATA COLLECTION This project involves the collection and analysis of data on the soldiers in the SRP (Soldiers Readiness Process) in the US Army. The SRP site is designed for the demobilization of the soldiers for the purpose of expansion of the military power. The proposed test to reduce the turnaround time for each soldier is done by sampling different number of soldiers between in multiples of 5 and measuring the time taken to deliver the results. The maximum number of soldiers is 300. The method used in collecting the data is by direct observation, rather than questionnaire, secondary data and interview methods. Data Measurement Plan The main data measured in this exercise is the time factor against the number of soldiers in each test. The plan for measurement is the preparation of measuring equipment such as an alarm clock and a stop watch. It is hypothesized that the turnaround time for each group reduces with the increase in the number of soldiers in the group. It implies that many soldiers take shorter time than a few soldiers do. This adds value to the demobilization through the power of leverage. Consequently, the data stratification tree is demonstrated in figure 1 below. Figure 1: Data Stratification Tree The tree is wide at the bottom but it diminishes upwards as the number of soldiers reduces. It implies that more time is required with a few soldiers, but as the number grows, less turnaround time is observed. The measurement of time gives the data as shown in table 1 below. Table 1: Time Data Measurement Number of Soldiers In a Group Turn Around Time (Minutes) 10 75.00 20 37.50 30 25.00 40 18.75 50 15.00 60 12.50 70 10.71 80 9.38 90 8.33 100 7.50 110 6.82 120 6.25 130 5.77 140 5.36 150 5.00 160 4.69 170 4.41 180 4.17 190 3.95 200 3.75 210 3.57 220 3.41 230 3.26 240 3.13 250 3.00 260 2.88 270 2.78 280 2.68 290 2.59 300 2.50 Figure 2: Time Measured Against the Number of Soldiers Actual Measurement of Data The types of information measure is the time taken by the number of soldiers in the groupings. It is intended to measure the optimal processing time in the demobilization and to reduce the congestion and confusion among the soldiers. The processing is observed to reach a constant limit at the level of 180 soldiers. It means that the best result of turnaround time was obtained by splitting the soldiers into two groups, one group having 180 soldiers and the second group, 120 soldiers. There is a clear definition for the input and output in this exercise, whereby, the number of soldiers in the groups is the input, while the time measure taken in carrying out the given SRP exercise is the output. The data collected was continuous (with fractions). However, the input data was discrete. The baseline measurement of the input data was 90 minutes, which an individual soldier takes to complete the SRP process. The major objective is to reduce the time by between 33.0% to 60.00 minutes. There is need for development of standard operational procedures for the home units as well as Fort Sill to uphold the efficiency of the SRP processes. Originality of the Data The data collected was original primary data collected from observation. It was not a secondary data because the SPR is a practical exercise, not a historical account of the past events. The data collected were 30 records of data because each group had 10 respondents. This was to reduce the number of tests and improve on the processing time on the data collected. Any number less than 5 would require more than 30 tests and measurements, hence, generating more than enough data. Secondly, any number more than 10 would generate very few records and opportunities for testing. This would lead to insufficient data that eventually leads to high error rate and unreliable output. In this regard, the ideal sample size is using the sample-size equation is calculated as shown below: S = (T) / d Where T is the maximum number of soldiers (T = 300) and d is the gap between each sample group, which in this case is 10. The sample size is obtained as: S = 300 / 10 S = 30 The risk given in the chosen sample is that the selection of soldiers for the groups may not be random; hence there may be two remarkably different and unrealistic outcomes. For a realistic result, there is need to use a random selection of the soldiers for each of the groups. Method of Data Collection The data was collected through direct observation of the practical SPR activities. The soldiers were engaged in the SRC processes while the stop watch was running. Immediately the exercise is declared complete, the stop watch is stopped and the time is recorded, before taking a subsequent group. The measurement error could arise from the rounding off of seconds into the nearest minutes. For example, all the data collected measured the time in two decimal places. This easily hides the round off errors. In order to measure the amount of error hidden in the calculation, there is need to get the actual measurement then subtract the exact measurement taken to get the error. The data is thus presented as seen in table 2 below: Table 2: Error Calculation Soldiers Actual Turn Around Time (Minutes) Round Off Turn Around time Error 10 75 75 0 20 37.5 37.5 0 30 25 25 0 40 18.75 18.75 0 50 15 15 0 60 12.5 12.5 0 70 10.7143 10.71 -0.0043 80 9.375 9.38 0.005 90 8.3333 8.33 -0.0033 100 7.5 7.5 0 110 6.8182 6.82 0.0018 120 6.25 6.25 0 130 5.7692 5.77 0.0008 140 5.3571 5.36 0.0029 150 5 5 0 160 4.6875 4.69 0.0025 170 4.4118 4.41 -0.0018 180 4.1667 4.17 0.0033 190 3.9474 3.95 0.0026 200 3.75 3.75 0 210 3.5714 3.57 -0.0014 220 3.4091 3.41 0.0009 230 3.2609 3.26 -0.0009 240 3.125 3.13 0.005 250 3 3 0 260 2.8846 2.88 -0.0046 270 2.7778 2.78 0.0022 280 2.6786 2.68 0.0014 290 2.5862 2.59 0.0038 300 2.5 2.5 0 Total Error 0.0159 In order to minimize the Error, the measurements can be taken in higher precision values. For example, instead of rounding off to the nearest tenths, we can round off to the nearest the thousandths. This means we will have 4 decimal places instead of two, giving more accurate measurements. DATA ANALYSIS TOOLS The SQL for the old process is the update information that each soldier spends 90 minutes in the SRC process. In the new process however, there is leverage and the soldiers spend an average of 9.98 minutes. The tools for measuring data are classified into two categories, software and hardware. As previously mentioned, in the hardware category, this project required a stop watch and an alarm clock for timing the SRC exercise among the soldiers. In the software category, this project required an excel spreadsheet to apply the computation and analysis of the data. There are three techniques used in this analysis including the measures of central tendency, measures of dispersal and error analysis. This is to verify the consistency of the behavior of the random distribution. The measures of central tendency are presented in the table 3 below: Table 2: Measures of Central Tendency Mean 9.98747 median 4.84375 Mode #N/A Additionally, the measures of dispersal are presented in table 4 below: Table 2: Measures of Central Tendency Standard Deviation 14.47454118 Variance 209.5123425 From the data, the time spent by the soldiers reduced significantly from 90 minutes to less than 10. However, the computed mean of the time spent deviates from the actual mean to the scale of 14.47. CONCLUSION The error analysis exposes the effect of measurement and the treatment of the measurement from which this project proposes an error reduction, by increasing the number of decimal places used in the measurement. The proposal was not implemented, but it was tested and confirmed to be reducing the errors from 1.59% to 0.68%. The lesson learnt in the process is that leverage increases efficiency and accuracy of performance. The old process is not in control of the SRC results. However, the new process is fully in control and is influential on the mobilization and demobilization of soldiers.. Read More
Cite this document
  • APA
  • MLA
  • CHICAGO
(Data Collection and Analysis Paper Statistics Project Example | Topics and Well Written Essays - 1250 words, n.d.)
Data Collection and Analysis Paper Statistics Project Example | Topics and Well Written Essays - 1250 words. https://studentshare.org/statistics/1880323-data-collection-and-analysis-paper-assignment
(Data Collection and Analysis Paper Statistics Project Example | Topics and Well Written Essays - 1250 Words)
Data Collection and Analysis Paper Statistics Project Example | Topics and Well Written Essays - 1250 Words. https://studentshare.org/statistics/1880323-data-collection-and-analysis-paper-assignment.
“Data Collection and Analysis Paper Statistics Project Example | Topics and Well Written Essays - 1250 Words”. https://studentshare.org/statistics/1880323-data-collection-and-analysis-paper-assignment.
  • Cited: 0 times

CHECK THESE SAMPLES OF Data Collection and Analysis Paper

Fire Investigation

Fire Investigation: collection and Preservation of Arson Evidence Franziska Philipp Palm Beach State College Fire Investigation: collection and Preservation of Arson Evidence Introduction Fire investigation aims to establish the cause and origin of fire related occurrences (Lee and Harris, 2000).... As soon as the wet evidence is in a secure location, whether it was packed in paper or plastic bags, it must be removed and given time to dry.... As soon as it dries, it should be repackaged in a dry and new paper container....
6 Pages (1500 words) Research Paper

Effects of Globalization on the US Steel Producers

The purposes of this research paper are to study and analyse the impact of globalization on the participants of the US steel industry and recognise how it affects the steel producers.... The integration of globalization with the US economy occurred rapidly which affected the US steel industry....
8 Pages (2000 words) Research Paper

Consumer Psychology

In a typical consumer industry, the issues faced by the companies are more or less related to common factors which include sales, service, new products introduction, debt collection and competition.... hellip; The consumer behavior and the companies' response with strategies for growth in this paper are discussed in relation to the consumer industry.... Objectives This paper discusses consumer behavior with reference to an ongoing concern.... The paper seeks to analyze the issues with regard to the existing and potential consumers....
10 Pages (2500 words) Research Paper

The Effect on Sales of Digital Music Through Legal and Illegal Distribution Channels

Furthermore the outcome and analysis of the study will help to recommend and suggest marketing strategies so that the legal music distributors can avail measures to generate higher revenues in this prevailing market conditions.... Furthermore the outcome and analysis of the study will help to recommend and suggest marketing strategies so that the legal music distributors can avail measures to generate higher revenues in this prevailing market conditions.... Research Structure Initially this research paper will categorize the online music distribution channels similar to the iTunes business model....
11 Pages (2750 words) Research Paper

Gender and Social Organization among the Mbuti

Nets and Arrows: Gender and Social Organization Among the Mbuti One of the very controversial issues in the anthropological research on the Mbuti, foragers in the Ituri Forest, concerns subsistence, gender and social organization.... It has to do with women's participation in net hunting and archery hunting....
11 Pages (2750 words) Research Paper

Research Critique - Dapagliflozin Trials

Running Head: Research Critique-Dapagliflozin Trials....
4 Pages (1000 words) Research Paper

Qualitative Analysis of Perspectives of Women with Dementia Receiving Care from Their Daughters

Less research documentation was applied in data collection concerning individuals with dementia.... This paper aims to analyze and critique the qualitative data and methodology used in the study “Perspectives of Women with Dementia Receiving Care from their Adult Daughters” by Catherine Ward-Griffin, Nancy Bol and Abram Oudshoorn.... Name Instructor Course Date A Qualitative analysis of “Perspectives of Women with Dementia Receiving Care from their Adult Daughters” Academic and market studies often use qualitative research as a method of gathering and analyzing data....
5 Pages (1250 words) Research Paper

Impact of Data Collection, Storage, Retrieval, and Analysis on Criminal Justice System

This paper discusses the importance of data collection, retrieval, and analysis of the criminal justice system.... nbsp;   DATA MANAGEMENT ON CRIMINAL JUSTICE SYSTEM Impact of Data Collection, Storage, Retrieval, and analysis on Criminal Justice System [Insert Your First and Last Names] [Insert Name of University] DATA MANAGEMENT ON CRIMINAL JUSTICE SYSTEM 2 Abstract This paper briefly discusses importance of data collection, storage, retrieval, and analysis on the criminal justice system....
2 Pages (500 words) Term Paper
sponsored ads
We use cookies to create the best experience for you. Keep on browsing if you are OK with that, or find out how to manage cookies.
Contact Us