StudentShare
Contact Us
Sign In / Sign Up for FREE
Search
Go to advanced search...
Free

Human Development Index in Statistics - Coursework Example

Cite this document
Summary
The main focus of this writing will be laid on the describing the role of HDI (Human Development Index) for ranking countries on various levels. Human development is the basic distinction need to improve and differentiate the means and the end of development. …
Download full paper File format: .doc, available for editing
GRAB THE BEST PAPER95.5% of users find it useful
Human Development Index in Statistics
Read Text Preview

Extract of sample "Human Development Index in Statistics"

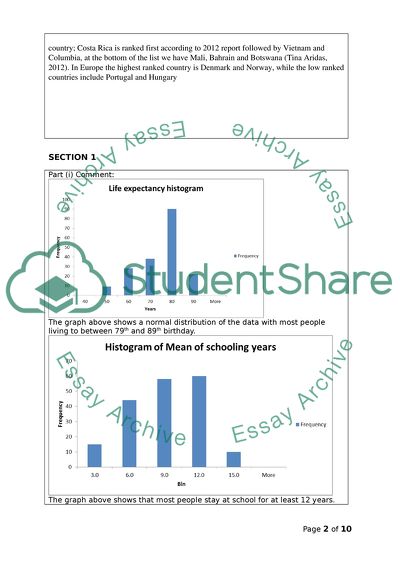
INVESTIGATION REPORT PART A – Maximum of 600 words (80% of Total Mark) Introduction: HDI is a measurement tool developed by the UN for ranking countries on social and economic development using the main benchmarks namely, education, life expectancy and per capita income (United Nations Development Programme, n.d.). Human development is the basic distinction need to improve and differentiate the means and the end of development, this is by improving achievements freedoms and capabilities of individuals (Sundir Anand, 1994). UNDP views human development as a process of diversifying human choices that’s leads to longer life, better education and better decent living conditions, other choices include political, human rights freedom, self-dignity and cultural liberty (Anon., 2008). Human capital plays a vital role in development of a country this is brought about by making meaningful investment in improving health of its citizens, thus increasing well-being of citizen’s increases the life expectancy. Increase in knowledge of its citizens empowers the citizens earns a decent living and this variable is measured by the adult literacy rates, basic education (both primary and secondary) and tertiary level of enrolment. GDP is often used to evaluate the nation state, HDI was first developed in 1990 to help to understand the simple matrix of basic human well-being. The composite index is widely used world-wide by government statistics its release and publication generates a lot of political discussion with most administrations focusing on improving lives nationally and regionally. HPI is a measurement tool for measuring sustainable happy living in countries using the variables life expectancy, environmental output and well-being experience; this measure gives us insight of how the countries are involved in making life better for their citizens now and in future (New Economic Foundation, 2015). The variables life expectancy is a quantitative continuous variable measuring the probable mean life of countries human population based on the average death age. Ecological footprint is a quantitative continuous variable that measure the land utility by human beings in relation to carbon-dioxide emission and the vegetable required to absorb the emitted gas. Where as life satisfaction is dynamic complicated variable as the variable is subjective to many confounding factors given that the happiness is subjective compounded by cultures it becomes even more complex (Tina Aridas, 2012). Latest HPI report indicates that the world is still unhappy place to leave in, the challenges are experienced in both countries with high and low GDP. The study indicates that the biggest emitters are not usually the happy ones despite them being economic giants rather wellbeing of the country is highest on both low and high income countries. The ranking consists of 151 countries across the globe, the study involves how the citizens utilizes the earth’s resources to maximum into meaningful well-being class citizens of that country; Costa Rica is ranked first according to 2012 report followed by Vietnam and Columbia, at the bottom of the list we have Mali, Bahrain and Botswana (Tina Aridas, 2012). In Europe the highest ranked country is Denmark and Norway, while the low ranked countries include Portugal and Hungary Section 1 Part (i) Comment: The graph above shows a normal distribution of the data with most people living to between 79th and 89th birthday. The graph above shows that most people stay at school for at least 12 years. The graph shows that most people world wide have a happy life of 50 years. Part (ii) Summary Statistics/Comment:   Life expectancy at birth Mean years of schooling Expected years of schooling Gross National Income (GNI) per capita Mean 69.64 7.61 12.35 12782.22 Median 73.0 8.0 12.5 7476.4 Interquartile range 11.68 4.63505 3.973045 14461.24 Part (iii)/Part (iv) Comment: The graph shows a correlation between the life expectancy and per capita income is a positive correlation. The graph indicates a positive linear correlation between the mean of schooling years and expected schooling years. The scatter shows a positive linear correlation between the happy life years and ecological footprint Part (v) Outliers: Variable per capita income 83717 and 107721 Variable Happy life years 62 and 57.7 Part (vi): Production Moment Correlation Coefficient/Comment: In determining the linear correlation between the Life expectancy and the per capita income r =0.54 indicating a weak positive correlation. The linear correlation between Mean schooling and expected schooling r = 0.84 indicating a strong positive correlation. Section 2 Part (i) and Part (ii) Correlation Coefficient/Comment The value r = 0.90 indicates a strong and highly correlation between the two variables. Part (iii) Line of Best fit and its interpretation: From the graph above the model simple linear equation will be Y = 6776.4x – 6214.3 With R2 =81.6% indicating that the variable GDP accounts 82% of the variance of the Ecological footprint Part (iv) Outliers: Variable GDP values 57230, 57932 and 86124 Conclusions/Comments: The low ecological footprints have an impact on the GDP of the country thus affecting the Happy Index. The GDP of the country is an independent variable but other confounding factors can bring in new dimension where as Ecological footprint is a dependable variable. Section 3 Part (i) Table of Correlation Coefficients Table of correlations Variable GDP Ecological Footprint Well-being Life Expectancy HPI 0.06 0.23 -0.45 -0.53 HDI 0.70 0.90 Part (ii) Comment: The Happy Planet Index correlations are .06 and .23 are weak positive correlation But HDI correlation indicates a strong correlation .7 with .09 correlation in life expectancy; where as HPI -.53 indicating a negative correlation. Conclusions (Part A): HDI is a vital statistical tool that used to evaluate the status of citizens in a country. The Adult literacy and the enrolment of basic and tertiary education is the best parameter to evaluate the level of knowledge in a country that has a direct impact on per capita income of the country. HPI is a measure that evaluate human production in relation to the environment. Both measure run down to the basic GDP measure to measure the human productivity in a more cleaner environment in increasing the well-being and life expectancy of its citizens. REFERENCES (PART A) Works Cited Anon., 2008. Meghalaya human development report , s.l.: s.n. New Economic Foundation, 2015. Happy Planet Index. [Online] Available at: http://www.happyplanetindex.org/about/ [Accessed 29 April 2015]. Sundir Anand, A. K. S., 1994. Human Development Index, New york: UN. Tina Aridas, V. P., 2012. The Happiest Countries in the World. [Online] Available at: https://www.gfmag.com/global-data/non-economic-data/happiest-countries [Accessed 29 April 2015]. United Nations Development Programme, n.d. Human Development Index (HDI). [Online] Available at: http://hdr.undp.org/en/content/human-development-index-hdi [Accessed 29 April 2015]. PART B Extension - Maximum 300 words (20% of Total Mark) The Report for the EXTENSION should include the following HEADINGS (as a minimum) : Introduction The variables GDP is a secondary data obtained from World bank data bases is computed of all services and products produced within the country. The variable Education is secondary index obtained from UNDP and is a measure of education achievement in basic education that is secondary and primary levels, and adult illiteracy levels of the population below 85 years of age. Where as life expectancy is a continuous variable measuring the average of health conditions and living conditions in a country. The new variables that can be used to measure the human development index are health and poverty variables . Poverty index is too a secondary data that can be obtained from UNDP data bases and an example of it is the MPI index (Multidimensional Poverty Index). This is a continuous variable that measures the levels of poverty in a country. It a good measure of human development index as it will measure the level of human resources utilization in a country and the wealth generated. Health Index of a country is a variable that measures the number of cases of ailment of various diseases reported and the curative measure done on them. This is a secondary data too obtained from WHO. This index also measure the access to facilities health care or the proximity and the affordability of the heath care. Both index will far fetch measure in human development index better as poverty levels affect education index far much more and is a confounding variable in education as above. Health index is a confounding factor in life expectancy index and can be more accurate as the medical access and health of a nation provides overall human resource development cycle and increase the GDP of a country. REFERENCES (PART B) APPENDIX You should use this section for any Technical Information such as EXCEL formulae, details of any Data Cleansing that you have undertaken and any other information that you think is relevant to your project. You should ensure that anything included in the Appendix is CLEARLY REFERENCED in the INVESTIGATION REPORT. Read More
Cite this document
  • APA
  • MLA
  • CHICAGO
(Human Development Index in Statistics Coursework - 1, n.d.)
Human Development Index in Statistics Coursework - 1. Retrieved from https://studentshare.org/statistics/1874136-statistics
(Human Development Index in Statistics Coursework - 1)
Human Development Index in Statistics Coursework - 1. https://studentshare.org/statistics/1874136-statistics.
“Human Development Index in Statistics Coursework - 1”, n.d. https://studentshare.org/statistics/1874136-statistics.
  • Cited: 0 times

CHECK THESE SAMPLES OF Human Development Index in Statistics

Environmental Degradation of Pasig River

This is also argued in the context that sustainable development among poor nations had been a difficult task, given the tendency of these countries to undertake exploitive economic activities (mostly through extractive industries such as mining, forestry and agriculture).... The once abundant fish and plant life have been replace by only the toughest of scavengers, both animal and human alike....
19 Pages (4750 words) Case Study

Statistical Analysis of Stock Indices

Several possible reasons are offered for this difference, including the differing market structures, the use of a different index or the use of alternate statistical tests'.... In case of the stock market indices we are analysing, the test for unit root is a reliable tool to test the extent to which the index is speculating.... urthermore, the regression analysis especially the autoregressive model that is of interest in this case has successfully been used during the development of a series of robust tests of the 'intrinsic value measure, along with other traditional measures of value, for the Australian Stock Market'....
14 Pages (3500 words) Research Paper

The Effect of Corruption on the Productivity of a Country

n this paper we focus on the effect of corruption on the GDP level of a country, we use data on corruption index from transparency international and GDP level from the world bank, we use linear regression models to estimate the relationship between these variables and show that corruption affects the level of GDP, limitations include unavailability of data for countries and the violation of linear regression assumptions on auto regression given that we will be considering cross sectional data....
9 Pages (2250 words) Essay

Influence of Gross Domestic Product and Income Distribution on Gross National Income

This essay is an econometric analysis of the various economic statistics in terms of a specific model that best describes them.... The major statistics of the economy as described in NationMaster website include  Gross Domestic Product (GDP), Purchasing Power Parity (PPP), distribution of income, distribution of consumption, gross national income, GDP.... nbsp;… These statistics are inter - dependent on one another and are influenced by one another....
10 Pages (2500 words) Essay

Human Development Index - Ethiopia, Russia, and Switzerland

This paper "human development index - Ethiopia, Russia, and Switzerland" focuses on the human development index which refers to a composite statistic that encompasses an income, education, and life expectancy indices, which ranks states into very high, high, medium, and low human development tiers.... nbsp;… The inequality-adjusted human development index was added in 2010, which was meant to calculate actual human development levels.... Thus, the IHDI is viewed as the actual human development level, rather than the potential human development levels that are depicted by the HDI....
5 Pages (1250 words) Assignment

The Explanatory Power of Functions of the Variables

ince sponsoring each of the factors will bring significant contributions towards economic growth and development aspects, it is a rather tricky situation that the national authorities have in front of them, given that the resources allotted for investment are limited, viz.... On the other hand, education is another factor which has the capacity to brighten the future prospects of the nation, through educating the national youth and training them with special skills, thus enhancing the quality of human capital....
8 Pages (2000 words) Research Paper

State of Software Development

This research paper "State Of Software development" presents the relationship between prior research findings and current analytical and statistical findings of factors regarding software developers.... Software development, and approximately sixty-four-year-old process now, is an ever-expanding field that is undergoing constant change and adoption.... Customer satisfaction and enhanced usability are two of the main goals that software development environments focus upon....
13 Pages (3250 words) Research Paper

Statistics and Research Methods

7 Pages (1750 words) Essay
sponsored ads
We use cookies to create the best experience for you. Keep on browsing if you are OK with that, or find out how to manage cookies.
Contact Us