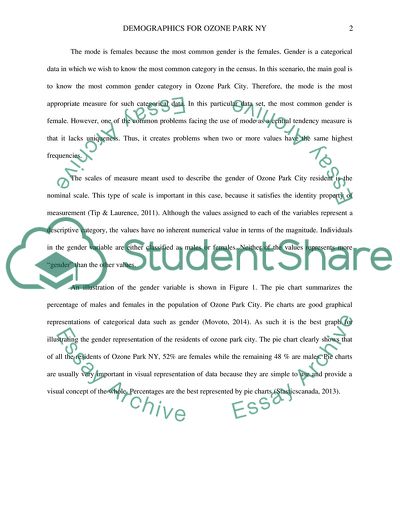
StudentShare
Contact Us
Sign In / Sign Up for FREE
Search
Go to advanced search...
Free

South Ozone Park Demographics - Assignment Example

Cite this document
Summary
The paper contains figures of South Ozone Park demographics. The author of the paper gives a detailed information about  the statistics of the population age, gender distribution of residents of Ozone Park NY, income level, ethnicity and education of people…
Download full paper File format: .doc, available for editing
GRAB THE BEST PAPER93.4% of users find it useful
South Ozone Park Demographics
Read Text Preview

Extract of sample "South Ozone Park Demographics"

577849Population age The current total population of South Ozone Park City in New York is 67,920. The median age of the Ozone Park population is 36 (Movoto, 2014). The main measure of central tendency used to represent the age of the population is the median. The median is appropriate because it is neither affected by very large or even very small values (Hanna & Dempster, 2014). The age of a population may have either extremely high values or low values. As such, the median was the appropriate measure of central tendency that would give a good representation of the population age of Ozone Park City. As shown in Table 1, there are people under the age of 10 and other beyond the age of 65. Scale of measurement used to represent the population age is the interval scale. Although the intervals are not equal, the values in this variable possess the properties of identity and magnitude. It is possible to know from this scale whether the different values for age are bigger or smaller than the other. It is also possible to the extent of the difference. AGE FREQUENCY ≤ 6 4,726 (10%) 7 - 18 Years Old 8,432 (18%) 19 - 24 Years Old 3,935 (9%) 25 - 39 Years Old 11,255 (25%) 40 - 64 Years Old 13,312 (29%) ≥ 65 4,130 (9%) Table 1: Population age of South Ozone Park Gender Of the total population in Ozone Park, 30,555 people are males while the female population is 33,318. It is clear that the females are more than the males in the population. The mode is females because the most common gender is the females. Gender is a categorical data in which we wish to know the most common category in the census. In this scenario, the main goal is to know the most common gender category in Ozone Park City. Therefore, the mode is the most appropriate measure for such categorical data. In this particular data set, the most common gender is female. However, one of the common problems facing the use of mode as a central tendency measure is that it lacks uniqueness. Thus, it creates problems when two or more values have the same highest frequencies. The scales of measure meant used to describe the gender of Ozone Park City resident is the nominal scale. This type of scale is important in this case, because it satisfies the identity property of measurement (Tip & Laurence, 2011). Although the values assigned to each of the variables represent a descriptive category, the values have no inherent numerical value in terms of the magnitude. Individuals in the gender variable are either classified as males or females. Neither of the values represents more “gender” than the other values. An illustration of the gender variable is shown in Figure 1. The pie chart summarizes the percentage of males and females in the population of Ozone Park City. Pie charts are good graphical representations of categorical data such as gender (Movoto, 2014). As such it is the best graph for illustrating the gender representation of the residents of ozone park city. The pie chart clearly shows that of all the residents of Ozone Park NY, 52% are females while the remaining 48 % are males. Pie charts are usually very important in visual representation of data because they are simple to use and provide a visual concept of the whole. Percentages are the best represented by pie charts (Stasticscanada, 2013). Figure 1: gender distribution of residents of Ozone Park NY Income level Household income distribution of the residents of South Ozone Park represents the distribution as per the different income brackets at the household level. The median household income for residents of South Ozone Park is $61,476. This value is 40% lower than the median income level of New York Metro which is $102,734 (Movoto, 2014). The median is the most appropriate measure of central tendency that give a good representation of the income level of the people of Ozone Park City. The Median can play a crucial role in income level research because chances of encountering extreme values are very high. For instance, in South Ozone Park there may be people who earn much money as well as people who earn less money. In order for the researchers to provide a good representation of this huge difference in income earning, it would be ideal to use the median as the main measure of central tendency to represent such data. On the other hand, the mean would not be the appropriate measure in this case because it usually work well in a normal distribution. Also, the mean becomes relevant in situations where there are no extreme values (Cherry, 2015). A few people in the population such as a few millionaires may raise the economic status of the sample. Thus, make it look like the socio-economic status of the sample is higher than it if the mean was used. The ratio scale would be the most appropriate scale of measurement for the income level distribution data. In terms of income levels, there are the four properties of measurement that identify the ratio scale. The scale has identity, magnitude, scale and a minimum of zero (Tip & Laurence, 2011). Of course, the residents of Ozone park who have no incomes. Income Level by age Amount (USD) Under 25 $27,136 25-44 $58,292 45-64 $65,896 Over 65 $59,819 The income distribution as per the different age categories are illustrated in Figure 2. The highest income is earned by people between 45 -64 years. Since we are comparing data across different categories, the bar graph is an ideal visual representation for such data (CDC, 2008). The different bars in the bar graph represent the different age categories of residents of Ozone Park. As shown in the graphs, the height of the graph is equivalent to the quantity represented within that particular category. Figure 2: Income distribution (in USD) by age in Ozone Park NY Ethnicity The mode is the African American population because this is the most frequent category of ethnic group in south ozone park NY. Ethnicity is a categorical data because the intention is to know the ethnic group that is most frequent in Ozone Park City. Therefore, the mode is the most appropriate measure for representing the ethnicity in Ozone Park. In this particular dataset, it is possible to know the most common ethnic group and the least common ethnic group in ozone park city. The nominal scale would be the most appropriate scale for representing the data for this variable. The values for this variable are all nominal in nature. The ethnicity is either African America, Asian, white or any other group. This scale only identifies the identity property of the measurement. Ethnic Group Number of people African American 16,265 (36%) Asian or Pacific Islander 5,885 (13%) Indian 541 (1%) Mixed Races 6,213 (14%) Others 7,115 (16%) White 9,479 (21%) Population by race Education Education data presented in the table represents the highest level of education residents in South Ozone Park attained. In the data, the mode is college education in which majority of the residents attained some college education (Movoto, 2014). Since the data is categorical, it is appropriate to use the mode as the best central tendency measure. The scale of measurement appropriate for this variable would the ratio scale. There is an absolute value in which there is no education level attained. There is also some element of identity and magnitude making the scale of measurement be a ratio scale. Education level Number of people No High School 4,446 Some High School 4,674 Some College 6,505 Associate Degree 3,024 Bachelor’s Degree 5,222 Graduate Degree 2,659 Figure 3 illustrates the education level attained by residents of Ozone Park. According to Few (2004), bar graphs are ideal for representing discrete data that represent individual categories of information (p. 5). The bars emphasize on the individual values per category of the variable. Since education level has different categories, the bar graph is the most appropriate graphical reorientation of this type of data. Illustrated in the bar graphs is also the aspect of quantity in which the height or size of the graphs represents the quantity of people who attained a particular level of education. References CDC. (2008). Using Graphs and Charts to Illustrate Quantitative Data. ETA evauation Briefs, 12, 1-3. Cherry, K. (2015). How Do I Identify and Calculate the Mean, Median or Mode. Retrieved from About.com: http://psychology.about.com/od/researchmethods/f/mean-median-or-mode.htm Few, S. (2004). Selecting the Right Graph for Your Message. Perpetual edge. Hanna, D., & Dempster, M. (2014). Choosing between Mode, Median and Mean in Psychology Statistics. Retrieved from http://www.dummies.com/how-to/content/choosing-between-mode-median-and-mean-in-psycholog.html Movoto. (2014). Ozone Park NY. Retrieved from Poplation Demographics: http://www.movoto.com/ozone-park-ny/11416/demographics/ Stasticscanada. (2013, July 23). Circle graphs/ pie charts. Retrieved from Statistics Canada: http://www.statcan.gc.ca/edu/power-pouvoir/ch9/pie-secteurs/5214826-eng.htm Tip, L., & Laurence, S. (2011). Research Skills: Levels of Measurements. Graham Hole. Read More
Tags
Cite this document
  • APA
  • MLA
  • CHICAGO
(South Ozone Park Demographics Assignment Example | Topics and Well Written Essays - 1250 words, n.d.)
South Ozone Park Demographics Assignment Example | Topics and Well Written Essays - 1250 words. https://studentshare.org/statistics/1855987-final-assignment
(South Ozone Park Demographics Assignment Example | Topics and Well Written Essays - 1250 Words)
South Ozone Park Demographics Assignment Example | Topics and Well Written Essays - 1250 Words. https://studentshare.org/statistics/1855987-final-assignment.
“South Ozone Park Demographics Assignment Example | Topics and Well Written Essays - 1250 Words”. https://studentshare.org/statistics/1855987-final-assignment.
  • Cited: 0 times

CHECK THESE SAMPLES OF South Ozone Park Demographics

The Sedentary Lifestyle

Name Date Course Section/# The Sedentary Lifestyle Although many factors can have a profound effect on the way that one experiences health within their own lives, one of the most important factors that medical science has been uncovering in recent years is t that a sedentary lifestyle can have upon the overall chances of disease and prospects of longevity for the individual in question....
5 Pages (1250 words) Essay

Recommendations for JJ Rossy Bar Problems

The management has failed in modifying business strategy in order to incorporate the city's demographics and industry trends.... The lack of a strategy in marketing that seeks to take advantage of the city's demographics, consumer psychology, and industry trends, tying it to their layout and capacity....
5 Pages (1250 words) Essay

The Role of Internet Advertising and Social Networking in Product Promotion

There are many other aspects in a promotional mix that will be considered in this case to do promotion in south Africa, they are discussed below; I.... Advertising For effective promotion of our product in south Africa, we have considered using advertisement as one of our strategies to meet the prospective buyers.... Because a huge chunk of the population in south Africa lives in urban areas, and that the product we intend to promote is mostly related to those in urban areas, we have also opted to use TVs and Print ads to supplement the promotion coverage....
6 Pages (1500 words) Essay

The Regenration Of Camden: The Effects Of Public Administration

The City of Camden has taken a proactive role in planning and putting forth effort in conjunction with local stakeholders in rejuvenating the city.... The redevelopment plan is quite comprehensive and divides the city into three districts.... … The major influx was due to the immigrants, mainly from Europe....
10 Pages (2500 words) Essay
sponsored ads
We use cookies to create the best experience for you. Keep on browsing if you are OK with that, or find out how to manage cookies.
Contact Us