StudentShare
Contact Us
Sign In / Sign Up for FREE
Search
Go to advanced search...
Free

Brief Introduction to Basic Statistical Terminology and Concepts - Essay Example

Cite this document
Summary
The paper "Brief Introduction to Basic Statistical Terminology and Concepts" aims to give know-how of the “quantitative nature of reality”, basic statistics concentrating on the subtopics: Descriptive Statistics, Correlations and the t-test for independent samples as part of the basic statistics…
Download full paper File format: .doc, available for editing
GRAB THE BEST PAPER93.9% of users find it useful
Brief Introduction to Basic Statistical Terminology and Concepts
Read Text Preview

Extract of sample "Brief Introduction to Basic Statistical Terminology and Concepts"

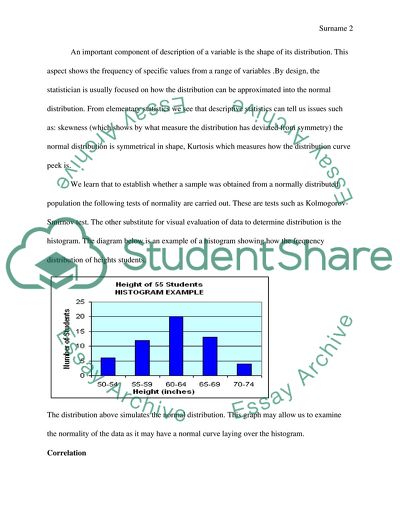
Basic Statistics Introduction The purpose of this paper shall be to give a brief introduction to basic statistical terminology and concepts. Statistics is used as a tool in various areas such as business, economics, industrial sector, finance, and engineering among others. The topics chosen have been comprehended to give the necessary elements of the general know how of the “quantitative nature of reality” (Nisbett, Fong, Lehman and Cheng 625-631).The subject is as broad as can be but we shall look at basic statistics concentrating on the three subtopics: Descriptive Statistics, Correlations and the t-test for independent samples as part of the basic statistics. Body Descriptive Statistics The most used descriptive statistic is the mean. By definition, mean is a measure of central tendency of a variable recorded side by side the confidence intervals; statistics are particulars of a sample. We are usually concerned with statistics (such as mean) of a sample only to the degree to which they can influence the population under study. For example from a sample of 20 schools within district a researcher can calculate the mean consumption in liters of milk per school and make an inference on the total demand for milk for the district. The confidence level for the mean gives the range of values within which the true mean of the population is expected to lie. For example if the mean of a sample is 23 the lower and upper limit at a significance level of 5% is expected 19 and 27 .The ramification of this statement is that there is a 95% probability that the mean of the sample is less than 27 or larger than 19. The smaller the confidence level the larger the probability of error for the research or study. An important component of description of a variable is the shape of its distribution. This aspect shows the frequency of specific values from a range of variables .By design, the statistician is usually focused on how the distribution can be approximated into the normal distribution. From elementary statistics we see that descriptive statistics can tell us issues such as: skewness (which shows by what measure the distribution has deviated from symmetry) the normal distribution is symmetrical in shape, Kurtosis which measures how the distribution curve peek is. We learn that to establish whether a sample was obtained from a normally distributed population the following tests of normality are carried out. These are tests such as Kolmogorov-Smirnov test. The other substitute for visual evaluation of data to determine distribution is the histogram. The diagram below is an example of a histogram showing how the frequency distribution of heights students. The distribution above simulates the normal distribution. This graph may allow us to examine the normality of the data as it may have a normal curve laying over the histogram. Correlation This is the measure of relation between two or more variables. Mostly the kind of data used is usually is interval but there are correlation coefficients that are designed specifically for other data types. Correlation coefficients range from -1 to +1 where -1 stands for a perfectly negative relationship while +1 means a perfectly positive correlation whereas 0.00 means lack of correlations. The most widely used is the person correlation also known the linear correlation coefficient. The Simple Linear Correlation (r) undertakes that two variables are measured on interval scale. The coefficient seeks to determine the degree to which the two variables are proportional to one another. The correlation coefficient does not depend on the identical measures such as height in centimeters against weight in kilograms. Proportionality simply implies linear relationship. The line is called least squares line; the data points in this method are such that the sum of all squared distances from the points is least (Lewicki and Hill 18-24).The magnitude of the coefficient shows the extent to which the two variables are related. The significance of correlation coefficient will vary depending on the sample from which the sample is collected. The regression assumes that the distribution of the deviations of the data points assume a normal distribution. Using the central limit theorem we are concerned with the assumptions of normality when the sample size is more than 50.Regression lines have outliers which are data points that lie extremely far from the regression line. The outliers have influence on the position of the regression line and ultimately the correlation coefficient. A single outlier can completely change the slope of the slope of the regression line and the correlation coefficient. When the sample size is small then the exclusion or inclusion of an outlier may have significant effect on the correlation coefficient. When there is lack of homogeneity within the sample this might be another cause of biased correlation coefficient value. This makes it only realistic when dealing with data from one experimental group in cases of experimental research (Kenny 1-78). The other problem associated to correlation tests is in cases on non-linear relationship between variables. This problem is usually when using Pearson correlation coefficient. There is no clear solution in cases of monotonous curves or other nonlinear correlations. We may opt to use other non-parametric correlations such as spearman correlation coefficient. Although one may fail to observe linear relationship between variables, causal correlation, one may identify spurious correlation. An example is the correlation between the number of work hours worked by distribution employees and the number of deliveries made. This does not necessarily mean that when there is an increase in the number of employee work hours there is an increase in the number of deliveries. There may be other variables such as amount of traffic the weight load carried by the distribution tracks etc. Student T-test T-test for Independent Samples This is the most commonly uses method to calculate the statistical difference in mean between two groups. An example is the difference in mean in test scores for patients who were subjected to a placebo and another group of students (control) who were not subjected to the placebo. This test can be used as long as the individual samples are normally distributed regardless of the sample sizes. The normality tests earlier discussed can be carried out to test for normality within the samples whereas the F test or Levene’s test can be used to test for equality of variance. The P-level for the test represents the probability of error by which we accept or reject the research hypothesis about the mean difference. When we are running the test statistic at a level of significance, the hypothesis is that there is no difference in mean between variables in question from the two groups. Some researchers have further argued that if the research is towards an expected value you may use one tail test but others suggest the use of two tailed test. When there is need to compare more than two groups as is usually the case in practice, the most appropriate Test is that Analysis of Variance. T-test for Dependent Samples This test helps in eliminating the effect that is resultant from within the groups characteristics. The error resultant is identified and removed before data analysis. When the same sample is tested twice then the within group is eliminated by using the dependent sample T-test to eliminate. Conclusion Statistical methods are very important in business and economics. These methods and techniques are used in management, operations and research and development within a firm. These are just part of the many basic techniques that are very essential in business and economics. In summary descriptive statistics is important in summarizing information and representing information in a more elaborate manner to the reader. Since a great quantity of information in descriptive statistics prudence is necessary in preparation and interpretation of this information. Works Cited Kenny, David. A. Correlation and Causality. Newyork, NY: Wiley. Lewiski, Pawel and Thomas Hill. Statistics: Methods and application. (2002).web 27th July 2012 Nisbett, R.E., Fong, G.T., Lehman, D.R., Cheng, P.W. (1987).Teaching reasoning. Science, 238(4827), 626-631 Read More
Cite this document
  • APA
  • MLA
  • CHICAGO
(Brief Introduction to Basic Statistical Terminology and Concepts Essay Example | Topics and Well Written Essays - 1250 words - 1, n.d.)
Brief Introduction to Basic Statistical Terminology and Concepts Essay Example | Topics and Well Written Essays - 1250 words - 1. https://studentshare.org/statistics/1779603-statistics-term-paper
(Brief Introduction to Basic Statistical Terminology and Concepts Essay Example | Topics and Well Written Essays - 1250 Words - 1)
Brief Introduction to Basic Statistical Terminology and Concepts Essay Example | Topics and Well Written Essays - 1250 Words - 1. https://studentshare.org/statistics/1779603-statistics-term-paper.
“Brief Introduction to Basic Statistical Terminology and Concepts Essay Example | Topics and Well Written Essays - 1250 Words - 1”. https://studentshare.org/statistics/1779603-statistics-term-paper.
  • Cited: 0 times

CHECK THESE SAMPLES OF Brief Introduction to Basic Statistical Terminology and Concepts

Causes and Mechanisms of Behavior Anomalies

Deviating from statistical norms is a notion that has failed the test of time.... The paper "Causes and Mechanisms of Behavior Anomalies" examine whether it is possible to define abnormality and the discussions in this regard will be made with reference to schizophrenia.... There is strong evidence of genetic effects relative to schizophrenia along with bipolar depression....
7 Pages (1750 words) Essay

Critical View on Articles about Research Methods

Thus, Stake (1994) also distinguishes between the same two types of case study, but does it in a more clear way and employs much better terminology, namely: the instrumental case study and the intrinsic case study.... Apparently, Drake's et al attempt to distinguish between the two types of case study research lacks such clarity, while the terminology adopted by the authors seems to be less suitable then the terminology employed by Stake (1994)....
14 Pages (3500 words) Book Report/Review

Methods of Enquiry

The report "Methods of Enquiry" aims at demonstrating the knowledge and understanding of the concepts and principles of the Methods of Enquiry.... Since human beings tend to operate in terms of such data and not in terms of the terminology used in ordinary sciences, this broader outlook is far more applicable in the study of social sciences.... Firstly, it presents a completely realistic approach that the statistical analysis and numerical data used in research based on quantitative research cannot provide....
6 Pages (1500 words) Report

Accounting for Strategy and Management Control

he introduction provides an overview of the organization of the paper, which is helpful to the reader.... But the introduction is written like an abstract that immediately jumps to the conclusion, and does not elaborate on the contextual basis of the study.... By allowing the reader to familiarize himself with the topic from the basis of past experiences or commonly encountered situations, the introduction would have provided the reader a better comprehension of the full implications of the study....
16 Pages (4000 words) Essay

Decision Support System

Danver presented the parameters that need to manipulate or rather clearly needs observation and statistical analysis for taking further decisions.... This report "Decision Support System" focuses on the implementation of one of the DSS techniques in running a group of Hotels or rather implementing this tool into effective management....
9 Pages (2250 words) Report

The Concept of Product in the Context of Marketing

Here, different concepts regarding product marketing shall be discussed.... The present research paper "The Concept of Product in the Context of Marketing" is on product marketing.... nbsp;The entire discussion looked after the various factors related to product marketing.... hellip; A product is a tangible object that can be seen, touched and felt....
12 Pages (3000 words) Essay

The Definition of Abnormality With the Reference to Schizophrenia

For over 200 years, the dominating model in this context has been the biological method that uses medical terminology such as treatment, illness, symptoms and patient, whereby psychiatric systems classify the disorder through the given symptoms.... This coursework "The Definition of Abnormality With the Reference to Schizophrenia" examines whether it is possible to define abnormality, unusual behavior that is not in keeping with the prevailing norms, and the discussions in this regard will be made with reference to schizophrenia....
7 Pages (1750 words) Coursework

Applying Evidence-Based Model in Health and Healthcare

pistemology and Ontology are two philosophical concepts that are vital in the medical field where ontology revolves around invariants or universal realities i.... Today, all medical knowledge production is formulated on the Evidence-Based Approach, practice in health practice/ intervention relying on systematic empirical research or inquiry-based on statistical significance, effectiveness in the treatment of a particular ontological problem say Diarrhea....
5 Pages (1250 words) Term Paper
sponsored ads
We use cookies to create the best experience for you. Keep on browsing if you are OK with that, or find out how to manage cookies.
Contact Us