StudentShare
Contact Us
Sign In / Sign Up for FREE
Search
Go to advanced search...
Free

The Central Limit Theorem - Term Paper Example

Cite this document
Summary
The main aim of this paper “The Central Limit Theorem” is to give a brief introduction about an important topic of the Statistics, which is used in the analysis of Descriptive Statistics with the help of SPSS and also useful in conducting the statistical inference…
Download full paper File format: .doc, available for editing
GRAB THE BEST PAPER95.7% of users find it useful
The Central Limit Theorem
Read Text Preview

Extract of sample "The Central Limit Theorem"

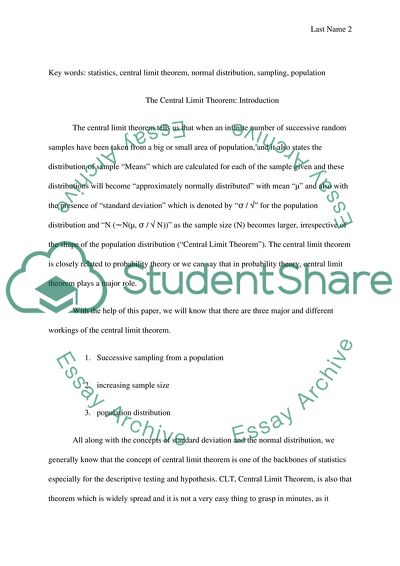
No: The Central Limit Theorem The Central Limit Theorem The main aim of this paperis to give you brief introduction about an important topic of the Statistics, which is used in the analysis of Descriptive Statistics with the help of SPSS and also useful in conducting the statistical inference. Before solving your problems with the help of Central Limit Theorem, you should make sure that you have read all the necessary instructions and notes to understand this topic completely as it is not as easy as it seems to be. Since another basic purpose of this paper is to get you familiar with the Central Limit Theorem and tell you its importance in statistical inference. No doubt, statistics is an important subject, which helps us in all of our researches and testing the reliability of hypothesis and Central Limit Theorem is one of the reliable tests to get the consequence about the hypothesis. Key words: statistics, central limit theorem, normal distribution, sampling, population The Central Limit Theorem: Introduction The central limit theorem tells us that when an infinite number of successive random samples have been taken from a big or small area of population, and it also states the distribution of sample “Means” which are calculated for each of the sample given and these distributions will become “approximately normally distributed” with mean “μ” and also with the presence of “standard deviation” which is denoted by “σ / √” for the population distribution and “N (∼N(μ, σ / √ N))” as the sample size (N) becomes larger, irrespective of the shape of the population distribution (“Central Limit Theorem”). The central limit theorem is closely related to probability theory or we can say that in probability theory, central limit theorem plays a major role. With the help of this paper, we will know that there are three major and different workings of the central limit theorem. 1. Successive sampling from a population 2. increasing sample size 3. population distribution All along with the concepts of standard deviation and the normal distribution, we generally know that the concept of central limit theorem is one of the backbones of statistics especially for the descriptive testing and hypothesis. CLT, Central Limit Theorem, is also that theorem which is widely spread and it is not a very easy thing to grasp in minutes, as it requires deep study and full understanding. In this paper, we have chosen to discuss the central limit theorem and tried to solve the related problems with the help of formulas and testing methods (Chen, Goldstein and Shao 128). Most of the students are highly interested in knowing how the means of samples are taken from the same population, which all have the same size and from the population, which vary about the population mean. All steps solving the problems using CLT are almost similar to the steps we use to use in solving the problems with the help of “The Normal Distribution" (Chen, Goldstein and Shao 134). If we have single data and individual values, we can use in order to calculate a z-score in the Normal Distribution, but now in the Central Limit Theorem, we have to use where n is the sample size. What is statistics? “Statistics is the study of how to collect, organizes, analyze, and interpret numerical information from data.” (“Central Limit Theorem – CLT”). Central Limit Theorem Defined It is not really difficult to understand the idea Central Limit Theorem although it is really an important topic of statistic and is necessary to understand hypothesis tests of means. “A statistical theory that states that given a sufficiently large sample size from a population with a finite level of variance, the mean of all samples from the same population will be approximately equal to the mean of the population.” (“Central Limit Theorem – CLT”). As Per Collins English Dictionary (2012), the central limit theorem can be defined as “the fundamental result that the sum (or mean) of independent identically distributed random variables with finite variance approaches a normally distributed random variable as their number increases, whence in particular if enough samples are repeatedly drawn from any population, the sum of the sample values can be thought of, approximately, as an outcome from a normally distributed random variable” (“Central Limit Theorem”). Why Is This Important? The answer of this question is as easy as the result of your statistical test. The methods of central limit theorem are the base for all tests of “Means.” It simply provides a set of simple rules for determining the mean, variance, and shape of a distribution of sample means. Distributions of sample means are used in all hypothesis tests with means (“Central Limit Theorem”). General Procedure of sampling The general procedure of Sampling requires that we first draw some successive samples from a given and chosen size of population. In choosing the successive samples, we have to make it sure that all the samples are chosen randomly but are of the same size. There must be no liking or disliking involved in choosing the samples from a given population but the size of samples must be same (Rice 76).  Calculate the mean The next step is of calculating the Mean from the chosen sample and for each sample, we will find the Mean which will be called the sample means. This process is a distribution of sample means. A method of recording means of an “infinite" number of samples means, is called the “sampling distribution of the mean.” (Rice 92).  Successive Sampling Frequency distributions of means of all chosen samples is a very quick and easy approach which lead us in finding the Normal distribution and if we are choosing less sample means in order to get our result, small samples from a population that is not normally distributed. As in order to get the means from samples, we first select more and more samples randomly, from the given population by making sure that all samples are of same size. In this case, the distribution of means of all the chosen samples become more Normal and it becomes easy to handle and smoother to work on (Borodin, Ibragimov and Sudakov 8)  If the number of chosen random samples is “infinite", then the sampling distributions of all the means of samples have a normal distribution, without any doubt, with a mean that is almost equal to the mean of population which is denoted by the (μ). Increasing the Size of Samples As we increase the size of our samples, we are defiantly using a normal distribution approach for the distributions of our samples. Nevertheless, with the successive random samples, whose number is infinite, the answer we will get with as the mean of the sampling distribution will be equal to the mean of our selected population as (μ) (Voit 124).  When the size of sample increased, the unpredictability of each sampling distribution literally decreases and thus the results of sampling distribution become all the time more and more leptokurtic. And in this case the range of the sampling distribution is smaller than the range of the original population. The standard deviation of each sampling distribution is equal to “s/ÖN” (where N is the size of the sample drawn from the given population). If results of the sampling distributions are taken together, these distributions simply suggest that the mean of the sample provides a good estimation about the mean of population μ and also tells us that errors in our estimation (indicated by the variability of scores in the distribution) has been decreased when the size of the samples are increased which we have drawn from the population (“Central Limit Theorem”). Population Distributions The rules of the successive sampling and increasing sample size work for all distributions. We can rely on the sampling distribution of the mean as it is accepted as being approximately normally distributed. In this case, it does not matter what the original population distribution looks like if the sample size is taken large.  Hypothesis Tests It is always good to know the relationship of CLT and Hypothesis test and to know how does the central limit theorem help us when we are testing hypotheses about sample Means? In case if one does not know the distribution score of the original population and he has drawn large samples to get the sampling distribution from the means of the samples taken, he still knows that the distributions of his sampling will be normal or approximately normal with mean μ and standard deviation σ/√N. it is also good knowing the properties of the sampling distribution as it allows us to continue with the test, even if we dont know what the population distribution looks like (“Central Limit Theorem”). Conclusion The conclusion of this paper says the following major things about the Central Limit Theorem: The central limit theorem applies only to sample means; and we believe that the test of central limit theorem cannot be applied to any other statistic as it is only for descriptive research method. The central limit theorem clarify about what to expect of the distribution of sample means and also give us reliable answer about when we can take an infinite number of samples of a given size from a population which is also relatively large from the previously chosen samples. The central limit theorem works in all the good ways and it really does not matter what shape population distribution have and how it has been shaped. The central limit theorem also helps us in testing the hypotheses about the means because it tells us what to expect when we draw samples from a population. Works Cited Chen, L.H.Y., Goldstein, L., and Shao, Q.M. Normal approximation by Steins method. London: Springer, 2011.  Borodin, A. N., Ibragimov, Ildar Abdulovich and Sudakov, V. N. Limit theorems for functionals of random walks. New York: AMS Bookstore, 1995. (Theorem 1.1, p. 8). “Central Limit Theorem – CLT”. Investopedia. Investopedia US, A Division of ValueClick, Inc., 2012. Web. 31 July 2012. . "Central limit theorem." Collins English Dictionary - Complete & Unabridged 10th Edition. HarperCollins Publishers, 2012. Web. 01 Aug. 2012. . “Central Limit Theorem”. Wadsworth Cengage Learning. Cengage Learning Inc., 2005. Web. 31 July 2012. . Rice, John. Mathematical Statistics and Data Analysis. (Second ed.). Duxbury: Duxbury Press, 1995.  Voit, Johannes. The Statistical Mechanics of Financial Markets. Springer-Verlag, 2003. p. 124.  Read More
Cite this document
  • APA
  • MLA
  • CHICAGO
(The Central Limit Theorem Term Paper Example | Topics and Well Written Essays - 1750 words, n.d.)
The Central Limit Theorem Term Paper Example | Topics and Well Written Essays - 1750 words. Retrieved from https://studentshare.org/statistics/1779551-statistics-term-paper
(The Central Limit Theorem Term Paper Example | Topics and Well Written Essays - 1750 Words)
The Central Limit Theorem Term Paper Example | Topics and Well Written Essays - 1750 Words. https://studentshare.org/statistics/1779551-statistics-term-paper.
“The Central Limit Theorem Term Paper Example | Topics and Well Written Essays - 1750 Words”, n.d. https://studentshare.org/statistics/1779551-statistics-term-paper.
  • Cited: 1 times

CHECK THESE SAMPLES OF The Central Limit Theorem

Hypothesis Testin Paper

The Central Limit Theorem states that for large sample sizes (n > 30) drawn randomly from a population, the distribution of the means of those samples will approximate normality, even when the data in the parent population are not distributed normally.... An aquaculture farm takes water from a stream and returns it after it has circulated through the fish tanks....
4 Pages (1000 words) Essay

Binary Outcome Using Proportion

Using The Central Limit Theorem, the probability that a sample proportion will fall within a given interval can be stated.... central limit theorem (CLT) for a Proportion states that “As sample size increases, the distribution of the sample proportion p = x/n approaches a normal distribution with mean π and standard deviation....
3 Pages (750 words) Assignment

The Problem Of Planning

Researchers based on statistical analysis are reliable only when they are thoughtfully planned.... The paper "The Problem Of Planning" discusses how the researcher may be able to obtain approximate results about the behavior of the distribution of an estimator as the sample size becomes large.... hellip; Relative to the objectives of the study, sample distribution must be of adequate size....
4 Pages (1000 words) Essay

Homework: Week 6, Chapter 6

This shows the relationship that exists between Sampling Distribution of Mean and The Central Limit Theorem.... central limit theorem According to this theorem, sample means distribution draws closer towards a normal distribution, with augment in sample size for a population with any dimension....
1 Pages (250 words) Essay

Statistics class

5) Because the sample size of the data is large enough (n> 30), The Central Limit Theorem will apply, and no assumptions have to be made about the population of the credit customers.... It means that we are 95% confident that population proportion of customers who live in urban area lie between the lower and the upper limit of the...
6 Pages (1500 words) Assignment

Analysis of questionnarie

Competitive scope of the corporate world that establishes barriers to entry into a market and sustainability in a market establishes the role of statistics in informing decisions.... Applying statistics, as Siegel explains (3), improves an individual's competence in… Data analytics also empowers decisions through model developments that can forecast a variable (Hann & Doganaksoy n....
4 Pages (1000 words) Research Paper

Activity on Node Network Diagram

In the paper “Activity on Node Network Diagram” the author analyzes an Activity on Node (AON) network diagram, which is initially developed to indicate the sequence of activities.... Two critical paths (CP) have been identified as G-Q-P-R-K-S-T and G-Q-P-R-S-T.... The expected completion time is 122 days....
3 Pages (750 words) Assignment
sponsored ads
We use cookies to create the best experience for you. Keep on browsing if you are OK with that, or find out how to manage cookies.
Contact Us