StudentShare
Contact Us
Sign In / Sign Up for FREE
Search
Go to advanced search...
Free

The Growth of World Exports - Research Paper Example

Cite this document
Summary
In the paper “The Growth of World Exports” the author discusses factors that may have contributed to the growth of world exports between 2000 and 2007. World trade exports growth in the years between 2000 and 2007 has been caused by first, the major emerging economies that include China, India…
Download full paper File format: .doc, available for editing
GRAB THE BEST PAPER91.4% of users find it useful
The Growth of World Exports
Read Text Preview

Extract of sample "The Growth of World Exports"

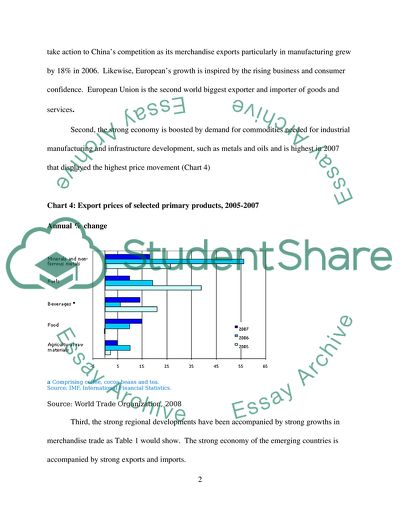
International Trade Statistics Answers to assessment questions Answers to question no 1 Factors that may have contributed to the growth of world exports between 2000 and 2007. Growth in the volume of world merchandise exports and production, 2000-2007 (Annual percentage change)   2000-07 2005 2006 2007 World merchandise exports 5.5 6.5 8.5 6.0 Agricultural products 4.0 6.0 6.0 4.5 Fuels and mining products 3.5 3.5 3.5 3.0 Manufactures 6.5 7.5 10.0 7.5 World merchandise production 3.0 3.0 3.0 4.0 Agriculture 2.5 2.0 1.5 2.5 Mining 1.5 1.5 1.0 0.0 Manufacturing 3.0 4.0 4.0 5.0 World GDP 3.0 3.0 3.5 3.5 Note: See the Metadata for the estimation of world aggregates of merchandise exports, production and GDP. Source: World Trade Organisation June 2010. Relating to the table above, world trade exports growth in the years between 2000 and 2007 has been caused by first, the major emerging economies that include China, India notably in 2006, followed by the European Union and the Asean countries (Table 1). China is fast approaching the value of the United States in terms of exports and is an important destination for imports. India and the Asean countries have also shown export growth in these years. India’s export growth is fast growing that is already similar to China. In the same way, Asean countries take action to China’s competition as its merchandise exports particularly in manufacturing grew by 18% in 2006. Likewise, European’s growth is inspired by the rising business and consumer confidence. European Union is the second world biggest exporter and importer of goods and services. Second, the strong economy is boosted by demand for commodities needed for industrial manufacturing and infrastructure development, such as metals and oils and is highest in 2007 that displayed the highest price movement (Chart 4) Chart 4: Export prices of selected primary products, 2005-2007 Annual % change a Comprising coffee, cocoa beans and tea. Source: IMF, International Financial Statistics. Source: World Trade Organization, 2008 Third, the strong regional developments have been accompanied by strong growths in merchandise trade as Table 1 would show. The strong economy of the emerging countries is accompanied by strong exports and imports. Fourth, export growth receives continued support from the world economy. As table 1 below shows, the combined merchandise exports of major economies integrate into the strong export growth of the world of 6.5% in 2005, 8.5% in 2006 followed by a decline of 5.5% in 2007. In 2007, effect of recession is starting to appear as trading slows down in most of the countries, with exception of the emerging economies that displayed its strength beyond crisis. We have seen China, Asia and India emerged as strong exporters. Table 1: GDP and merchandise trade by region, 2005-07 Annual % change at constant prices   GDP Exports Imports   2005 2006 2007 2005 2006 2007 2005 2006 2007 World 3.3 3.7 3.4 6.5 8.5 5.5 6.5 8.0 5.5 North America 3.1 3.0 2.3 6.0 8.5 5.5 6.5 6.0 2.5 United States 3.1 2.9 2.2 7.0 10.5 7.0 5.5 5.5 1.0 South and Central America a 5.6 6.0 6.3 8.0 4.0 5.0 14.0 15.0 20.0 Europe 1.9 2.9 2.8 4.0 7.5 3.5 4.5 7.5 3.5 European Union (27) 1.8 3.0 2.7 4.5 7.5 3.0 4.0 7.0 3.0 Commonwealth of Independent States (CIS) 6.7 7.5 8.4 3.5 6.0 6.0 18.0 21.5 18.0 Africa and Middle East 5.6 5.5 5.5 4.5 1.5 0.5 14.5 6.5 12.5 Asia 4.2 4.7 4.7 11.0 13.0 11.5 8.0 8.5 8.5 China 10.4 11.1 11.4 25.0 22.0 19.5 11.5 16.5 13.5 Japan b 1.9 2.4 2.1 5.0 10.0 9.0 2.5 2.5 1.0 India 9.0 9.7 9.1 21.5 11.0 10.5 28.5 9.5 13.0 Newly industrialized economies (4) c 4.9 5.5 5.6 8.0 12.5 8.5 5.0 8.5 7.0 a Includes the Caribbean. b Trade volume data are derived from customs values deflated by standard unit values and an adjusted price index for electronic goods. c Hong Kong, China; Republic of Korea; Singapore and Chinese Taipei. Source: WTO Secretariat. 1.2 Distinction between tariff and quota and why tariffs are preferable to quotas (i.e. quantitative restrictions) as a method of controlling imports Tariff and quotas are both methods of controlling imports but tariff is preferred over the other because of its advantages. Tariff is a tax placed on imported or exported goods while quota is a government imposed limit on importation of goods. Tariff is a source of revenue for government and frequently imposed to protect domestic producers from foreign competition (Boyes & Melvin, 2000.p. 494). For instance, a country that does not produce cars may place tariff on importing cars. The quantity imported will be controlled because of the increase in price and the lessened demand for the cars because of price. The tariff has an effect of reducing importation. Quota is another government tool that puts a limit to the quantity or value of goods and services imported and exported. A quota may be imposed through quantity quota or a value quota. In a quantity quota, the physical amount of good is restricted. For example, the United States has a U.S. quota for its sugar importation that is set yearly that depends on their domestic needs. For 2010, U.S. quota based on quantity is 1.471 million of sugar (Bjerga, 2010). Another kind of restriction related to quota is value quota that restricts the money value of the product, so instead of physical quota, the U.S. could limit the dollar value of sugar imported (Boyles & Williams, 494) Two kinds of quota policy are imposed by the government, the tariff quota and the import quota (Mofatt. n.d.) A tariff quota allows importation of certain goods at a specified quantity at lower rate or duty free and any excess of the quota is charged at a higher rate while import quota restricts an absolute importation of goods or services. Quota as opposed to tariff is more exposed to corruption (Mofatt) as the following scenario would show: Supposing the current demand for imported cars in the U.S. is 20,000 units. But government policy restricts importation and set a quota of 10,000 units only for the year. The problem that lies in the decision is how they decide on from which country to give this quota, or which car manufacturer should they give the quota. A lot of power now lies in the hands of customs officials as they have access to favour importers to the detriment of quota holders. Question 2 Answers 2.1 In reference to the graph carefully analyse the international trade in goods and services as reported on the United Kingdom’s balance of payments between 2004 and the first half of 2009. The graph could be explained as a continuing deficit in balance of trade between UK and its trading partners from year 1997 to 2009. Although there are some varying points of deficit, it came to the highest deficit in trade in goods in 2007 to 2009. As reported in Trading Economics (n.d.), UK is highly dependent on foreign trade as it imports almost all its copper, ferrous metals, lead, zinc, rubber, raw cotton needed for manufacturing process, and one third of its food requirement. UK exports telecommunications equipment, automobiles, automatic data processing equipment, medicinal and pharmaceutical products and aircrafts to EU countries, U.S. China and Japan. As shown, service is a significant sector of the UK economy that shows consistent generating surpluses. The graph shows a widening gap between surplus in services and a deficit in trade in goods, which if taken together produces a total deficit or a trade gap. In simple terms, UK has a negative balance of trade because it is importing more than what it exports (Trading Economics.) 2.2 Measures the UK government or any other government faced with similar trade position could adopt to rectify the imbalance on the current account. Simple measure to correct imbalance on current account or BOP of a country is to export more to earn foreign exchange or to reduce imports. This measure is easily said than done because of the many intricacies of the policies involved such as government policy measures in form of monetary, fiscal and non monetary measures. Monetary methods to correct imbalances include deflation, exchange depreciation, devaluation and exchange control (Guarav, 2010). Deflation is an action by the government thru monetary and fiscal policies. In monetary policies, government encourages open market operations or sets up a bank rate policy. In fiscal policy, government may impose higher taxes, or a reduction of public spending. Deflation results to favourable balance of trade as imports fall due to higher taxation and reduction of income. This also results to cheaper prices of goods that increases demand from foreign market (Akrani, 2010). An exchange depreciation is a device used by a country that has adopted a flexible exchange rate policy. This is best explained when for instance, the exchange rate of Australia is $1= AUS$43. When something adverse happen to the economy of Australia, Australians demand for US$ will rise, thus inducing the price of dollars in terms of Australian dollars will rise. In this situation, dollar will appreciate in external value and the AU$ will depreciate in external value. Thus, the new rate will be $1= AUV $50. A depreciation therefore stimulates exports and reduce exports, thus balances BOP of the country. Devaluation is also relative to depreciation because this is a deliberate attempt of the government to bring down their home currency against foreign currency. This mechanics is a reduction in the exchange rate, that means it takes more of the national currency to buy one unit of foreign currency (Effron & Santos. 2000, p. 3). In our example, $1= AUS 43 before devaluation. After devaluation, the value of $1=AUS 50, you need more money to buy same amount of U.S. dollars; then the value of our product becomes cheaper in the world. This is so because dollar is exchanged for more AUS that eventually pushes up export demand because of cheaper price. Likewise, it restrains importation as there will be a need for more dollars and it becomes more costlier. An example of a country that has remained under a devaluation policy is China that has manipulated its currency and had succeeded to become the world’s export leader (Crikey.com. 2009) An exchange control is another measure of correcting BOP but it is only done for emergency measures that need to control economic situation in turning from bad to worse. Under this set up, the Central Bank takes control of all the foreign exchange dealings and orders all exporters to surrender their foreign exchange to the central authority; likewise foreign reserves are restricted only to purchases of essential goods. Non-monetary controls comes from tariffs, quotas, export promotion and import substitution. Tariff and quotas are control efforts of the government to correct trade imbalances have been previously discussed, while export promotion and import substitution are strategies that are designed to stimulate development (Boyes & Melvin, p. 450) Import substitution is a strategy of substituting locally produced manufactured goods for imported goods. The idea behind this is the development of domestic industry to supply the domestic market that is usually done with the protection of the government such as tariffs and quotas. An export promotion is an out-ward oriented strategy wherein the export capability of the country competes with the rest of the world. Here, the government stimulates growth, and occurs when there is abundant resources in the country as labour (Meir,1989, p.304) For example, sugar production is major export of Cuba, Colombia is for coffee production and the Ivory Coast is on to cocoa production. One greater advantage to export promotion is more employment is generated to produce the products exported and improves the income of people. When more goods are exported, money is created for importations that eventually balance the trade position of the country. Question 3 Somali pirates have hijacked a Saudi oil super-tanker “The Sirious Star”. The tanker was loaded to capacity with two million barrels of oil valued at about one hundred million dollar. Its destination was an oil depot in China and the terms of sale documented as Direct Duty Paid (DDP). BBC, 20 Nov. 2008. Describe the term of shipment and sale of this shipment and carefully assess the distribution of responsibilities and risks associated with Direct Duty Paid (DDP), Ex Works (EXWKS), Free on Board (FOB) and Cost Insurance and Freight (CIF).   DDP. In relation to the above scenario, seller has the responsibility to pay the costs of the two million dollar worth of barrels of oil because of the Direct Duty Paid (DDP) arrangement. In DDP, it is the responsibility of the seller to pay all the shipping costs and insurance, and to take all the accountability of transferring the goods to the buyer. Further, under this arrangement, if goods are damaged or lost in transit, which happened at the Somali pirates hijack, seller will be responsible for the costs (Investopedia). Ex-Works. Referring again to the hi-jack scenario, the seller has no obligation to pay the seller because under the EX Works transactions (EXWKS), delivery is accomplished once it is released to the buyer’s forwarder. Once the item is released from the seller’s warehouse, responsibility is transferred to buyer and the transaction of seller and buyer is closed. Under Ex Works, buyer takes responsibility of making arrangement with forwarders for the insurance, export clearance and all export paperwork (Incoterms) FOB. The Free on Board has a similarity on Ex-Works, but the only difference is that under the terms of sale, the price quoted by the seller includes all the charges up to the time that the goods are placed on board a ship at the port of departure specified by the buyer, as in F.O.B. San Francisco (Business Dictionary). In the hi-jack scenario, seller has no longer a liability to the buyer because his responsibility ends when the barrels of oil were loaded on The Sirious Star. CIF. In the cost, insurance and freight arrangement (CIF), the terms of sale offered by buyer is the inclusion of a minimum amount of insurance coverage from his warehouse up to the named port of destination, and the responsibility for transportation risk is transferred to buyer as soon as the product is loaded onto the ship (Business Dictionary, n.d.) The CIF arrangement is also similar to the FOB arrangement but in the CIF, there is a minimum insurance coverage from the seller’s warehouse up to the port of destination. In effect, the Ex-Works, FOB, and CIF releases the responsibility from seller after delivery of goods are picked up, or delivered to the port of destinations. It is noted that seller’s price include shipping arrangement within which buyer has to pay. References list Bjerga, Allan, 2010, US raises raw sugar import quota by 300,000 tons in second 2010 increase, Bloomberg, Viewed 04 March 2011, Read More
Cite this document
  • APA
  • MLA
  • CHICAGO
(“The Growth of World Exports Research Paper Example | Topics and Well Written Essays - 2500 words - 3”, n.d.)
The Growth of World Exports Research Paper Example | Topics and Well Written Essays - 2500 words - 3. Retrieved from https://studentshare.org/statistics/1749376-international-trade
(The Growth of World Exports Research Paper Example | Topics and Well Written Essays - 2500 Words - 3)
The Growth of World Exports Research Paper Example | Topics and Well Written Essays - 2500 Words - 3. https://studentshare.org/statistics/1749376-international-trade.
“The Growth of World Exports Research Paper Example | Topics and Well Written Essays - 2500 Words - 3”, n.d. https://studentshare.org/statistics/1749376-international-trade.
  • Cited: 0 times

CHECK THESE SAMPLES OF The Growth of World Exports

How a weak currency effects exports vs. imports

Weak Currency Effect on exports vs.... Imports 30th, September 2012 Weak Currency Effect exports vs.... Weak Currency Effect on exports vs.... Imports 30th, September Weak Currency Effect exports vs.... A weak currency makes the country's imports more expensive but its exports cheaper, which contributes to the economic crisis if a country is import orientated or has immense debts.... This research paper seeks to elaborate on the effects of a weak currency on exports vs....
3 Pages (750 words) Research Paper

Export-Led Growth Theory

In the adoption of export-led economic systems, governments often have to institute a number of measures such as tariff reduction, establishment of a floating exchange rate, especially through the devaluation of the national currency to enhance exports and government assistance for exportation industries and sectors (Liebler & Ward 1992, p.... The purpose of export-led strategy is to discover a niche market in the global economy for a country's exports.... 3), however, poises that if export-led growth was the real justification for episodes of high growth in GDP and exports, then countries that adopted the system should have experienced appreciation in real exchange rates....
5 Pages (1250 words) Essay

International Economics

3The industry has high growth potential as exports increased by 42.... Presently, the US meets at least 45% of the world's carpet needs.... Technological progress is one of the primary reasons behind massive growth in the US carpet industry.... Name: Instructor: Course: Date: International Economics Question 1 1The carpet production process in India is largely reliant on labor rather than capital....
5 Pages (1250 words) Essay

Should Government Assist Business

Encouraging exports is a primary concern of most governments.... In United States, the government has constantly been engaged in providing assistance to small business to enable them to stand and work on their own.... This assistance provided to small businesses,… Business is assisted when the Government grants patent and copyright privileges; fixes standards of weights and measures; makes various loans available; sets up tariff schemes and other import restrictions; assists in foreign operations; provides for a postal system; conducts and encourages research and development; pays out vast sums for goods, services, and transfer payments; and helps in maintaining a sound banking system (Isaacs & Slesinger, 1964, p....
6 Pages (1500 words) Essay

Industrialization of East Asia

More specifically, outward orientation is a trade policy characterized with absence of bias against exports, active promotion of exports and low trade barriers (Mody, 1999, p.... Outward orientation is an absence of bias against exports (Bromley, Mackintosh and Brown, 2004, p.... An inward orientation is an attempt to withdraw from the full participation of a country in the world economy.... This paper presents economic significance of both outward orientation and export promotion in order to help a country gain better role in international marketing and achieve economic growth....
5 Pages (1250 words) Essay

Economic Assessment for the US Economy

This signaled a growth of 2.... the growth was predicted amidst This paper assess a year by year economic indicators from the year 2012 to the year 2014 Economic growth is the measure of the change in gross domestic product, abbreviated as GDP.... Economic theory asserts that an economy's GDP consists of total consumption, total investments and net exports; the latter is the difference between the total value of exports and imports....
8 Pages (2000 words) Essay

Japan in the World Economy

The exports in terms of value are an important element in the present Japanese economic adjustment.... The structure of exports, as well as imports, has changed considerably over the years.... The above graph shows the trends in exports value from 1980 to date.... There has been a constant growth in exports since the 1980s till 2000 with minor fluctuations in between.... These exports can be attributed to the increase in IT-related goods, consumer goods and the US been the largest trading partner....
7 Pages (1750 words) Research Paper

Germany vs Mexico - Countries Performance Growth

8 percent over the same period while the growth rate in Germany is estimated at 2.... As a result of Germany income, the growth rate is far much better than Mexico.... Germany economy also exports most of its products making it realize more incomes from international markets increasing its revenue base as compared to Mexico who produces majorly for the local consumption.... Germany is an economy based in the Eurozone and a prominent of manufacturing hence one of the leading exporters in the region while Mexico is a country based in South America that belong to almost a third world country....
2 Pages (500 words) Essay
sponsored ads
We use cookies to create the best experience for you. Keep on browsing if you are OK with that, or find out how to manage cookies.
Contact Us